Copyright
©The Author(s) 2022.
World J Gastrointest Oncol. Nov 15, 2022; 14(11): 2253-2265
Published online Nov 15, 2022. doi: 10.4251/wjgo.v14.i11.2253
Published online Nov 15, 2022. doi: 10.4251/wjgo.v14.i11.2253
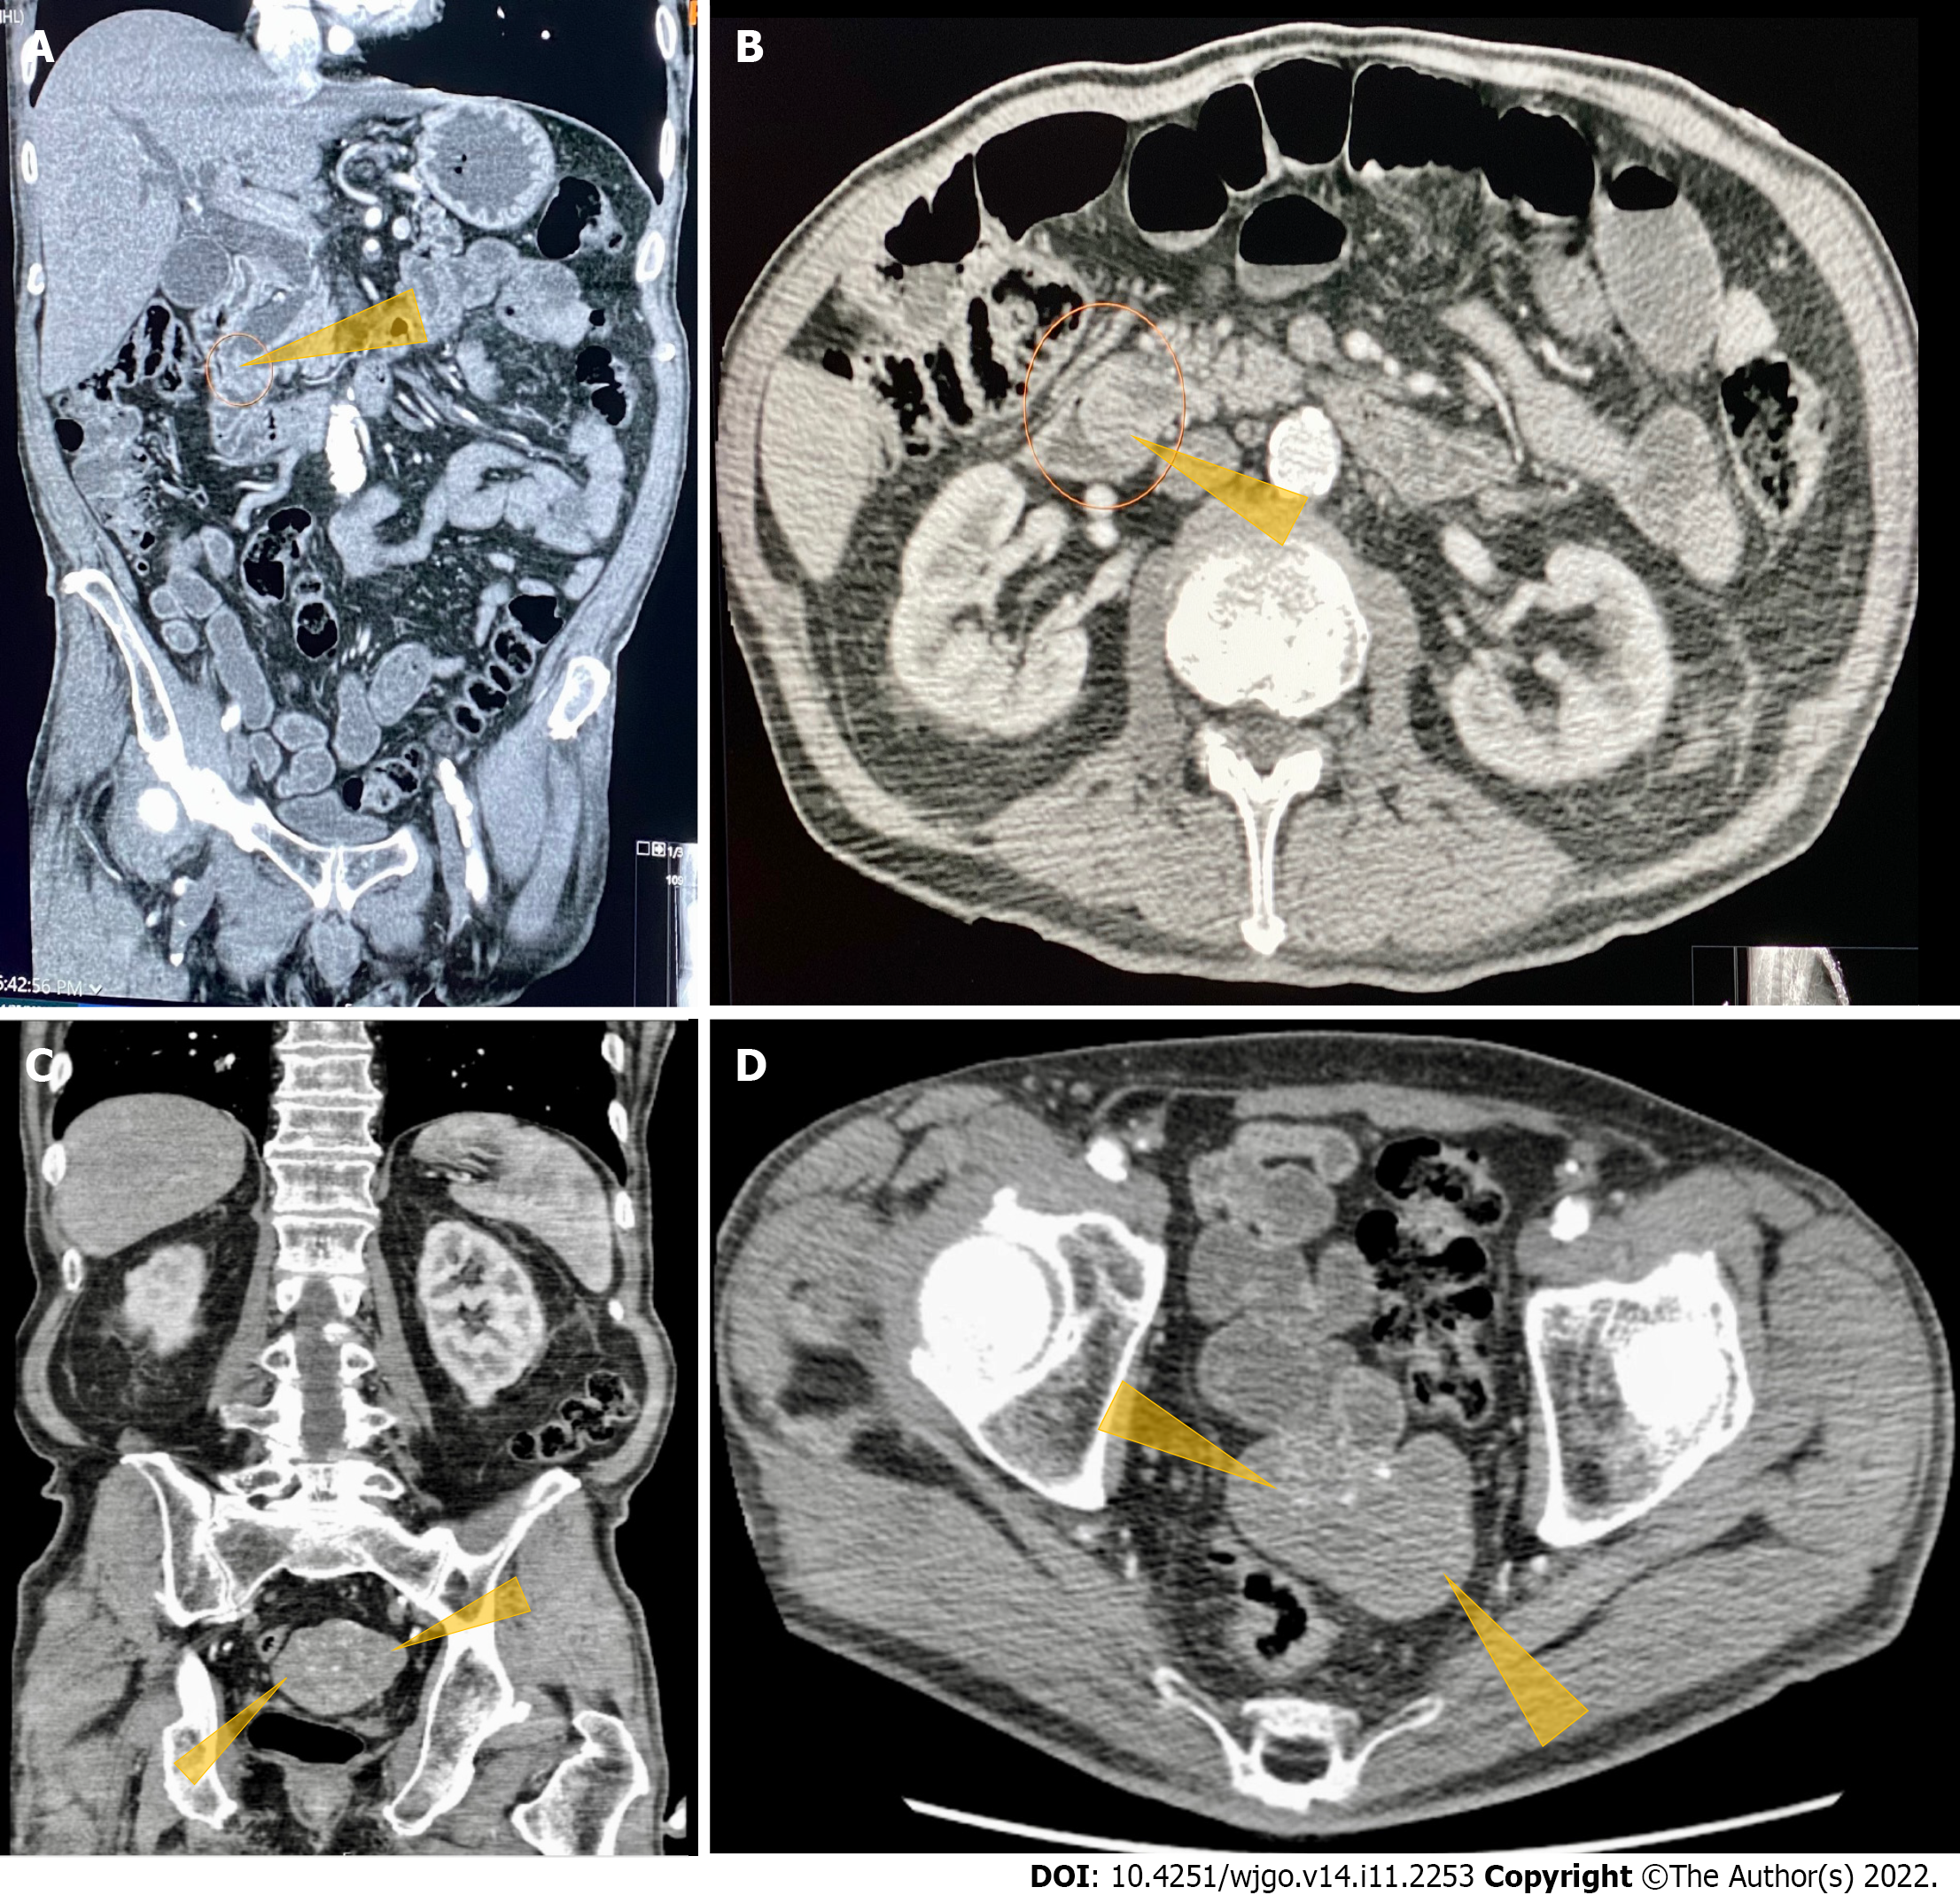
Figure 1 Computerized tomography of the abdomen and pelvis with contrast images.
A: Computerized tomography (CT) abdomen and pelvis with contrast. Coronal section shows obstructed distal common bile duct (CBD) due to a 9 mm polypoid intraluminal (pointed yellow arrows) lesion in the distal CBD; B: CT of the abdomen and pelvis with contrast. Axial section shows polypoid, soft tissue mass at the level of distal common bile duct (pointed yellow arrows); C: CT of the abdomen and pelvis with contrast. Heterogeneously enhanced lobulated mass with punctate calcifications (pointed yellow triangles) in the posterior pelvis originating from the serosal surface of the pelvic small bowel; D: CT of the abdomen and pelvis with contrast. Axial section shows a heterogeneously enhanced lobulated mass with punctate calcifications (pointed yellow triangle) in the posterior pelvis originating from the serosal surface of the pelvic small bowel.
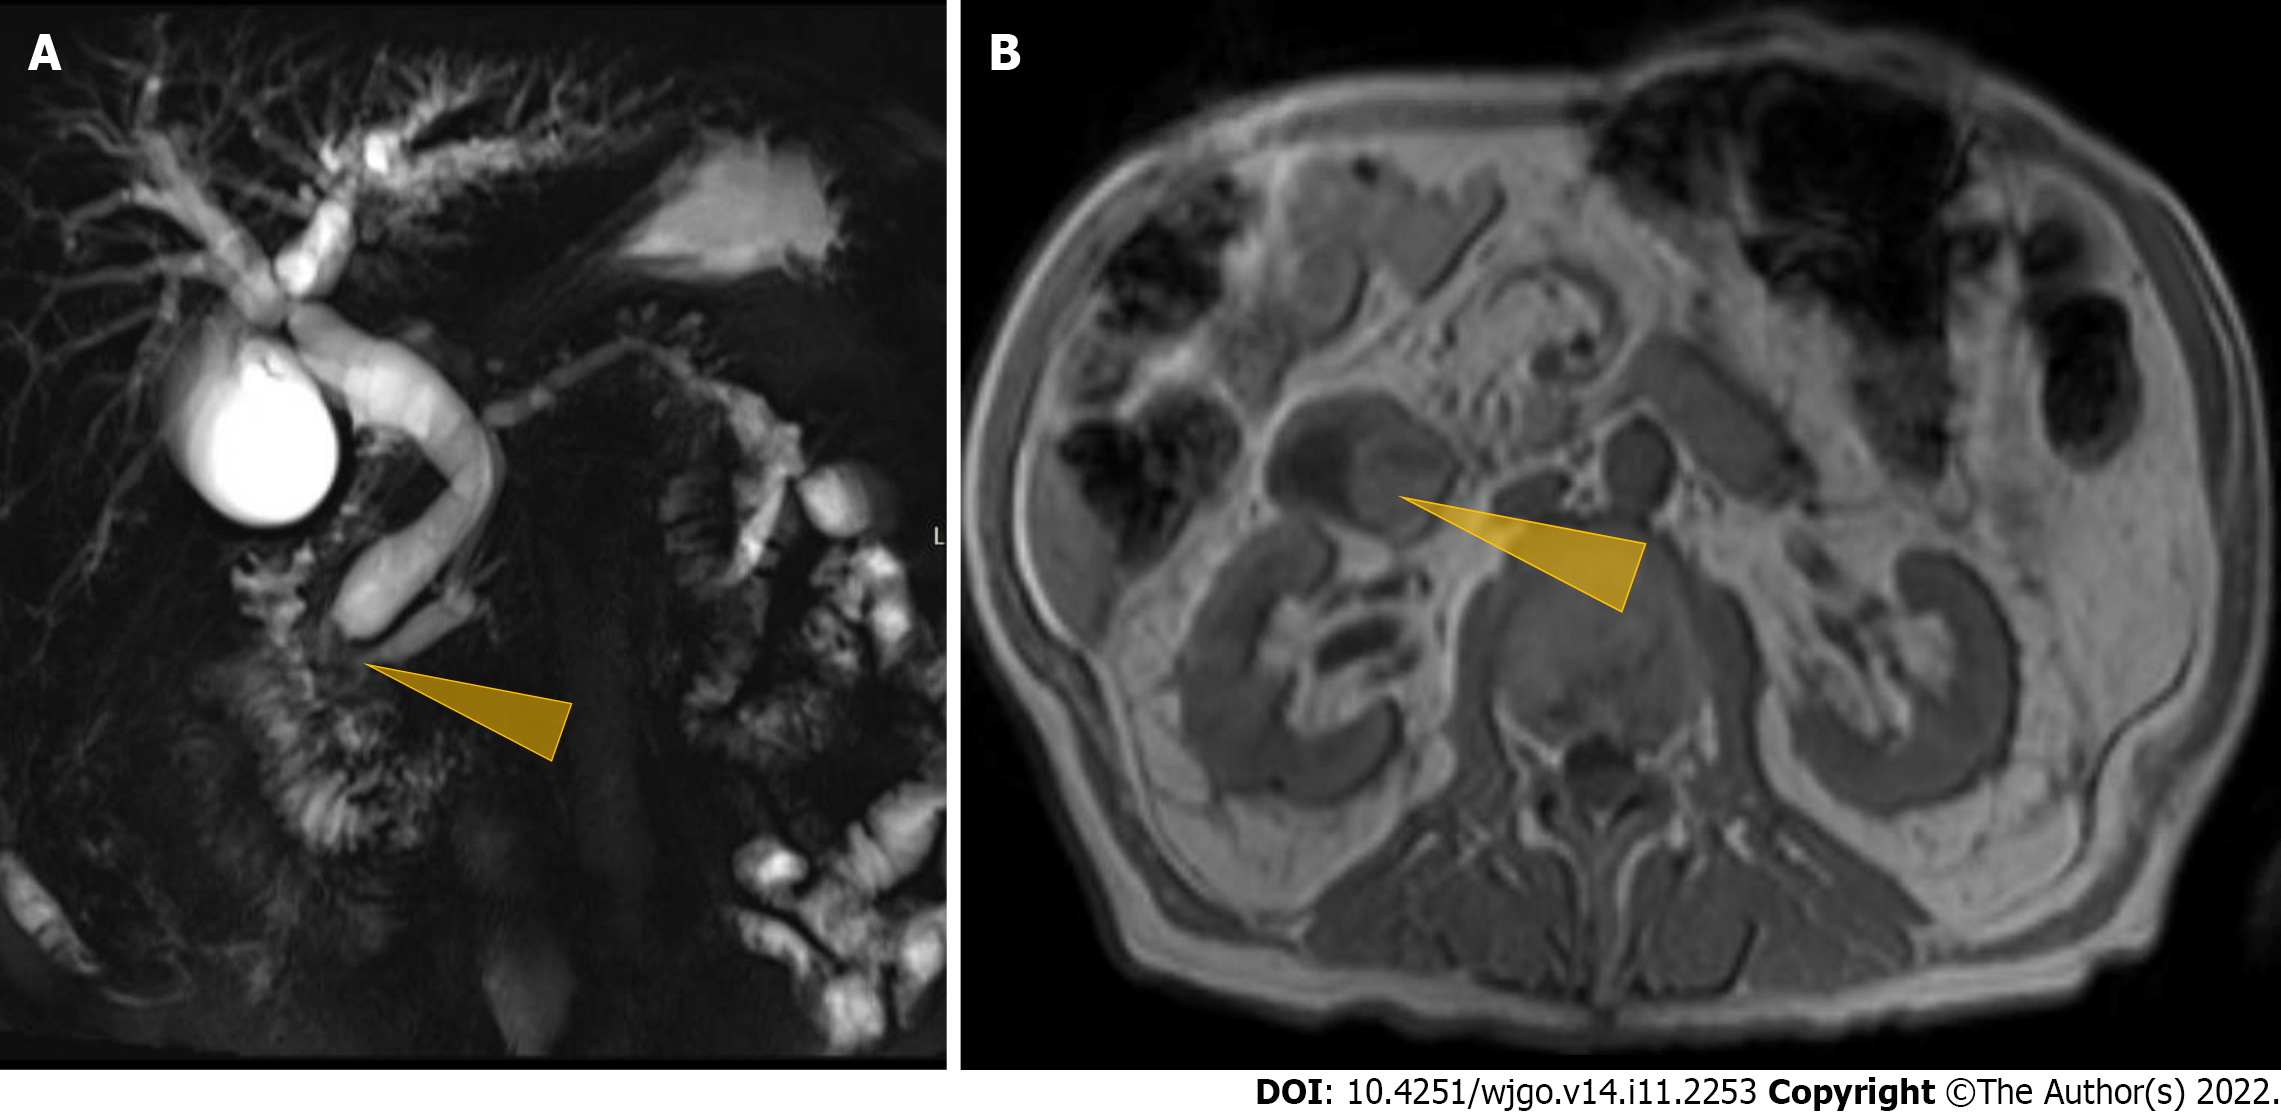
Figure 2 Magnetic resonance cholangiopancreaticography imaging studies.
A: Magnetic resonance cholangio pancreaticography image showing intra and extrahepatic biliary dilatation and a polypoid mass was noted at the level of the distal common bile duct (CBD)/ampulla of Vater (Pointed yellow triangle). It measured approximately 2.3 cm × 2.0 cm × 1.7 cm with a slightly prominent pancreatic duct measuring 6 mm in diameter. Common bile duct was measured 14 mm in diameter; B: Magnetic resonance imaging of the abdomen showing a polypoid mass (pointed yellow triangle) at the level of the CBD.
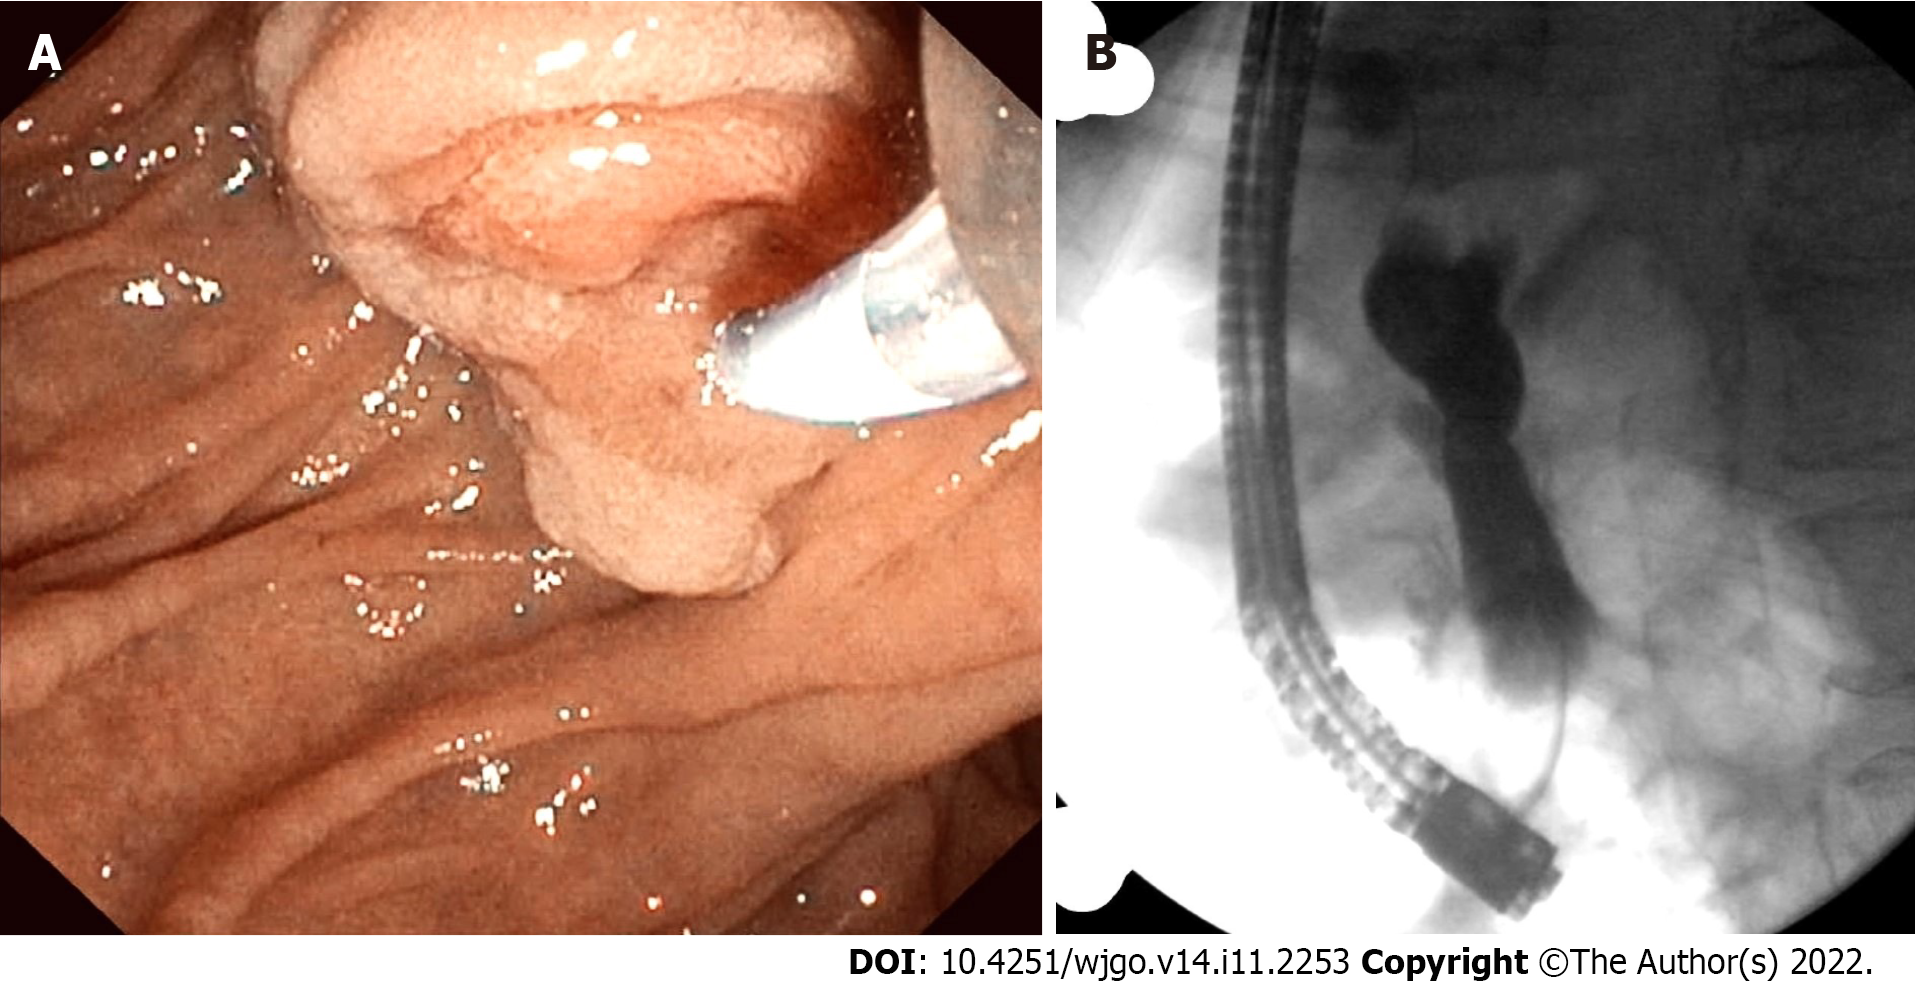
Figure 3 Endoscopic retrograde pancreatography studies.
A: The patient had abnormal papilla with a polypoid mass. Sphincterotomy and deep cannulation procedures were performed and confirmed by fluoroscopy. endoscopic retrograde cholangiopancreatography (ERCP) showed common bile duct (CBD) dilatation, and there was an abrupt cutoff at the distal aspect; B: ERCP fluoroscopy. Fluoroscopy showed CBD dilatation, and there was an abrupt cutoff at the distal aspect.
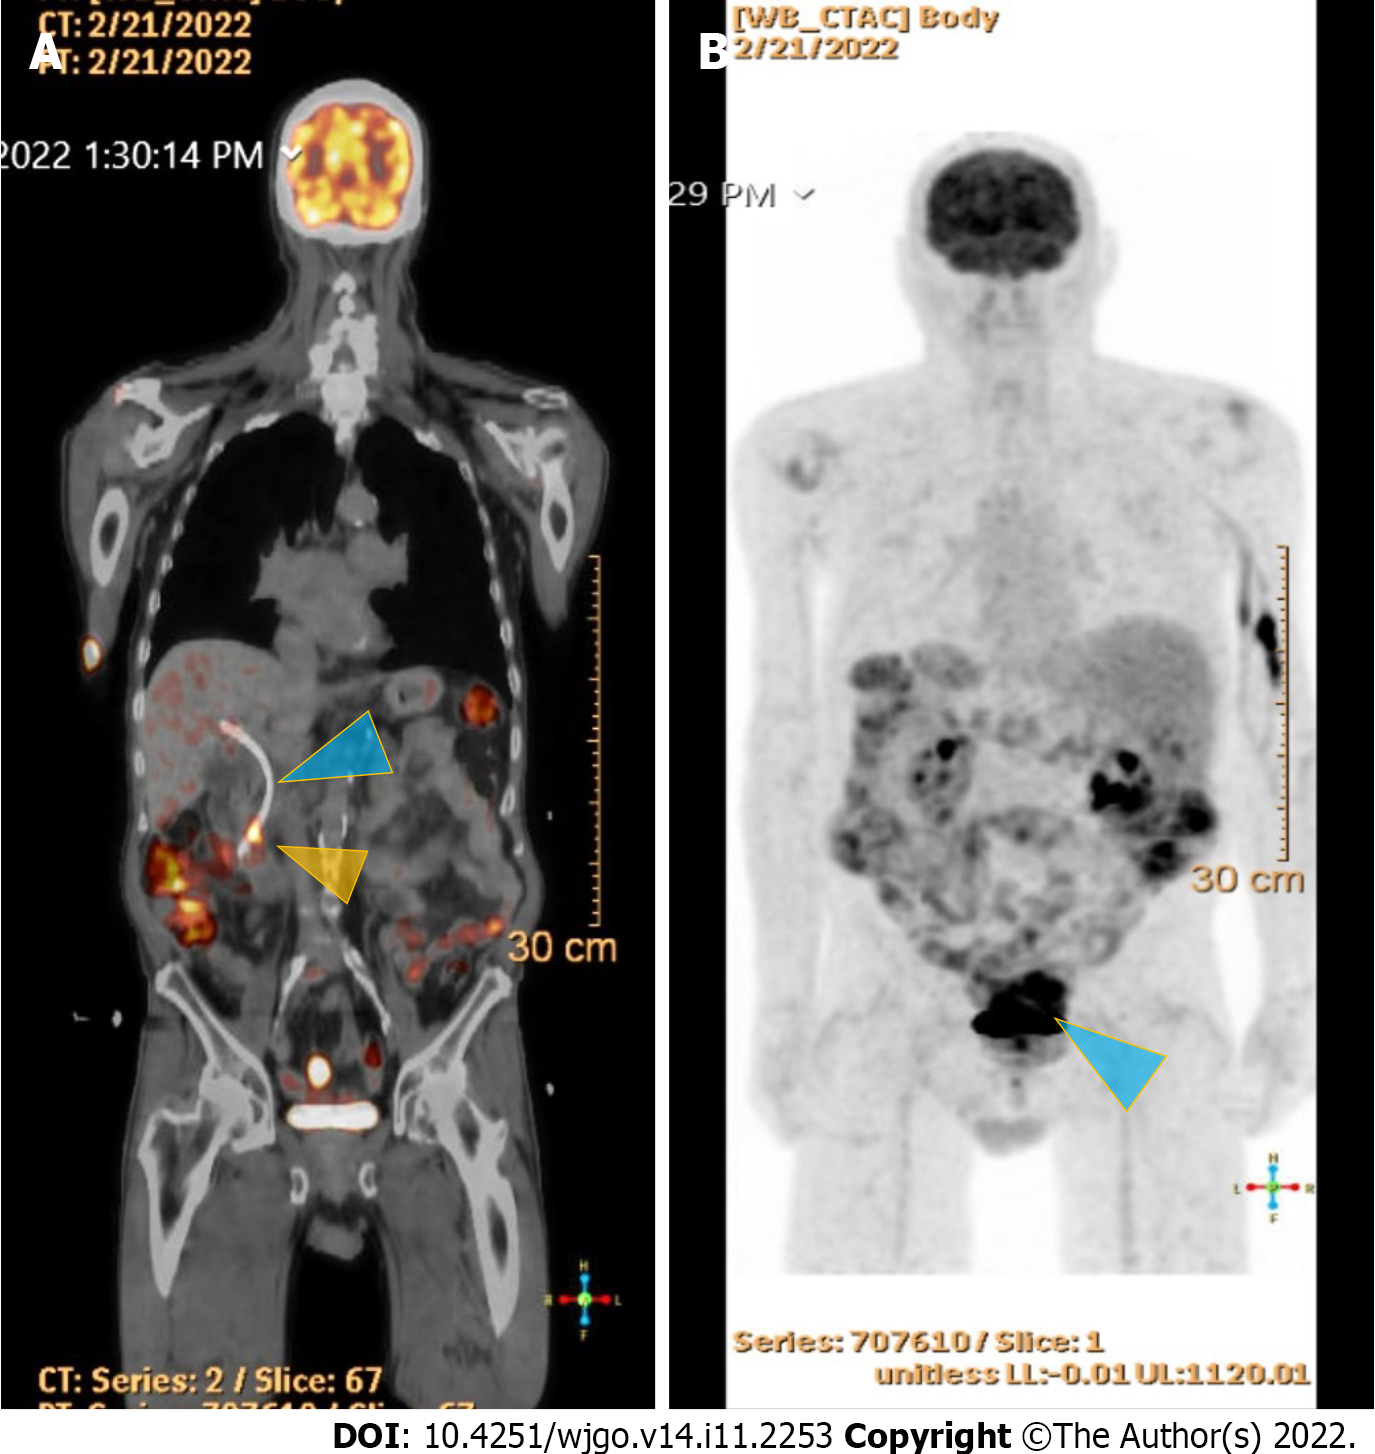
Figure 4 18F-Flurodeoxyglucose positron emission tomography scan studies.
A: Shows an end-obiliary stent in the region of the papilla (blue triangle) and a 1.7 cm ampullary mass with intense fluorodeoxyglucose (FDG) avidity(yellow triangle); B: Shows an oval-shaped, well-defined, FDG-avid lesion measuring approximately 6 cm × 3 cm with a small, punctate area of calcification was present in the lesion located deep in the pelvis along the posterior margin of small bowel loops (blue triangle) with intense FDG avidity.
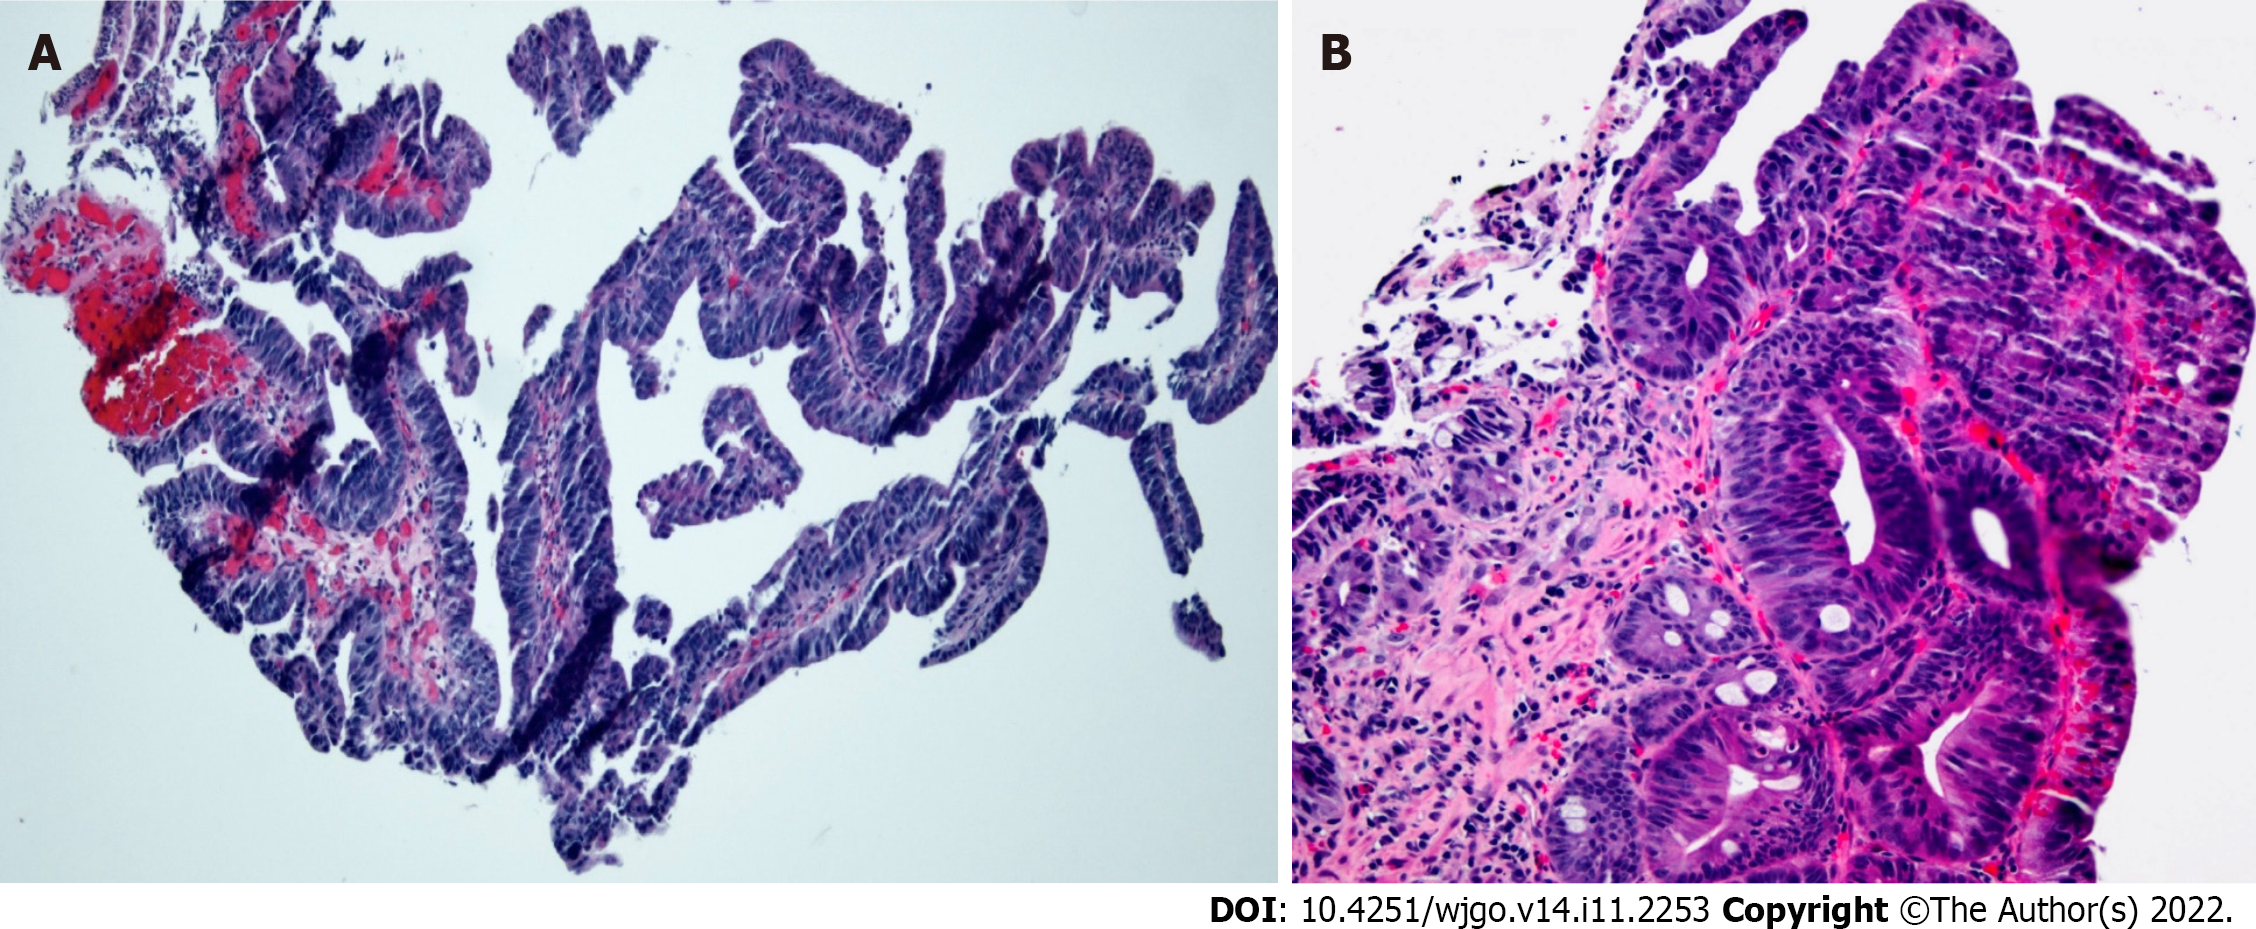
Figure 5 Histopathology of endoscopic biopsy.
A: Medium-power photomicrograph demonstrating dysplastic glandular epithelium with a tubulovillous architecture (hematoxylin and eosin stain, 100 × original magnification); B: High-power photomicrograph showing high-grade glandular dysplasia (hematoxylin and eosin stain, 200 × original magnification).
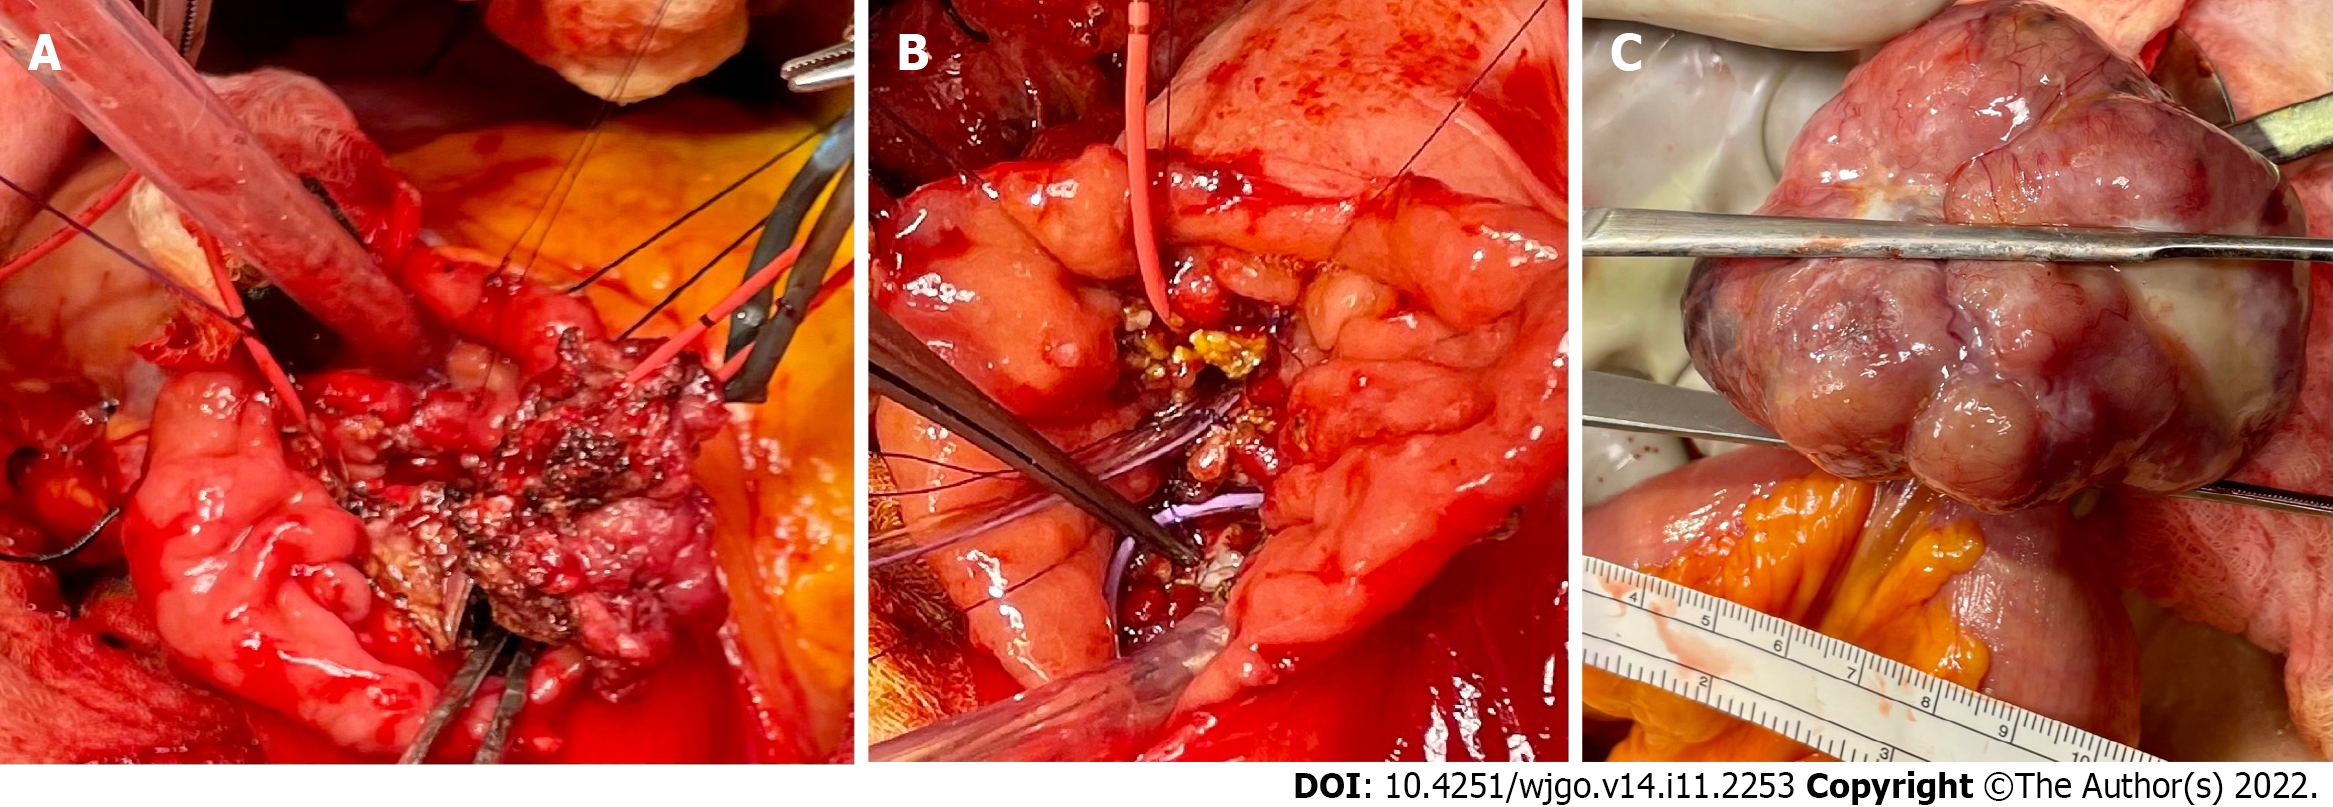
Figure 6 Intraoperative images.
A: A broad base ampullary mass with red Fogarty catheter was advanced from the cystic duct down through the ampulla to the duodenum; B: The ampullary mass was excised, and two internal stents were placed in the bile duct and pancreatic duct in addition to the red Fogarty catheter in the bile duct; C: Pedunculated gastrointestinal stromal tumor arising from the small bowel approximately 150 cm proximal to the ileocecal valve.
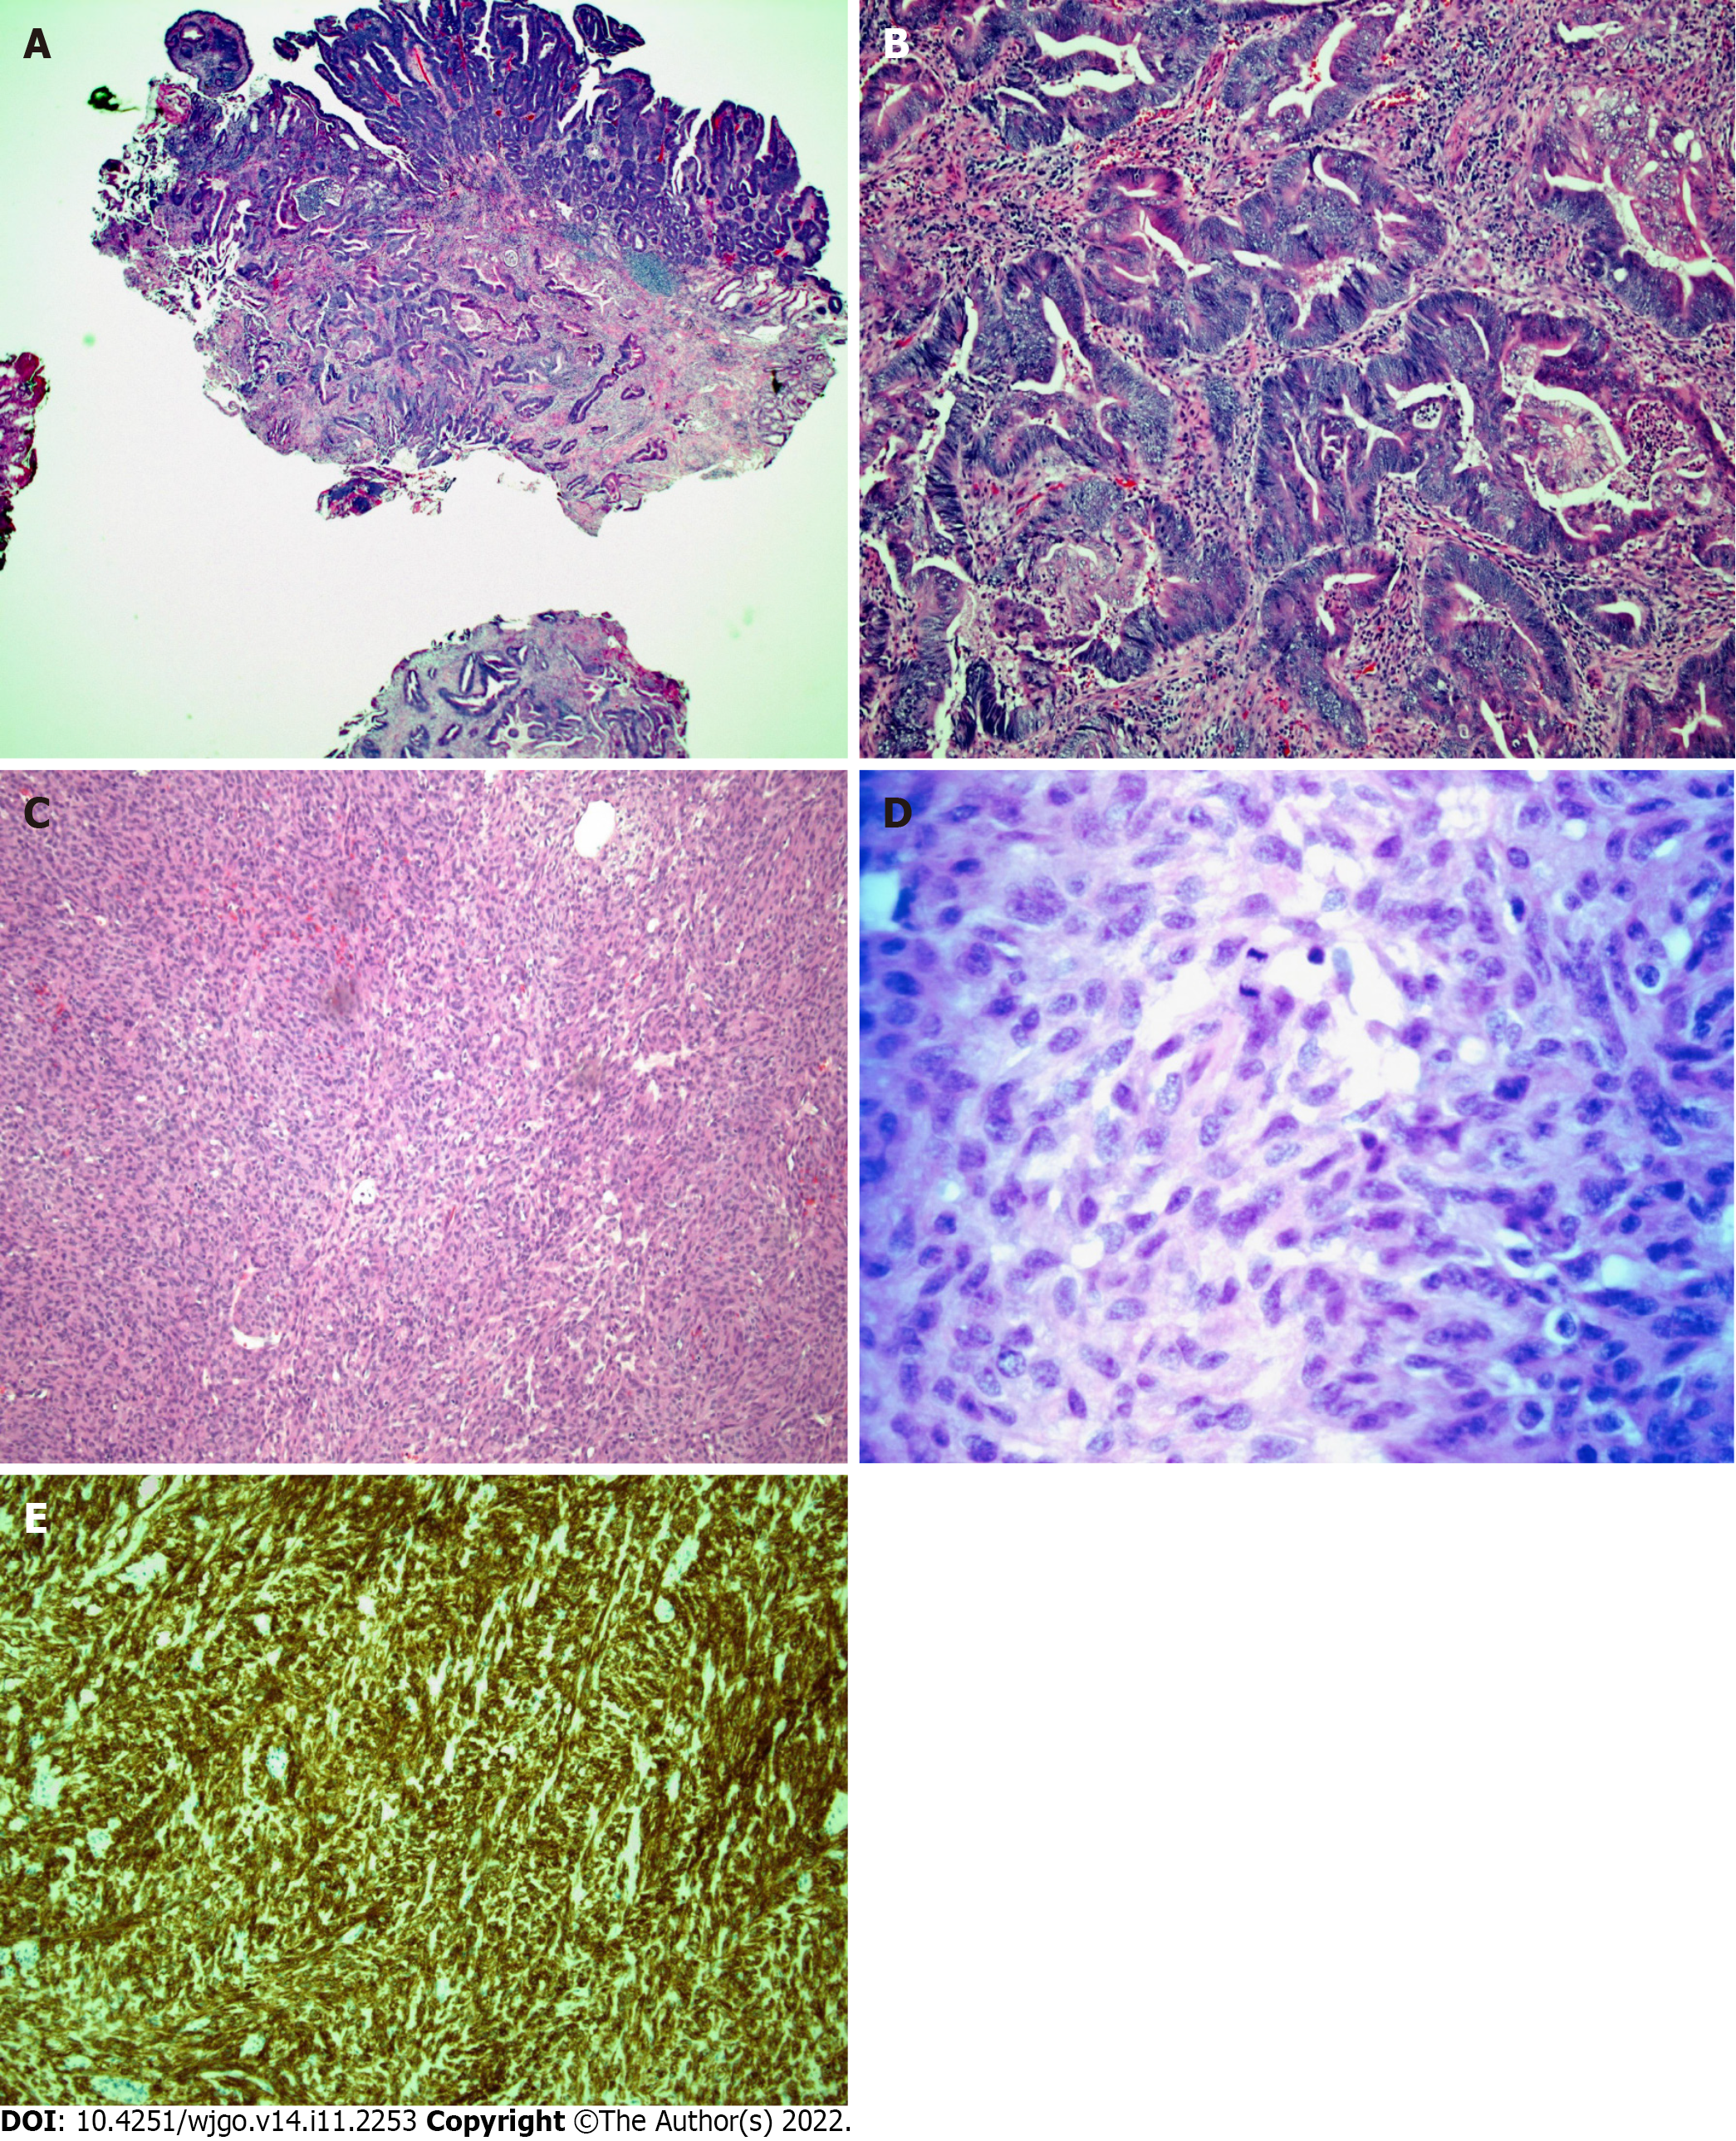
Figure 7 Histopathology of the surgically resected ampullary mass and ileal mass.
A: Low-power micrograph of invasive adenocarcinoma arising from a tubulovillous adenoma with high-grade dysplasia in the ampullary region (hematoxylin and eosin stain, original magnification 20 ×); B: High-power micrograph of ampullary mass showing malignant glands (hematoxylin and eosin stain, original magnification 100 ×); C: Low-power photomicrograph of ileal mass showing the spindle cell morphology of a gastrointestinal stromal tumor (GIST) (hematoxylin and eosin stain, 100 × original magnification); D: A high-power view of cellular mitosis within the ileal GIST (hematoxylin and eosin stain, 600 × original magnification) showed 15 mitoses per 5 square millimeters; E: Immunohistochemical staining for CD117 showing strong and diffuse cytoplasmic immunoreactivity confirming GIST (hematoxylin and eosin stain, 100 × original magnification).
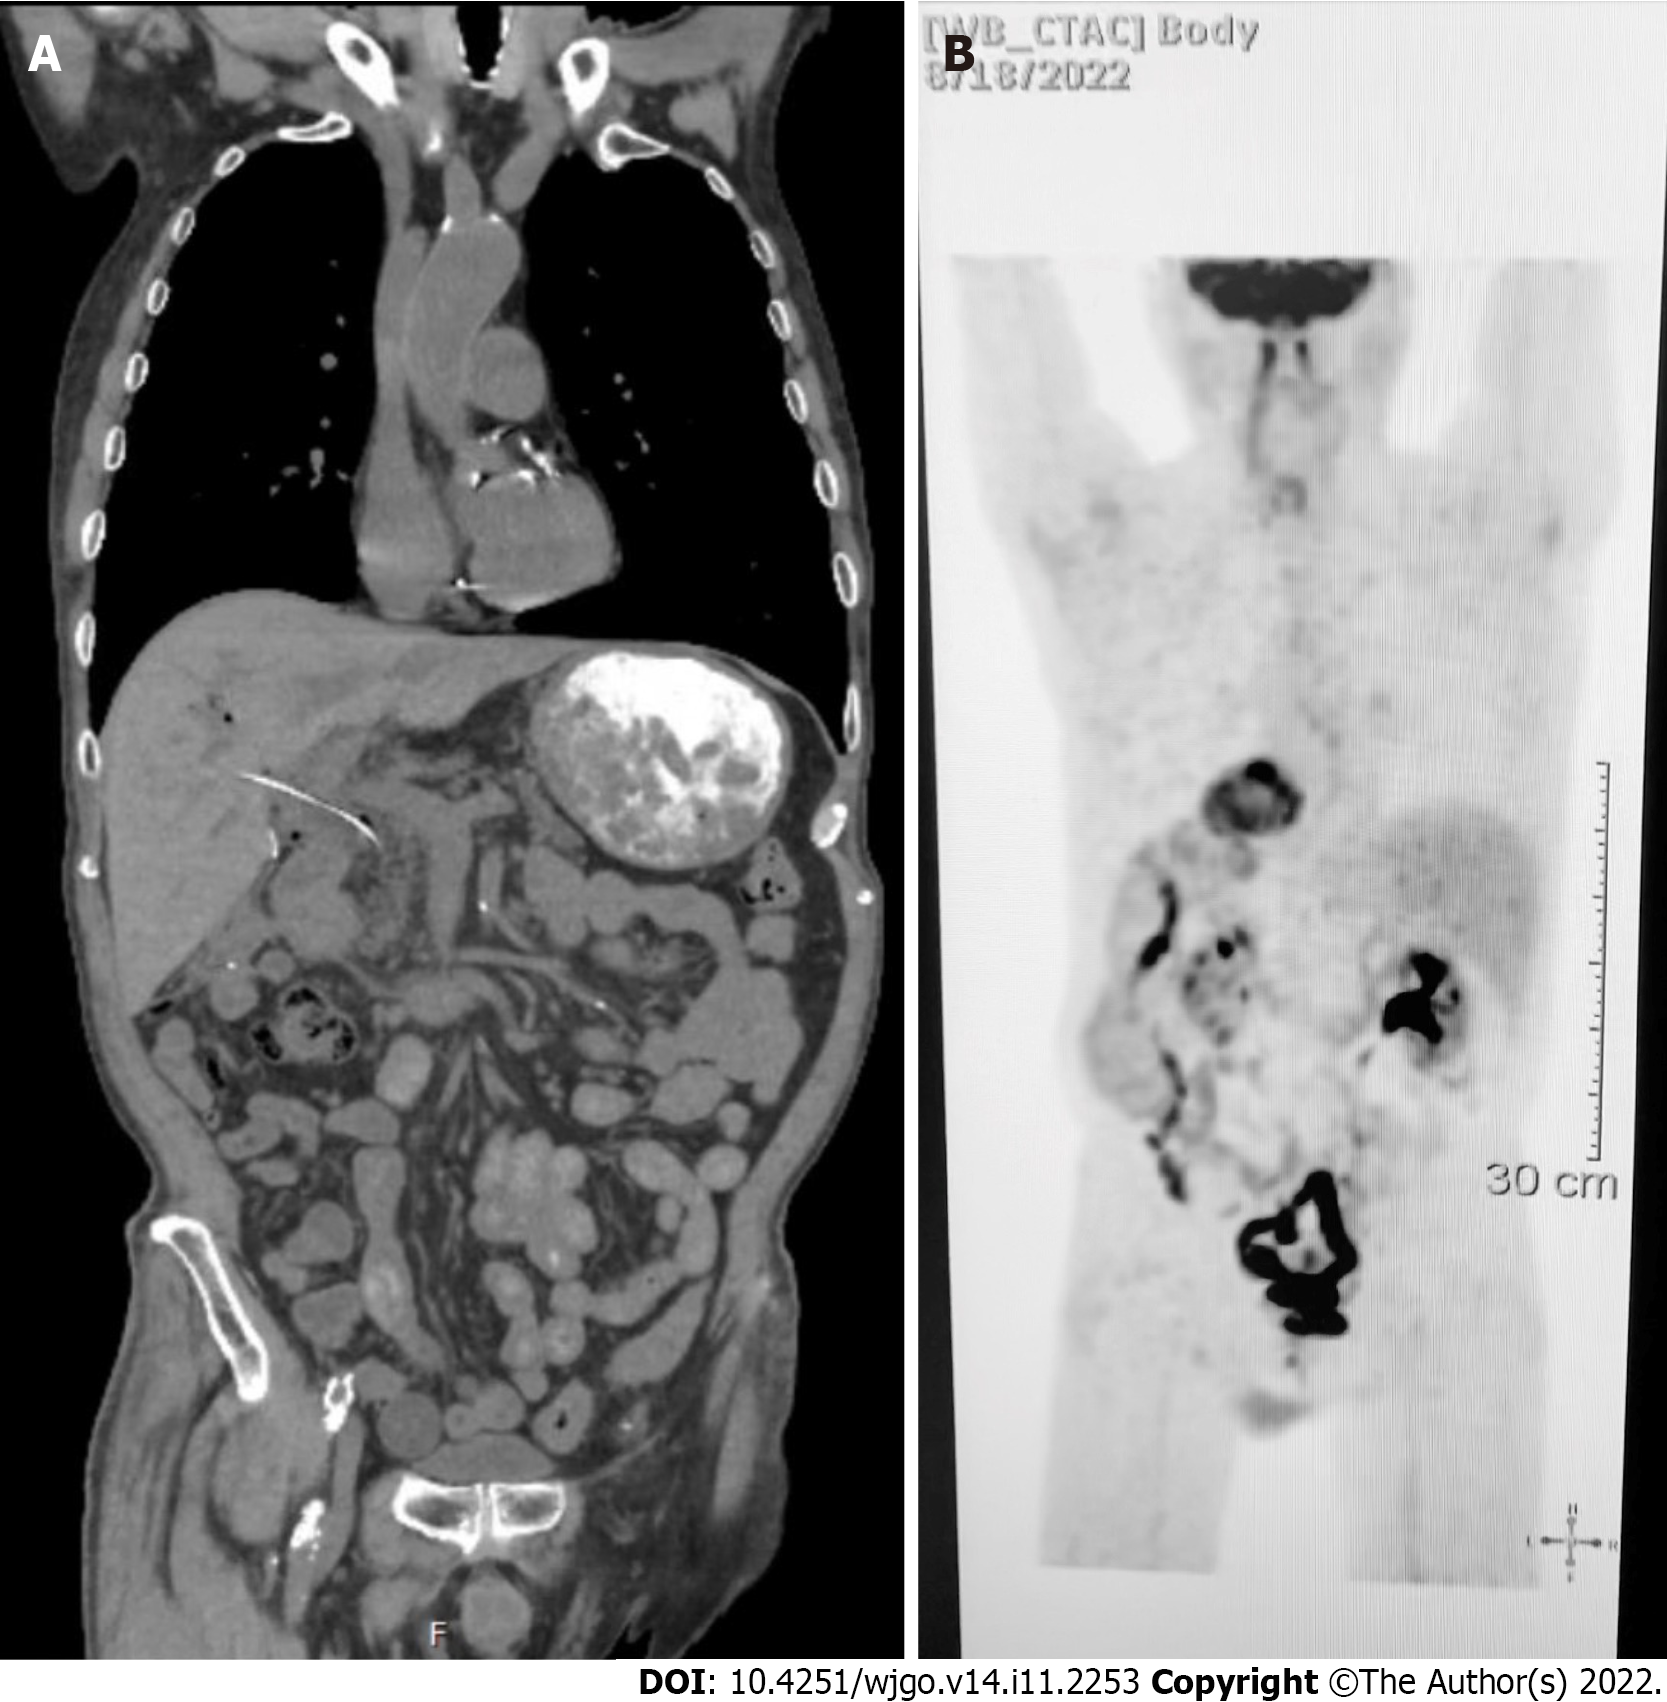
Figure 8 Follow up computed tomography and positron emission tomography scan studies.
A: Surveillance computed tomography of the chest, abdomen and pelvis w/contrast on three months after surgery showed no findings for metastatic disease; B: Follow-up positron emission tomography scan showing a complete metabolic response.
- Citation: Matli VVK, Zibari GB, Wellman G, Ramadas P, Pandit S, Morris J. A rare synchrony of adenocarcinoma of the ampulla with an ileal gastrointestinal stromal tumor: A case report. World J Gastrointest Oncol 2022; 14(11): 2253-2265
- URL: https://www.wjgnet.com/1948-5204/full/v14/i11/2253.htm
- DOI: https://dx.doi.org/10.4251/wjgo.v14.i11.2253


