Copyright
©The Author(s) 2020.
World J Gastrointest Oncol. Jul 15, 2020; 12(7): 768-781
Published online Jul 15, 2020. doi: 10.4251/wjgo.v12.i7.768
Published online Jul 15, 2020. doi: 10.4251/wjgo.v12.i7.768
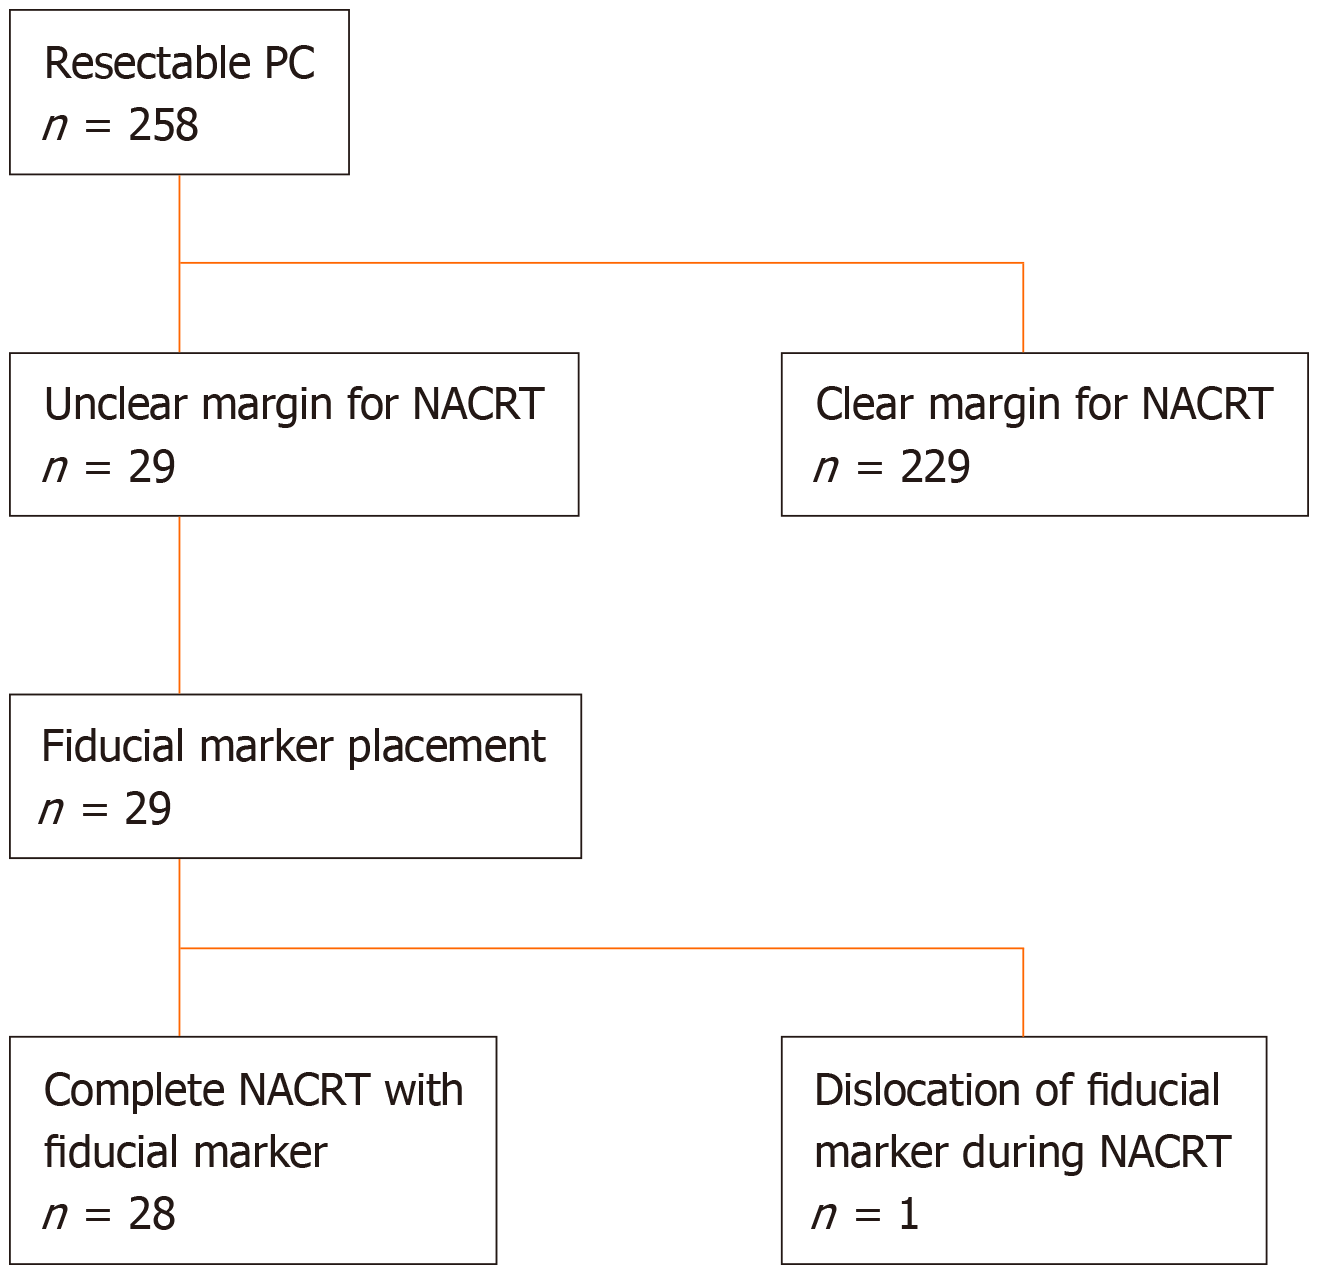
Figure 1 Flow chart for 29 patients with fiducial marker placement.
NACRT: Neoadjuvant chemoradiation therapy; PC: Pancreatic cancer.
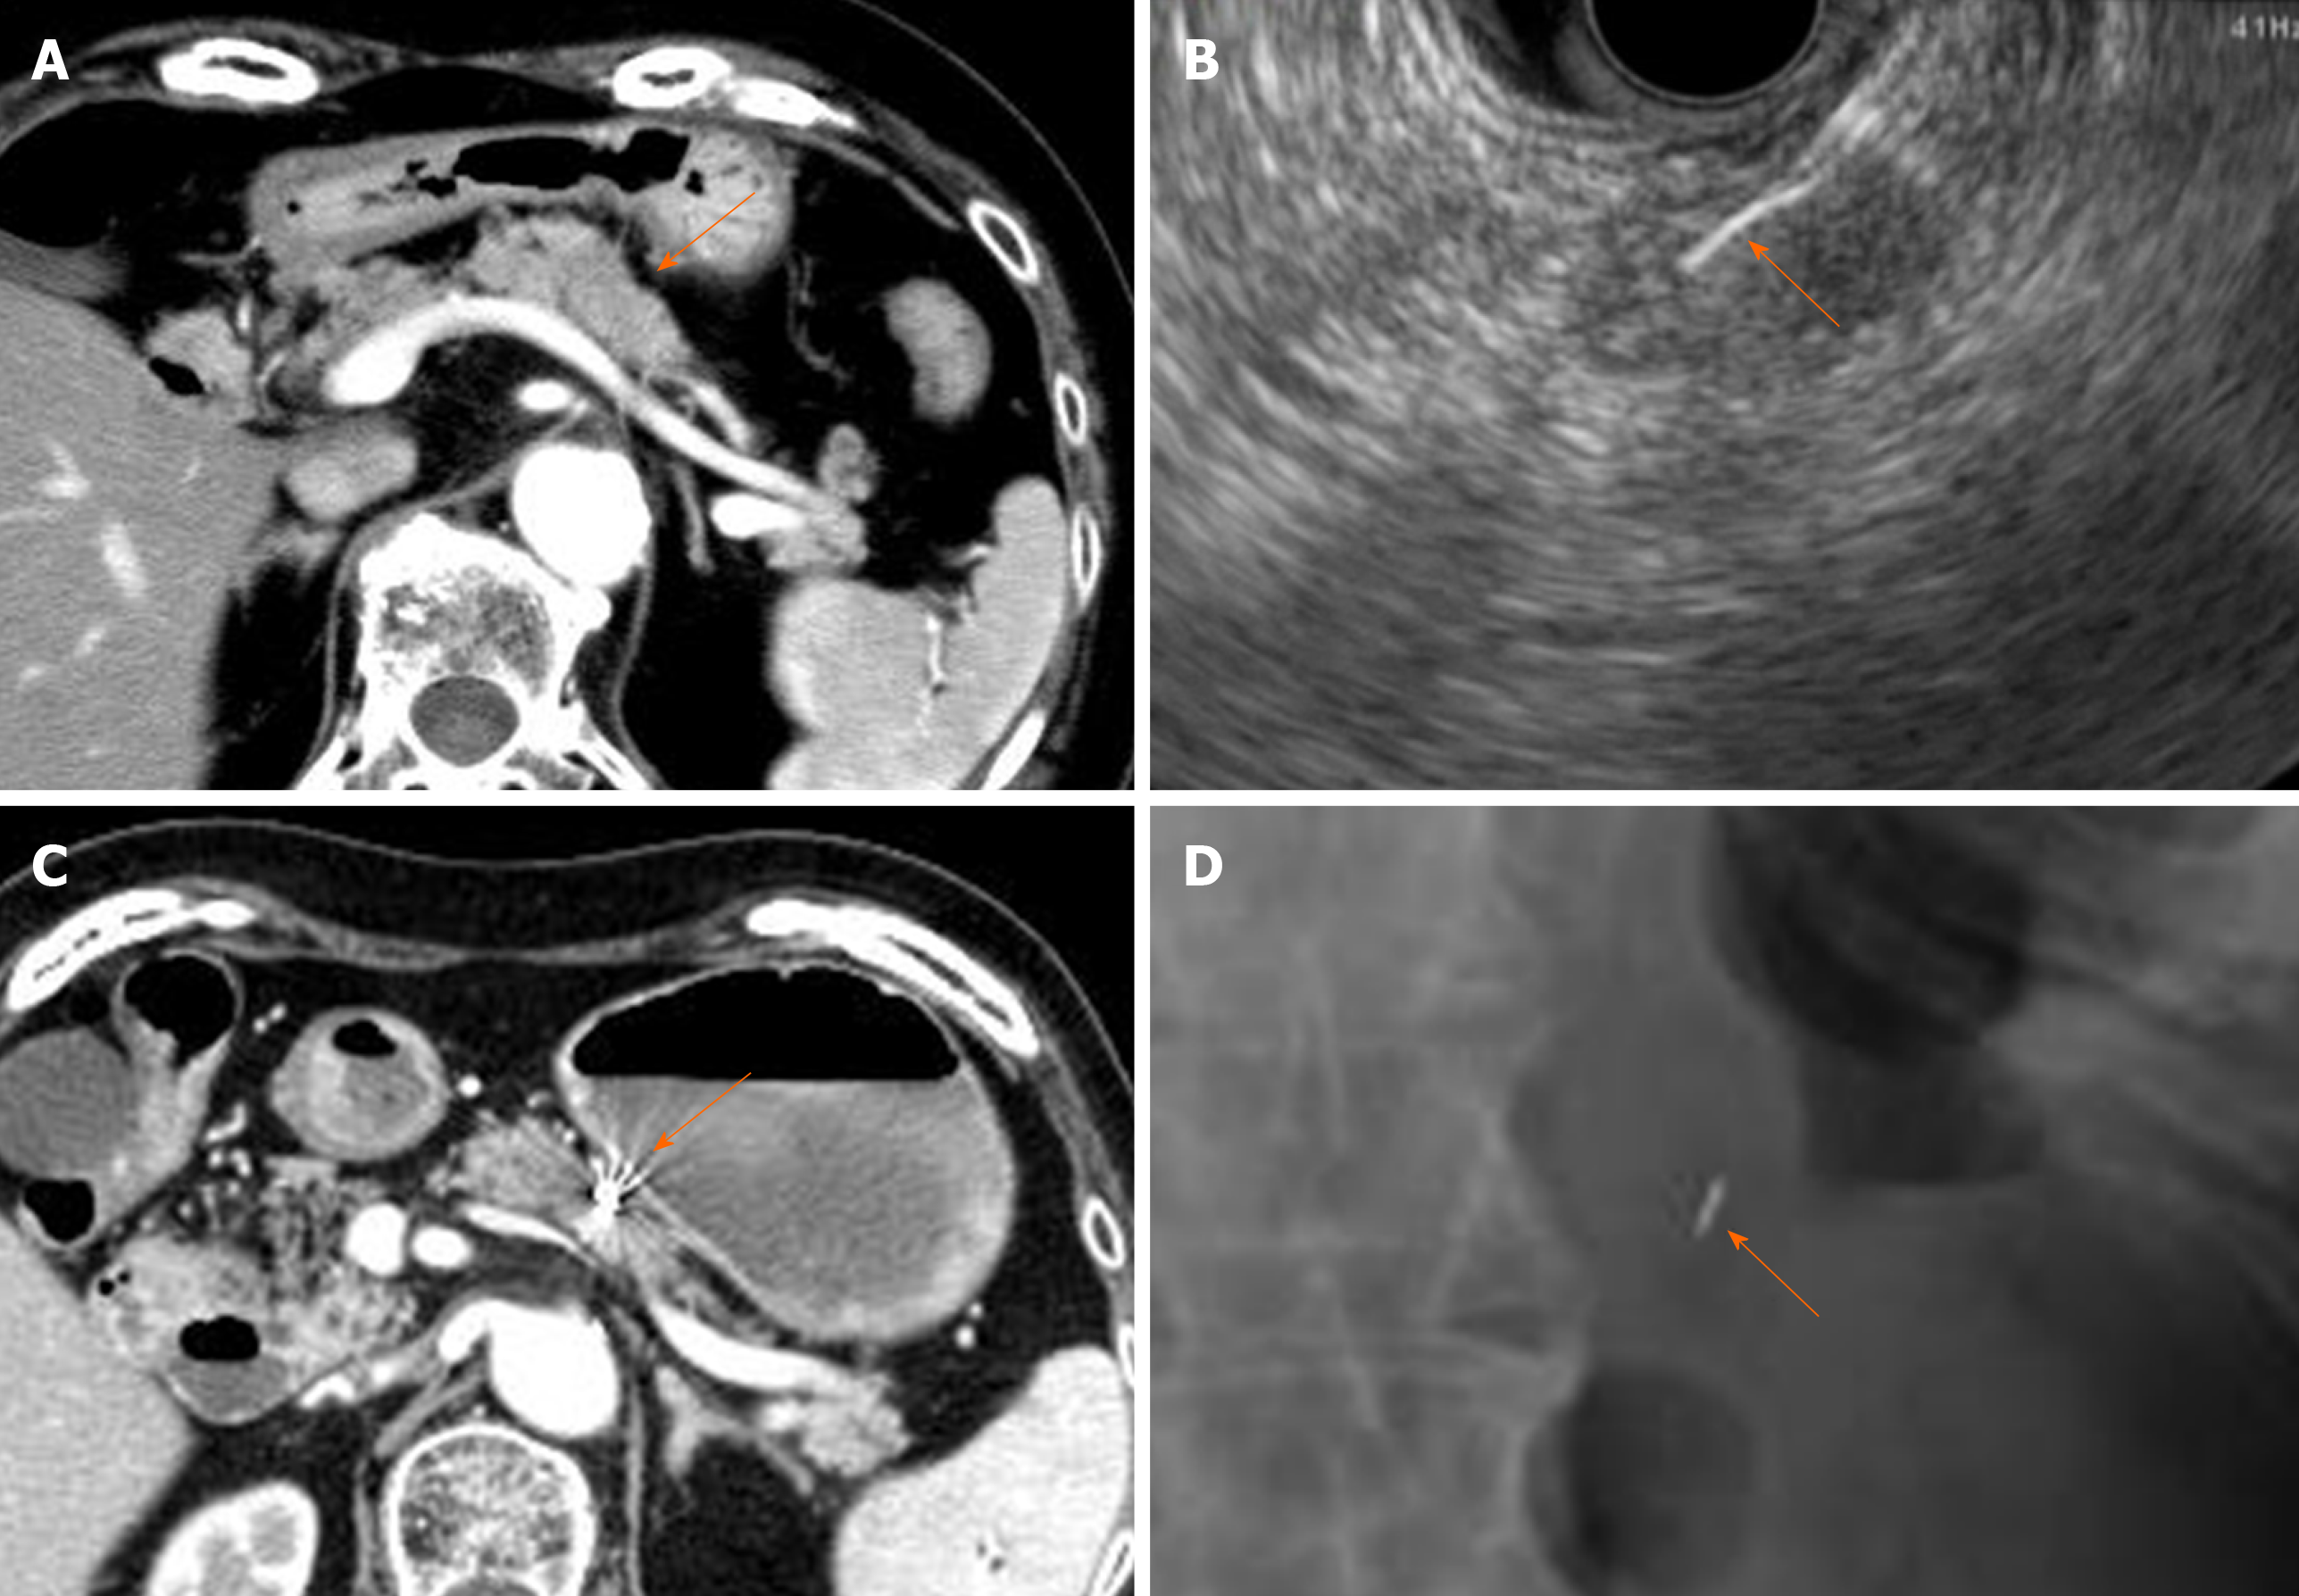
Figure 2 Endoscopic ultrasound-guided fiducial marker placement.
A: Abdominal computed tomography. The orange arrow indicates the mass in the pancreatic body; B: Needle inserting the fiducial marker into the pancreatic mass. The orange arrow indicates fiducial marker placed into the pancreatic mass; C: Abdominal computed tomography after marker placement. The orange arrow indicates the fiducial marker placed into the pancreatic mass; D: Abdominal radiograph showing the fiducial marker. The orange arrow indicates the fiducial marker.
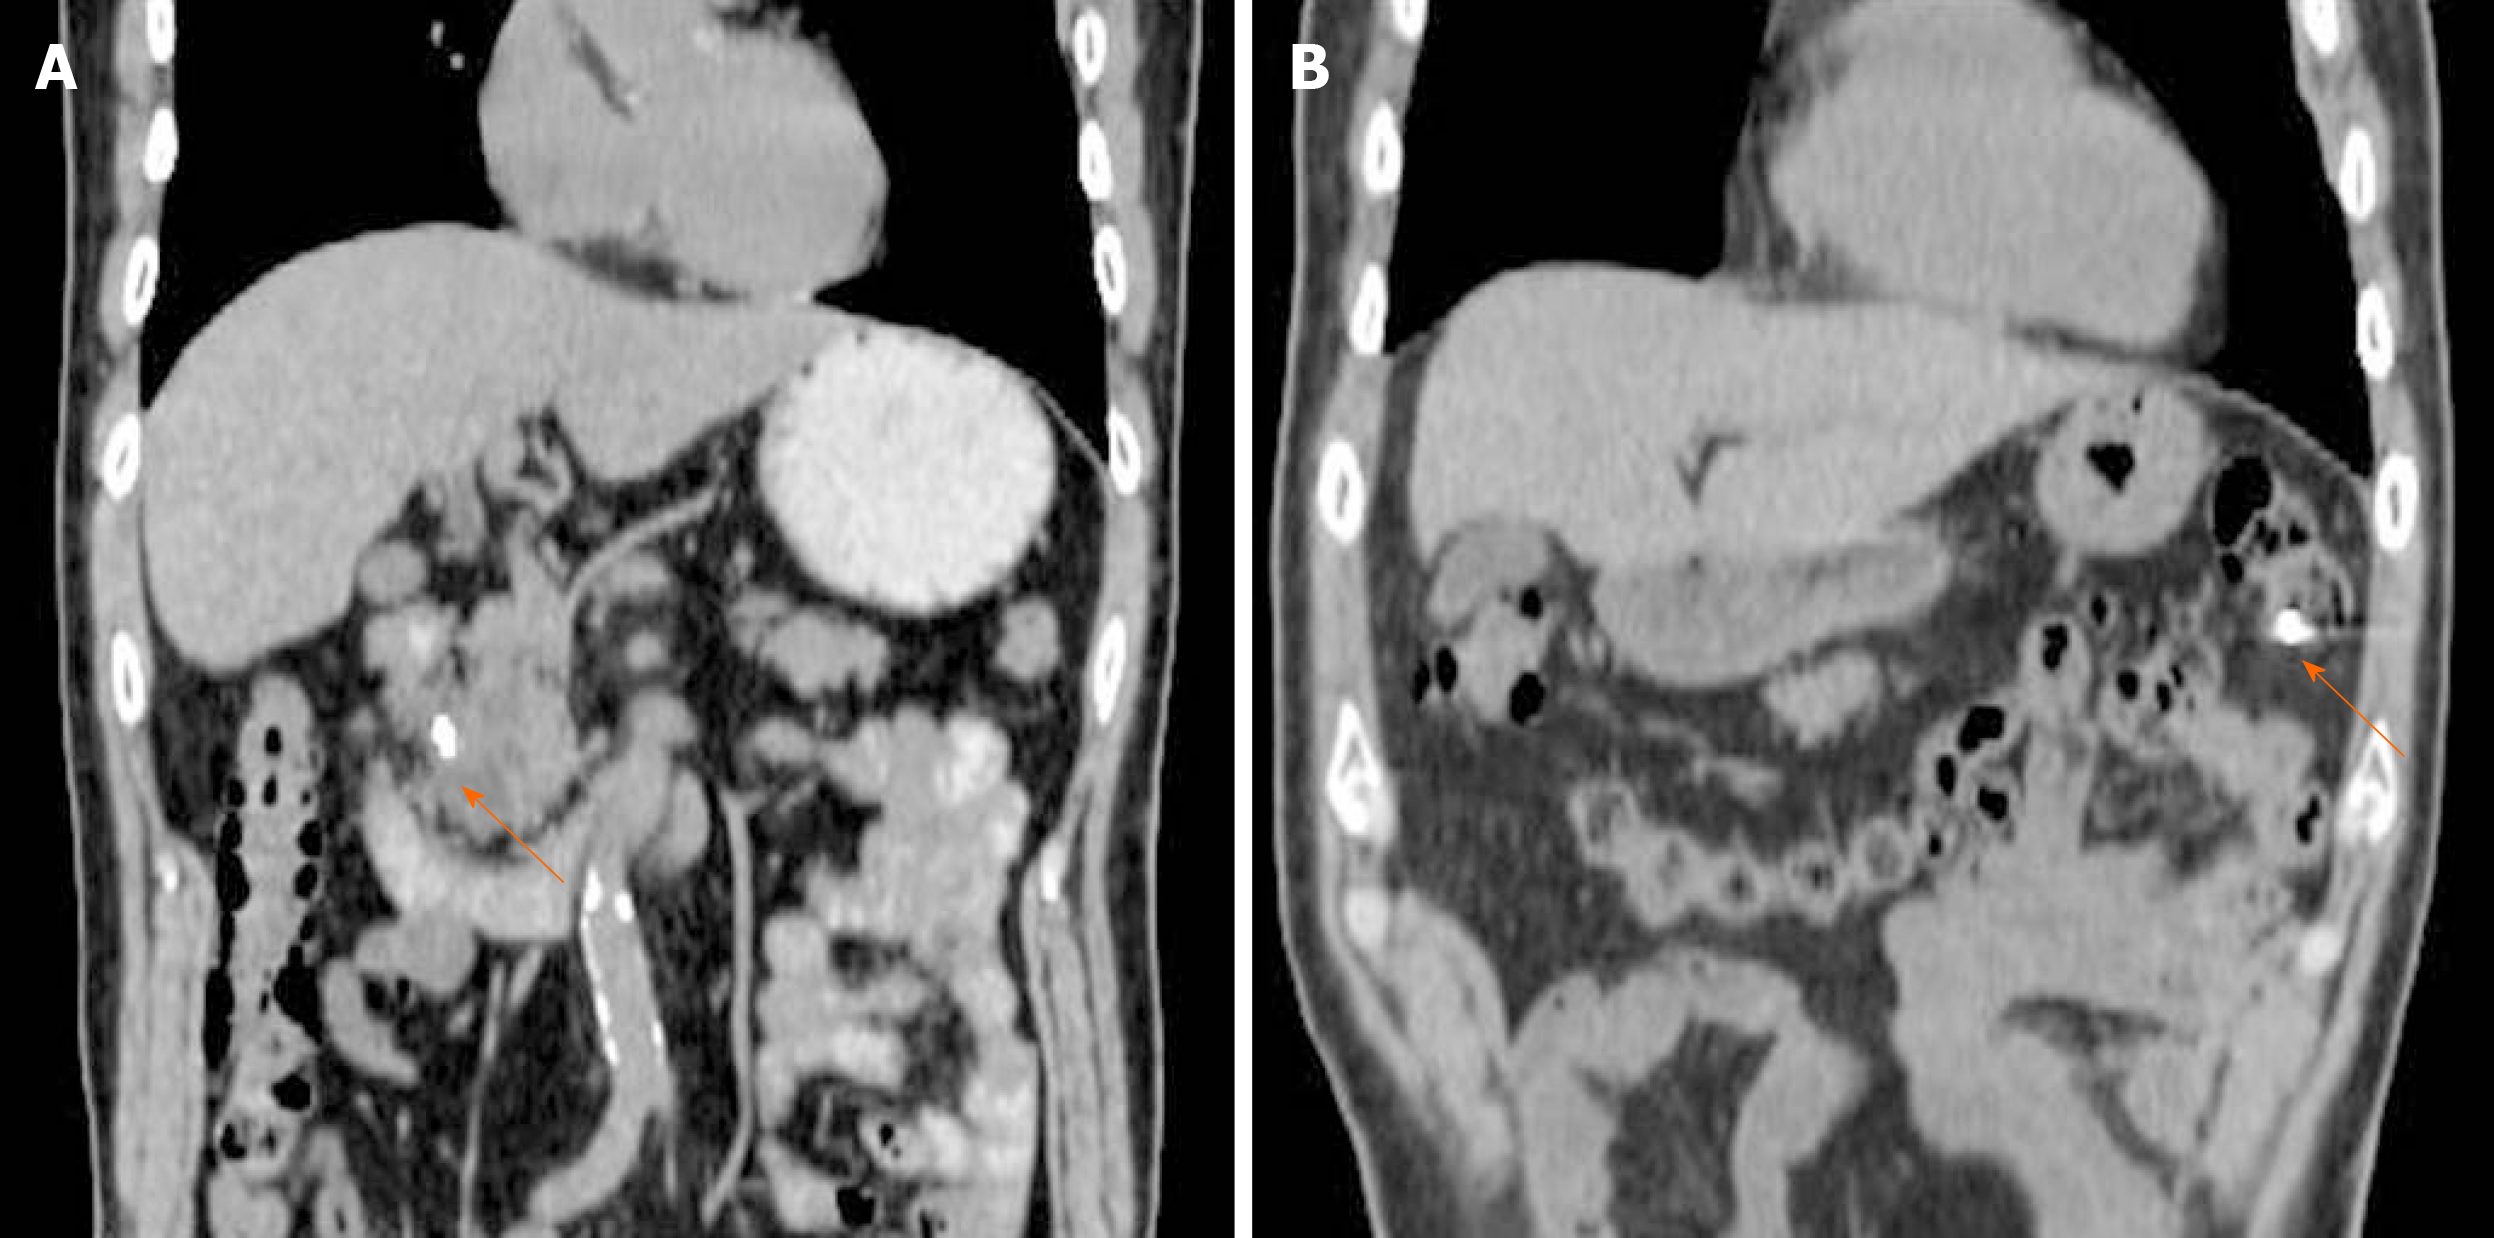
Figure 3 Fiducial marker migration.
A: Fiducial marker location immediately after marker placement. The orange arrow indicates fiducial marker in the pancreas head; B: Fiducial marker location 11 d after marker placement. The orange arrow indicates migrated fiducial marker into colon.
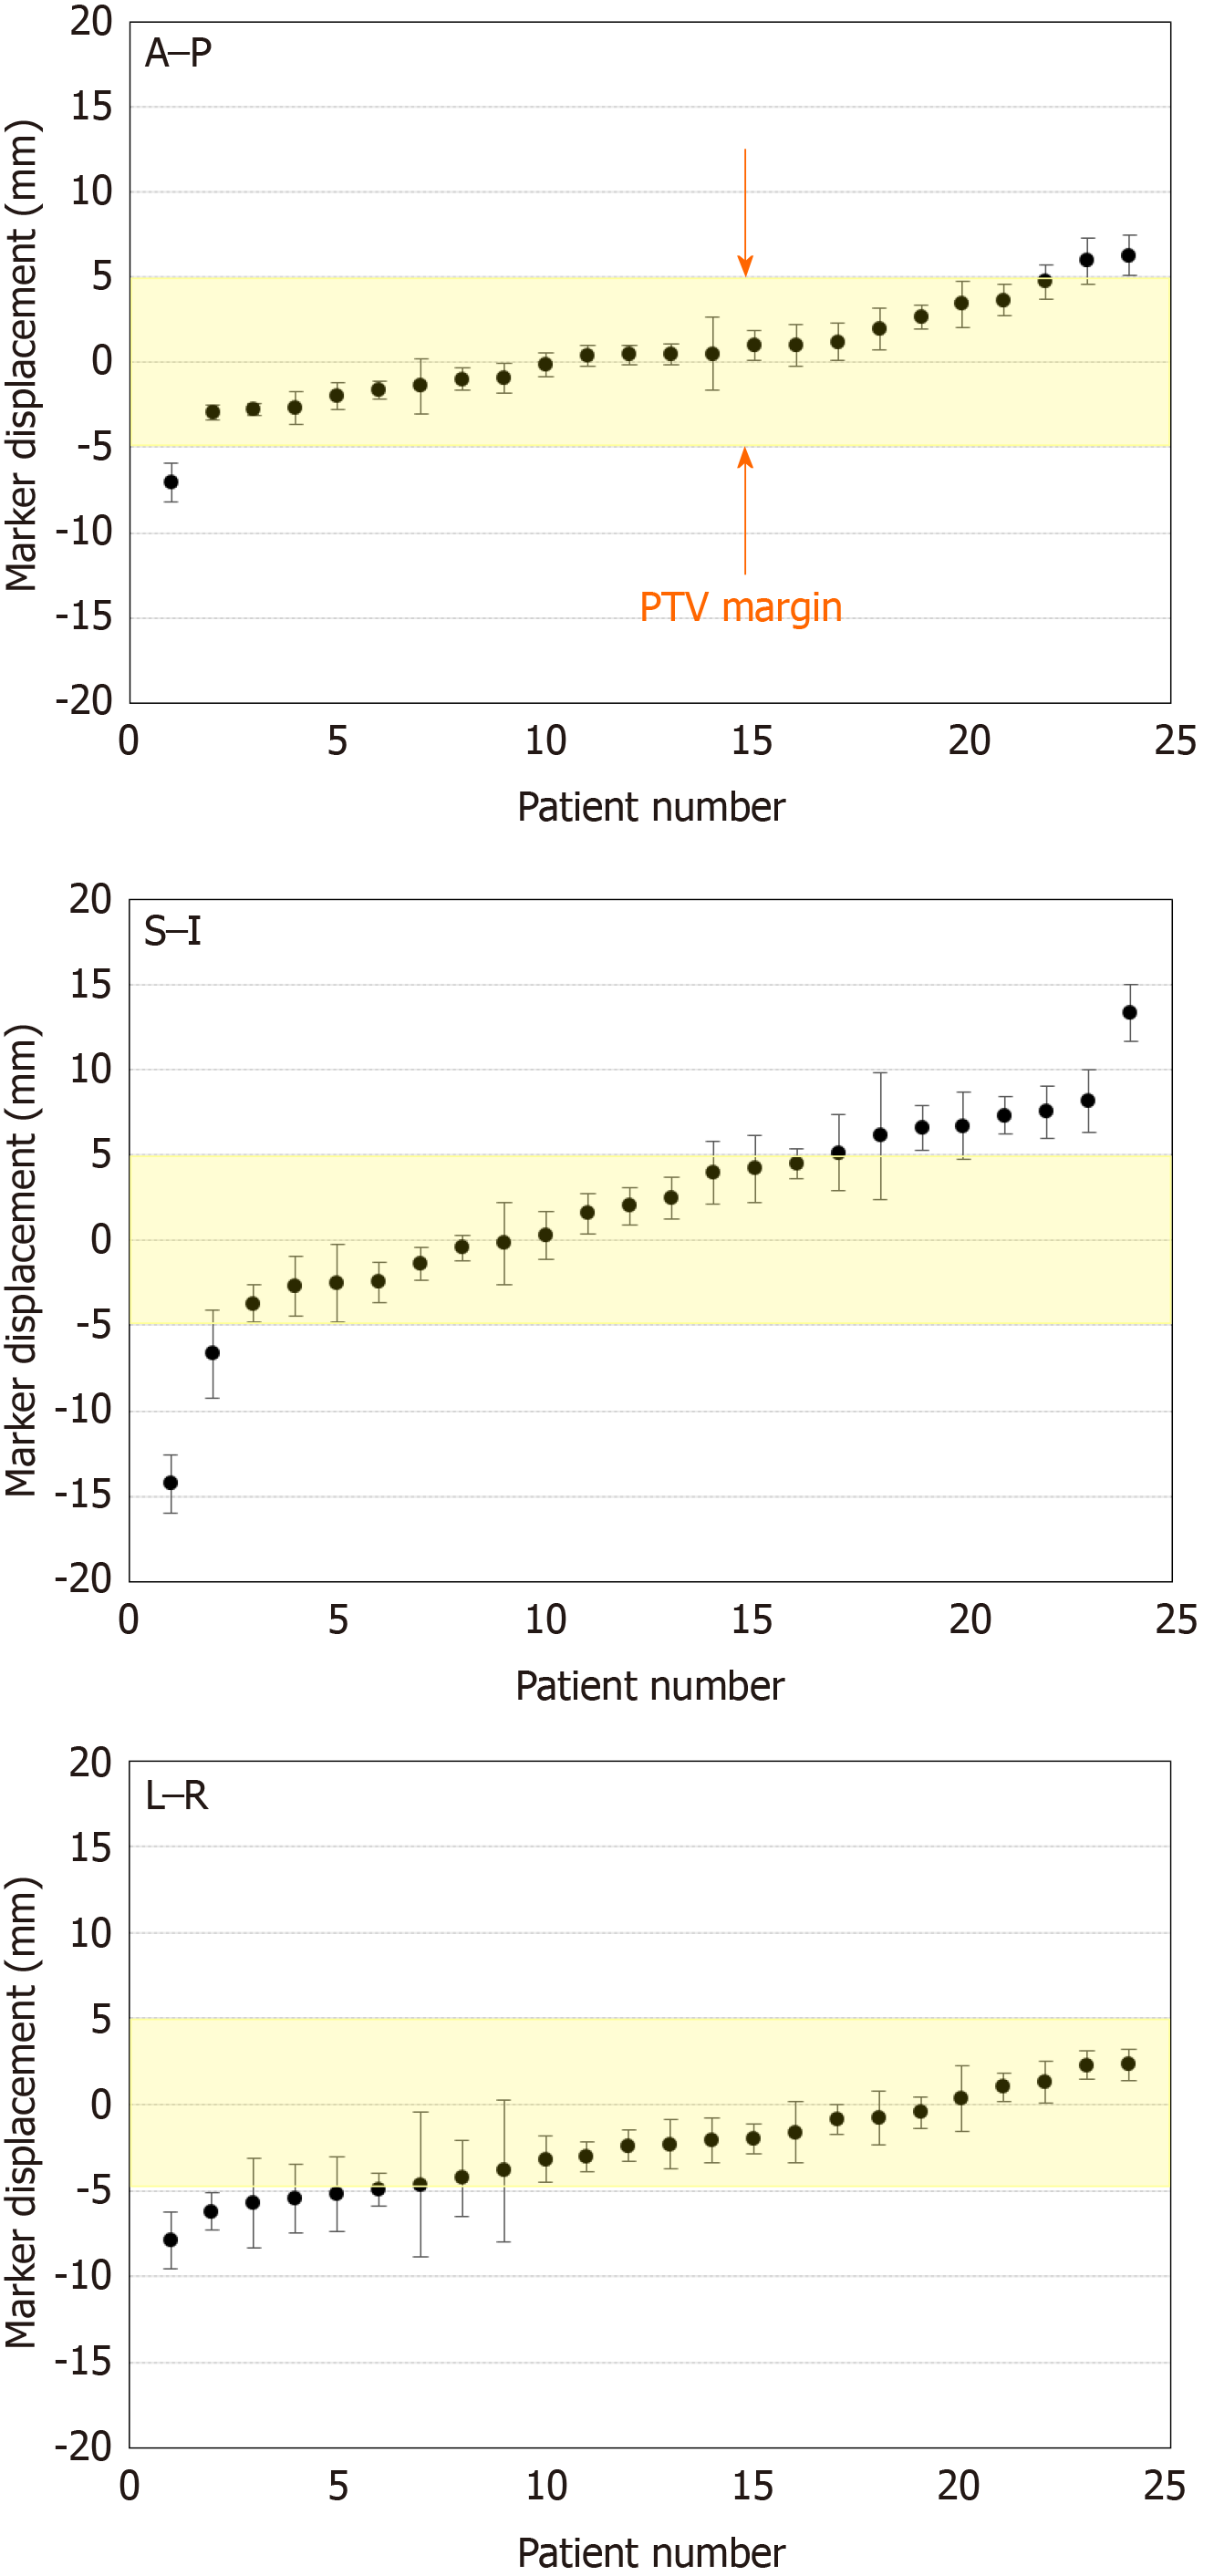
Figure 4 Positional differences in resectable pancreatic cancer between simulation and during treatment in three directions.
Error bars indicates the 95% confidence intervals. Positive values of marker displacement indicate that the position of the marker during treatment moves to the anterior, inferior, or left directions from the simulation. Positional differences in resectable pancreatic cancer between simulation and treatment were marked, particularly in the superior-inferior direction. Yellow area between orange arrows indicate planning target volume margin. A–P: Antero-posterior; S–I: Superior-inferior; L–R: Left–right; PTV: Planning target volume.
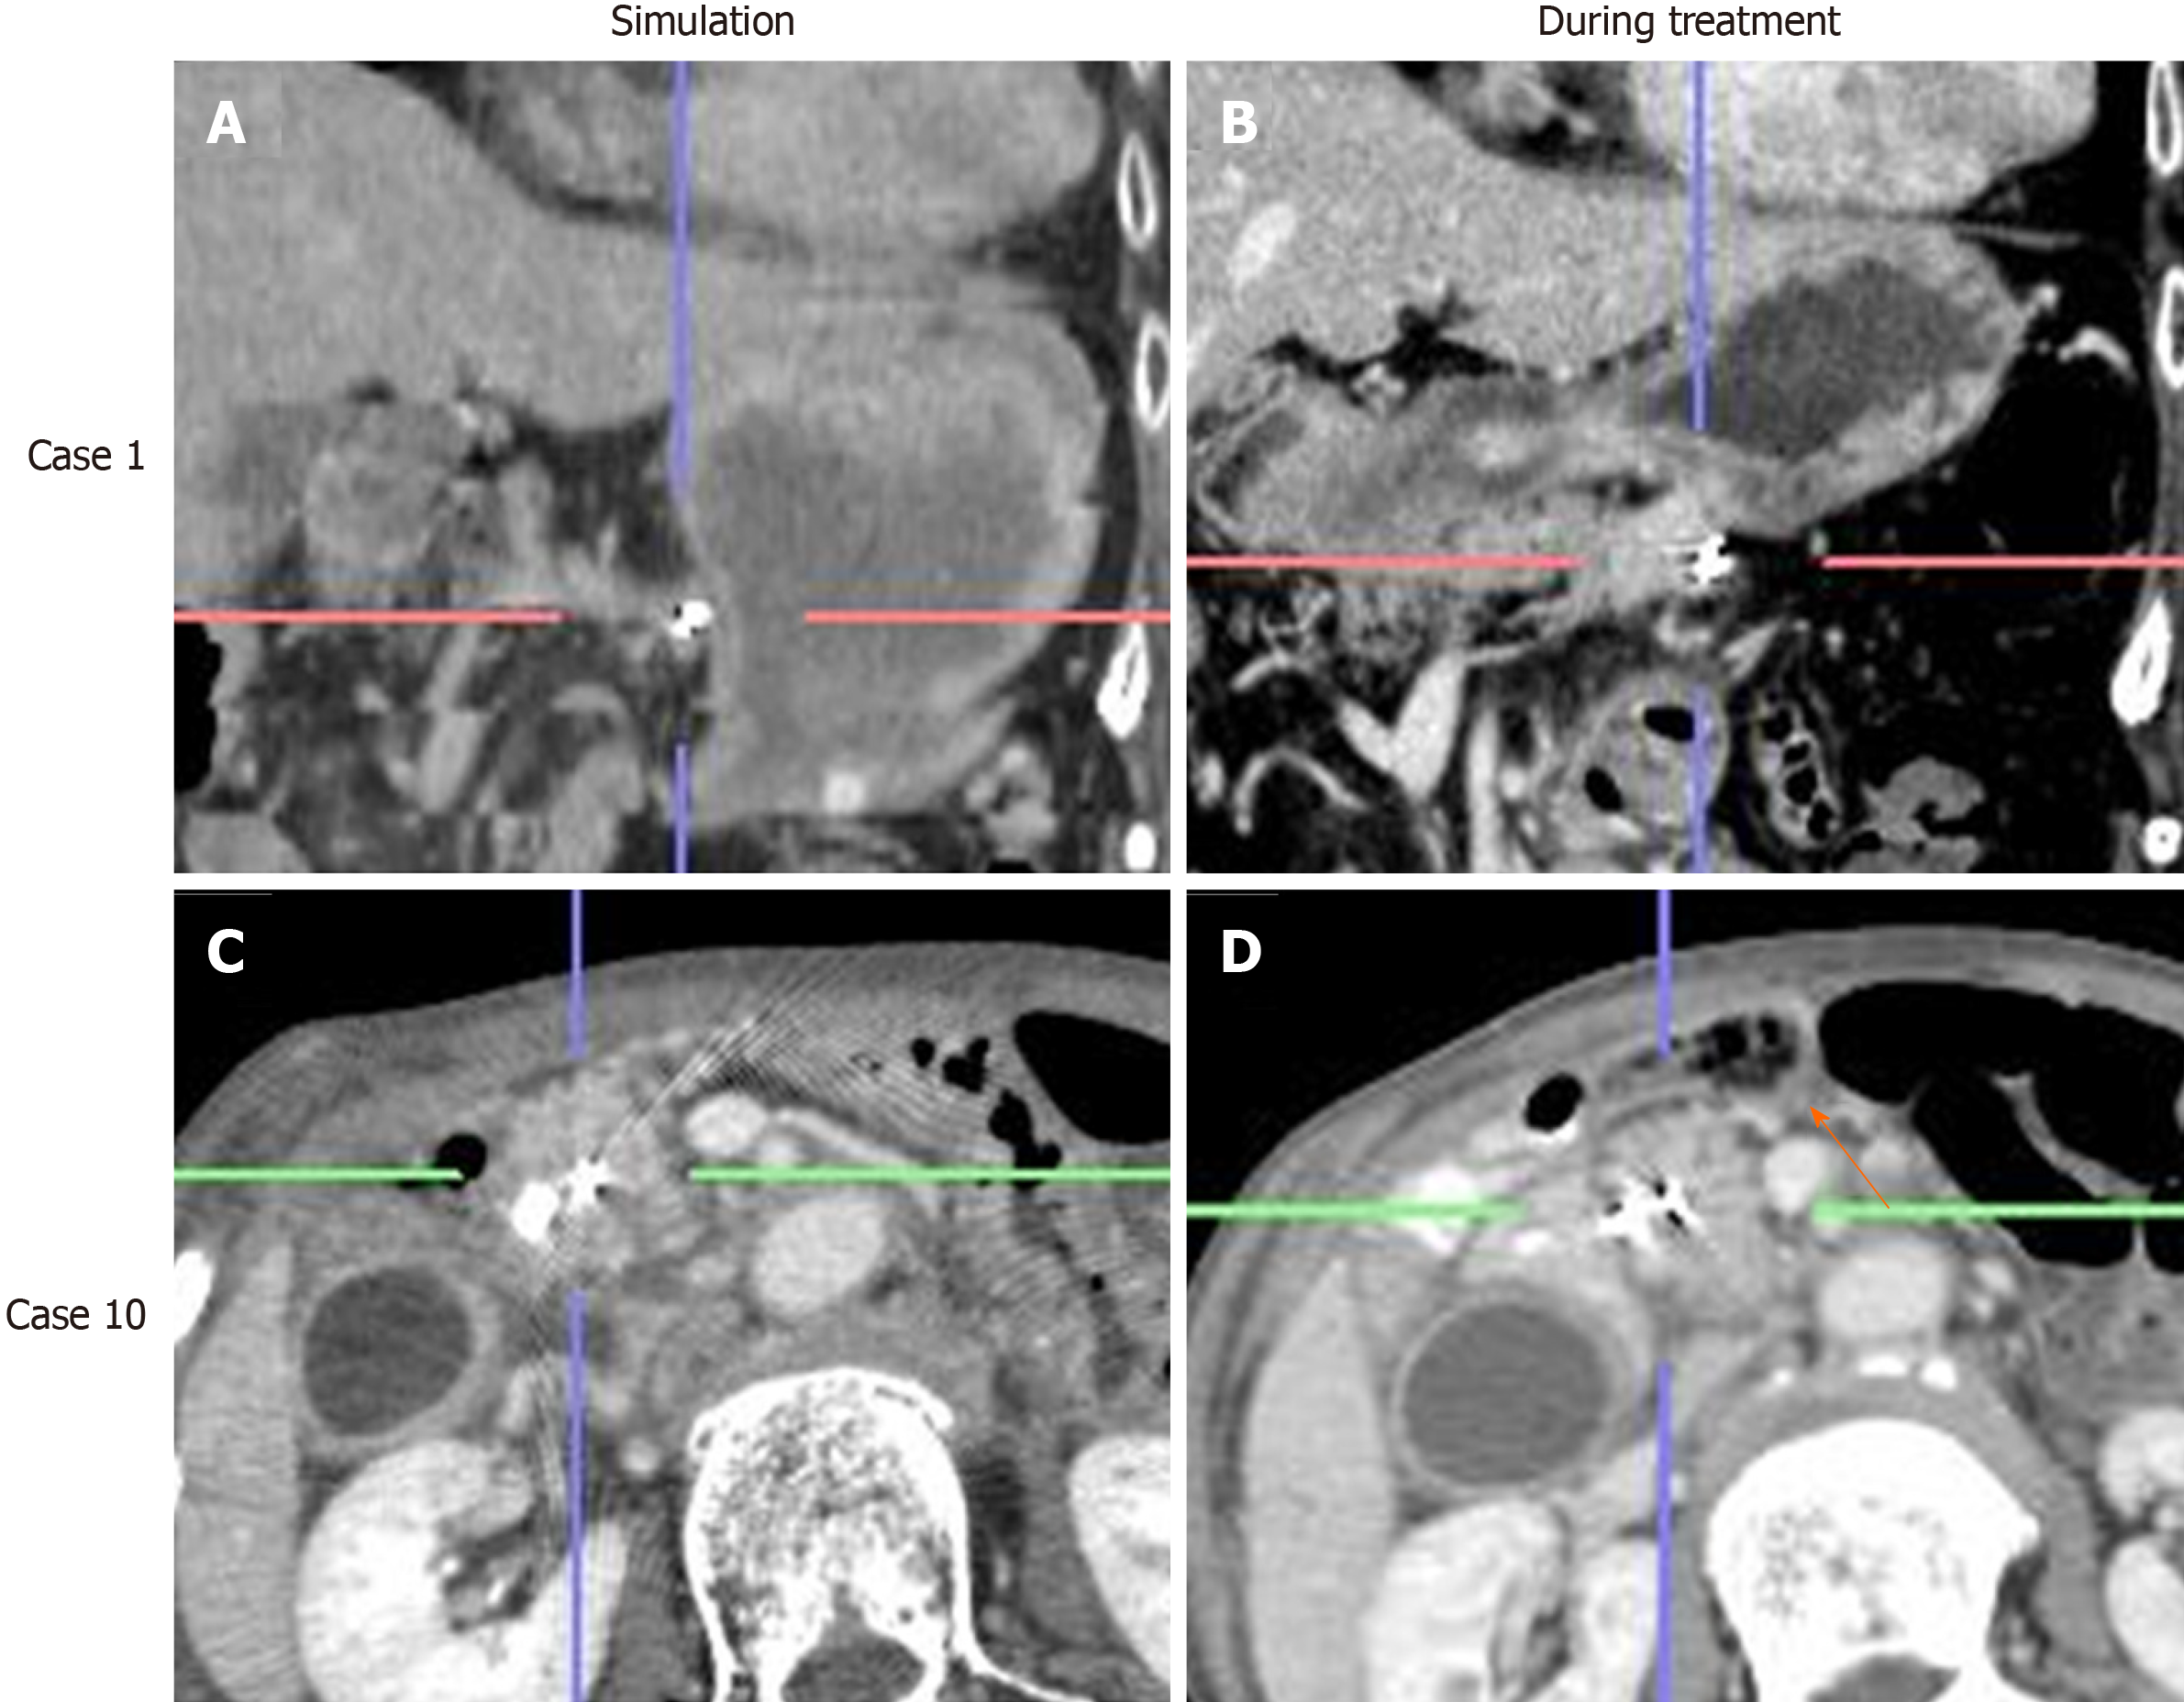
Figure 5 Differences in tumor location during radiation treatment due to food in the stomach.
A: Simulation computed tomography (CT); B: Cone-beam CT during treatment; C: Simulation CT; D: Cone-beam CT during treatment. The orange arrow indicates bowel gas in front of the pancreas. Case 1 suggests that cancer location was affected by the stomach shape due to either food or fluid intake. Case 10 suggests the lesion in the pancreatic head was affected by bowel gas.
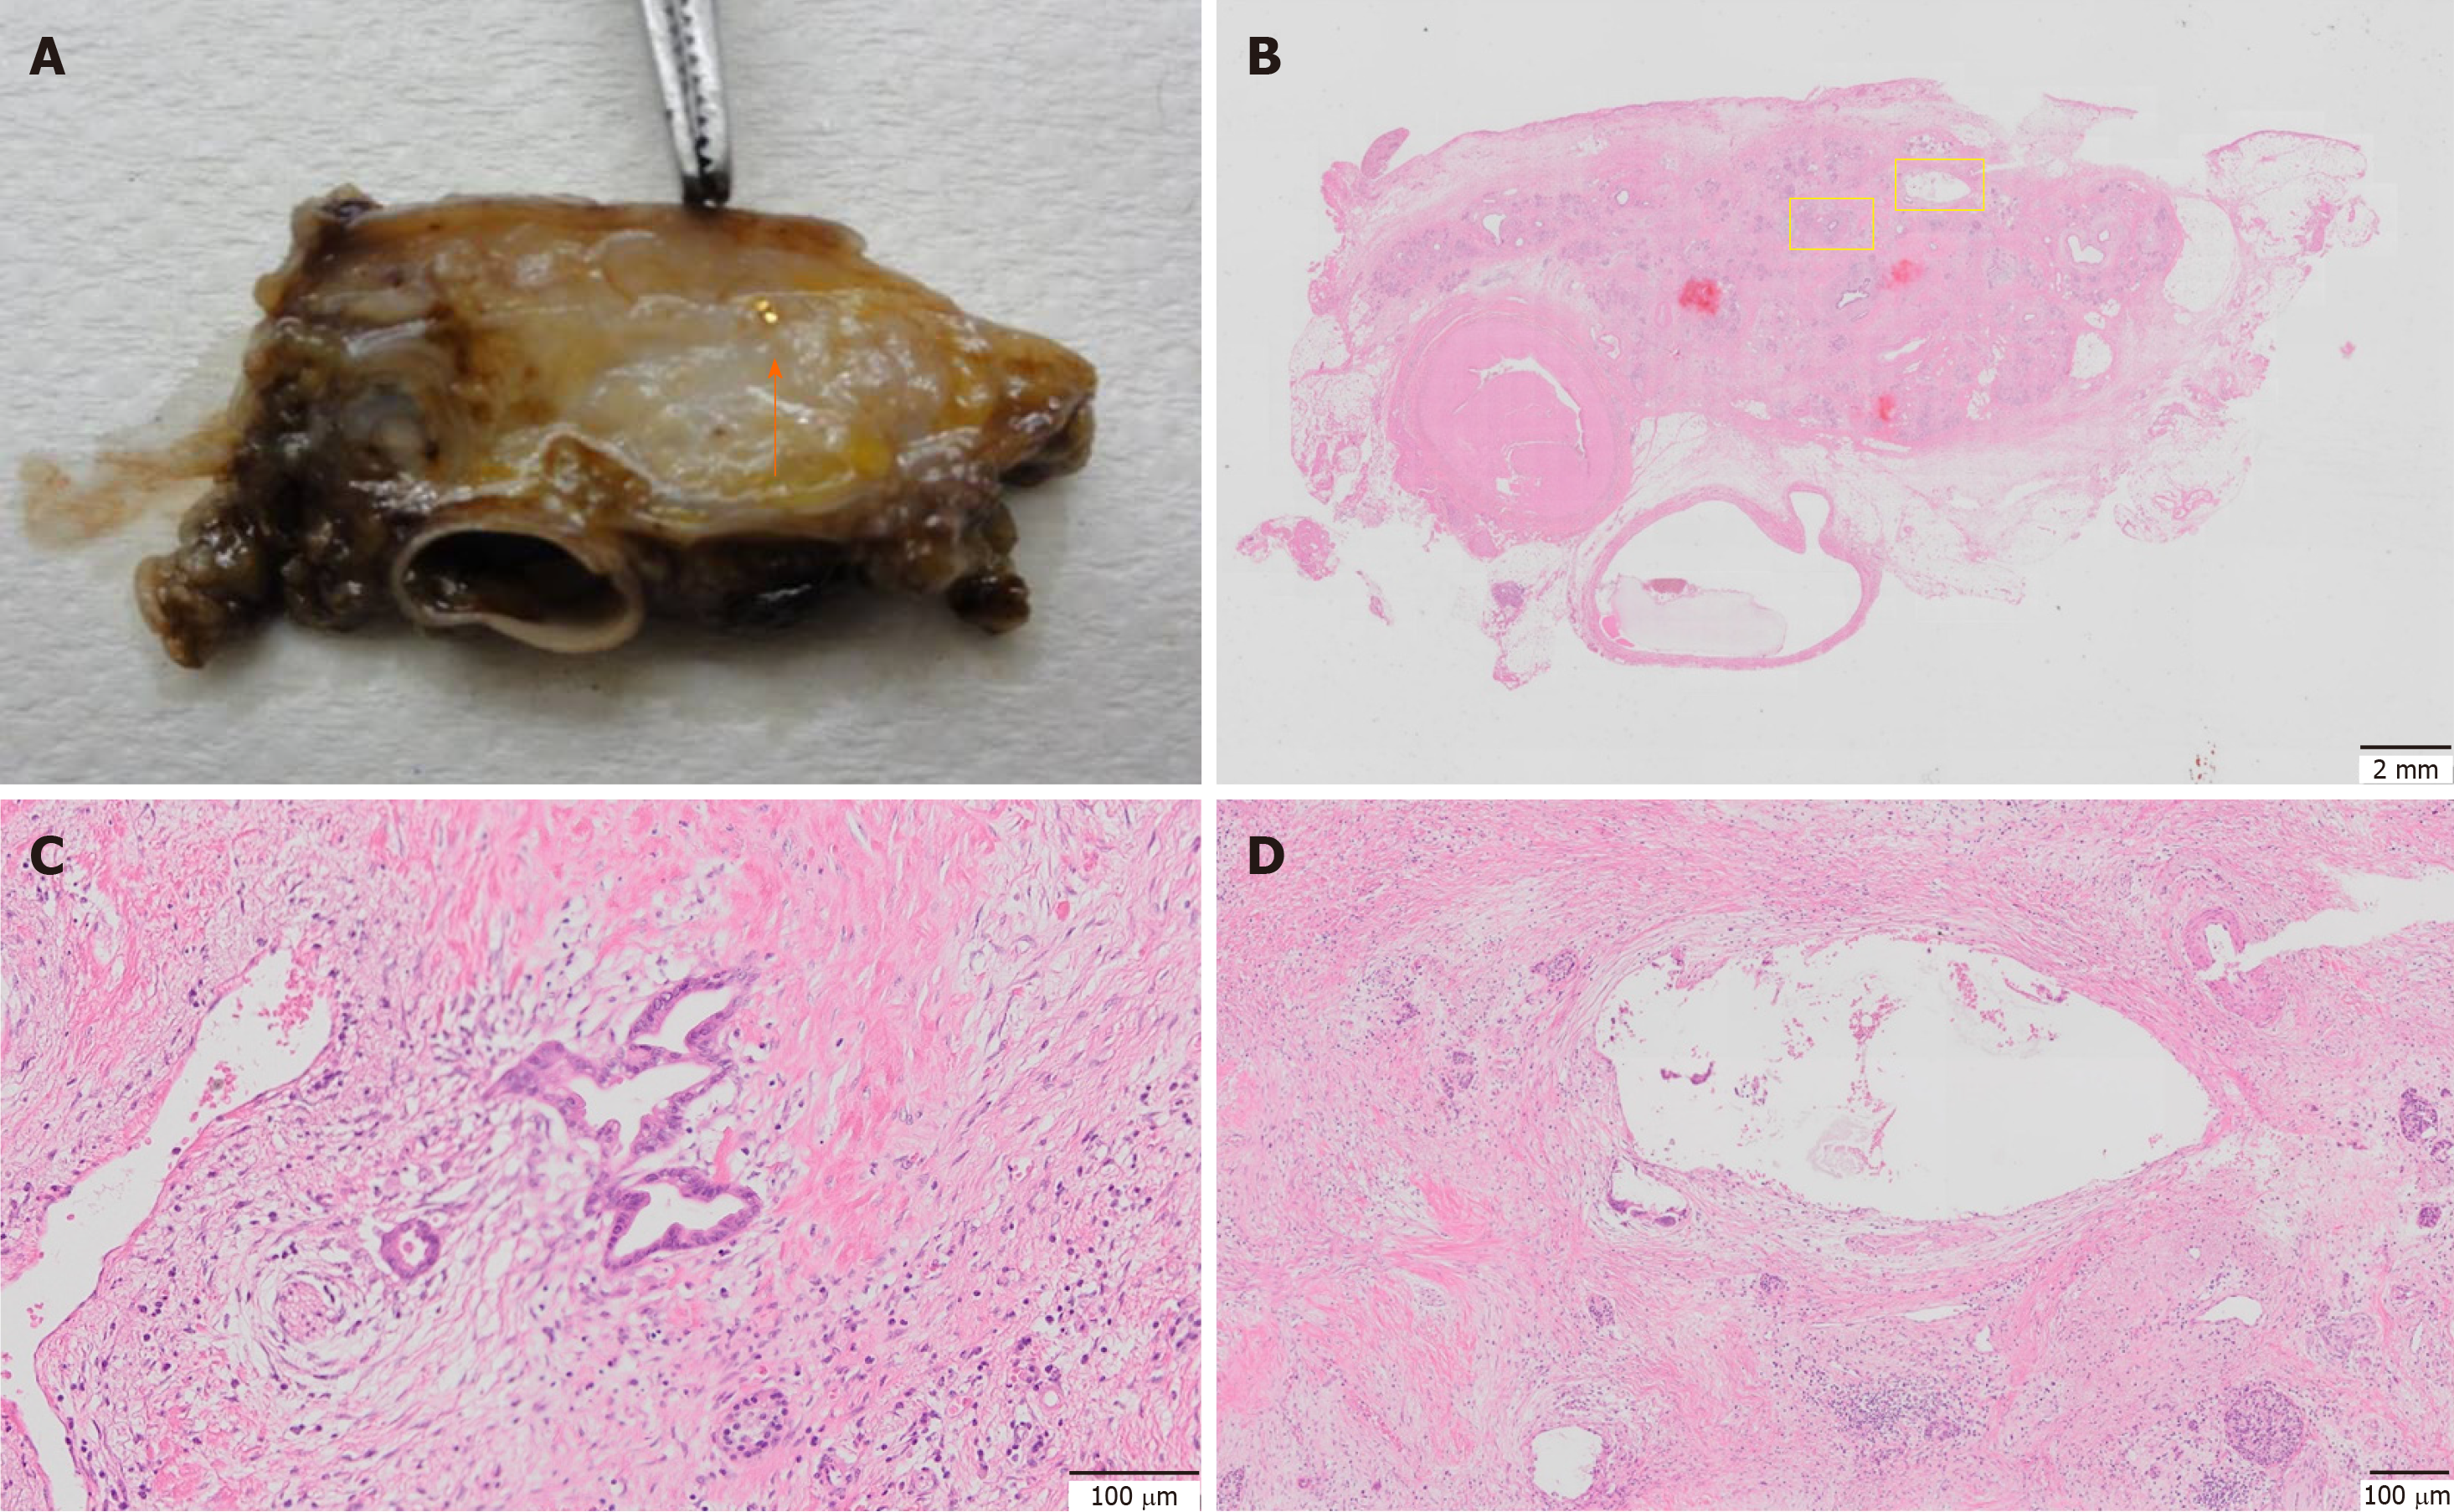
Figure 6 Histological findings.
A: Orange arrow indicates the gold marker; B: hematoxylin and eosin staining of the pathological specimen after chemoradiation therapy. Left yellow square indicates magnified area shown in C and right yellow square indicates magnified area shown in D; C: Very few residual cancer observed with Evans grade III status; D: The hollow area is where the marker was inserted. No significant changes around this area, such as accumulation of inflammatory cells or fibrosis, were observed.
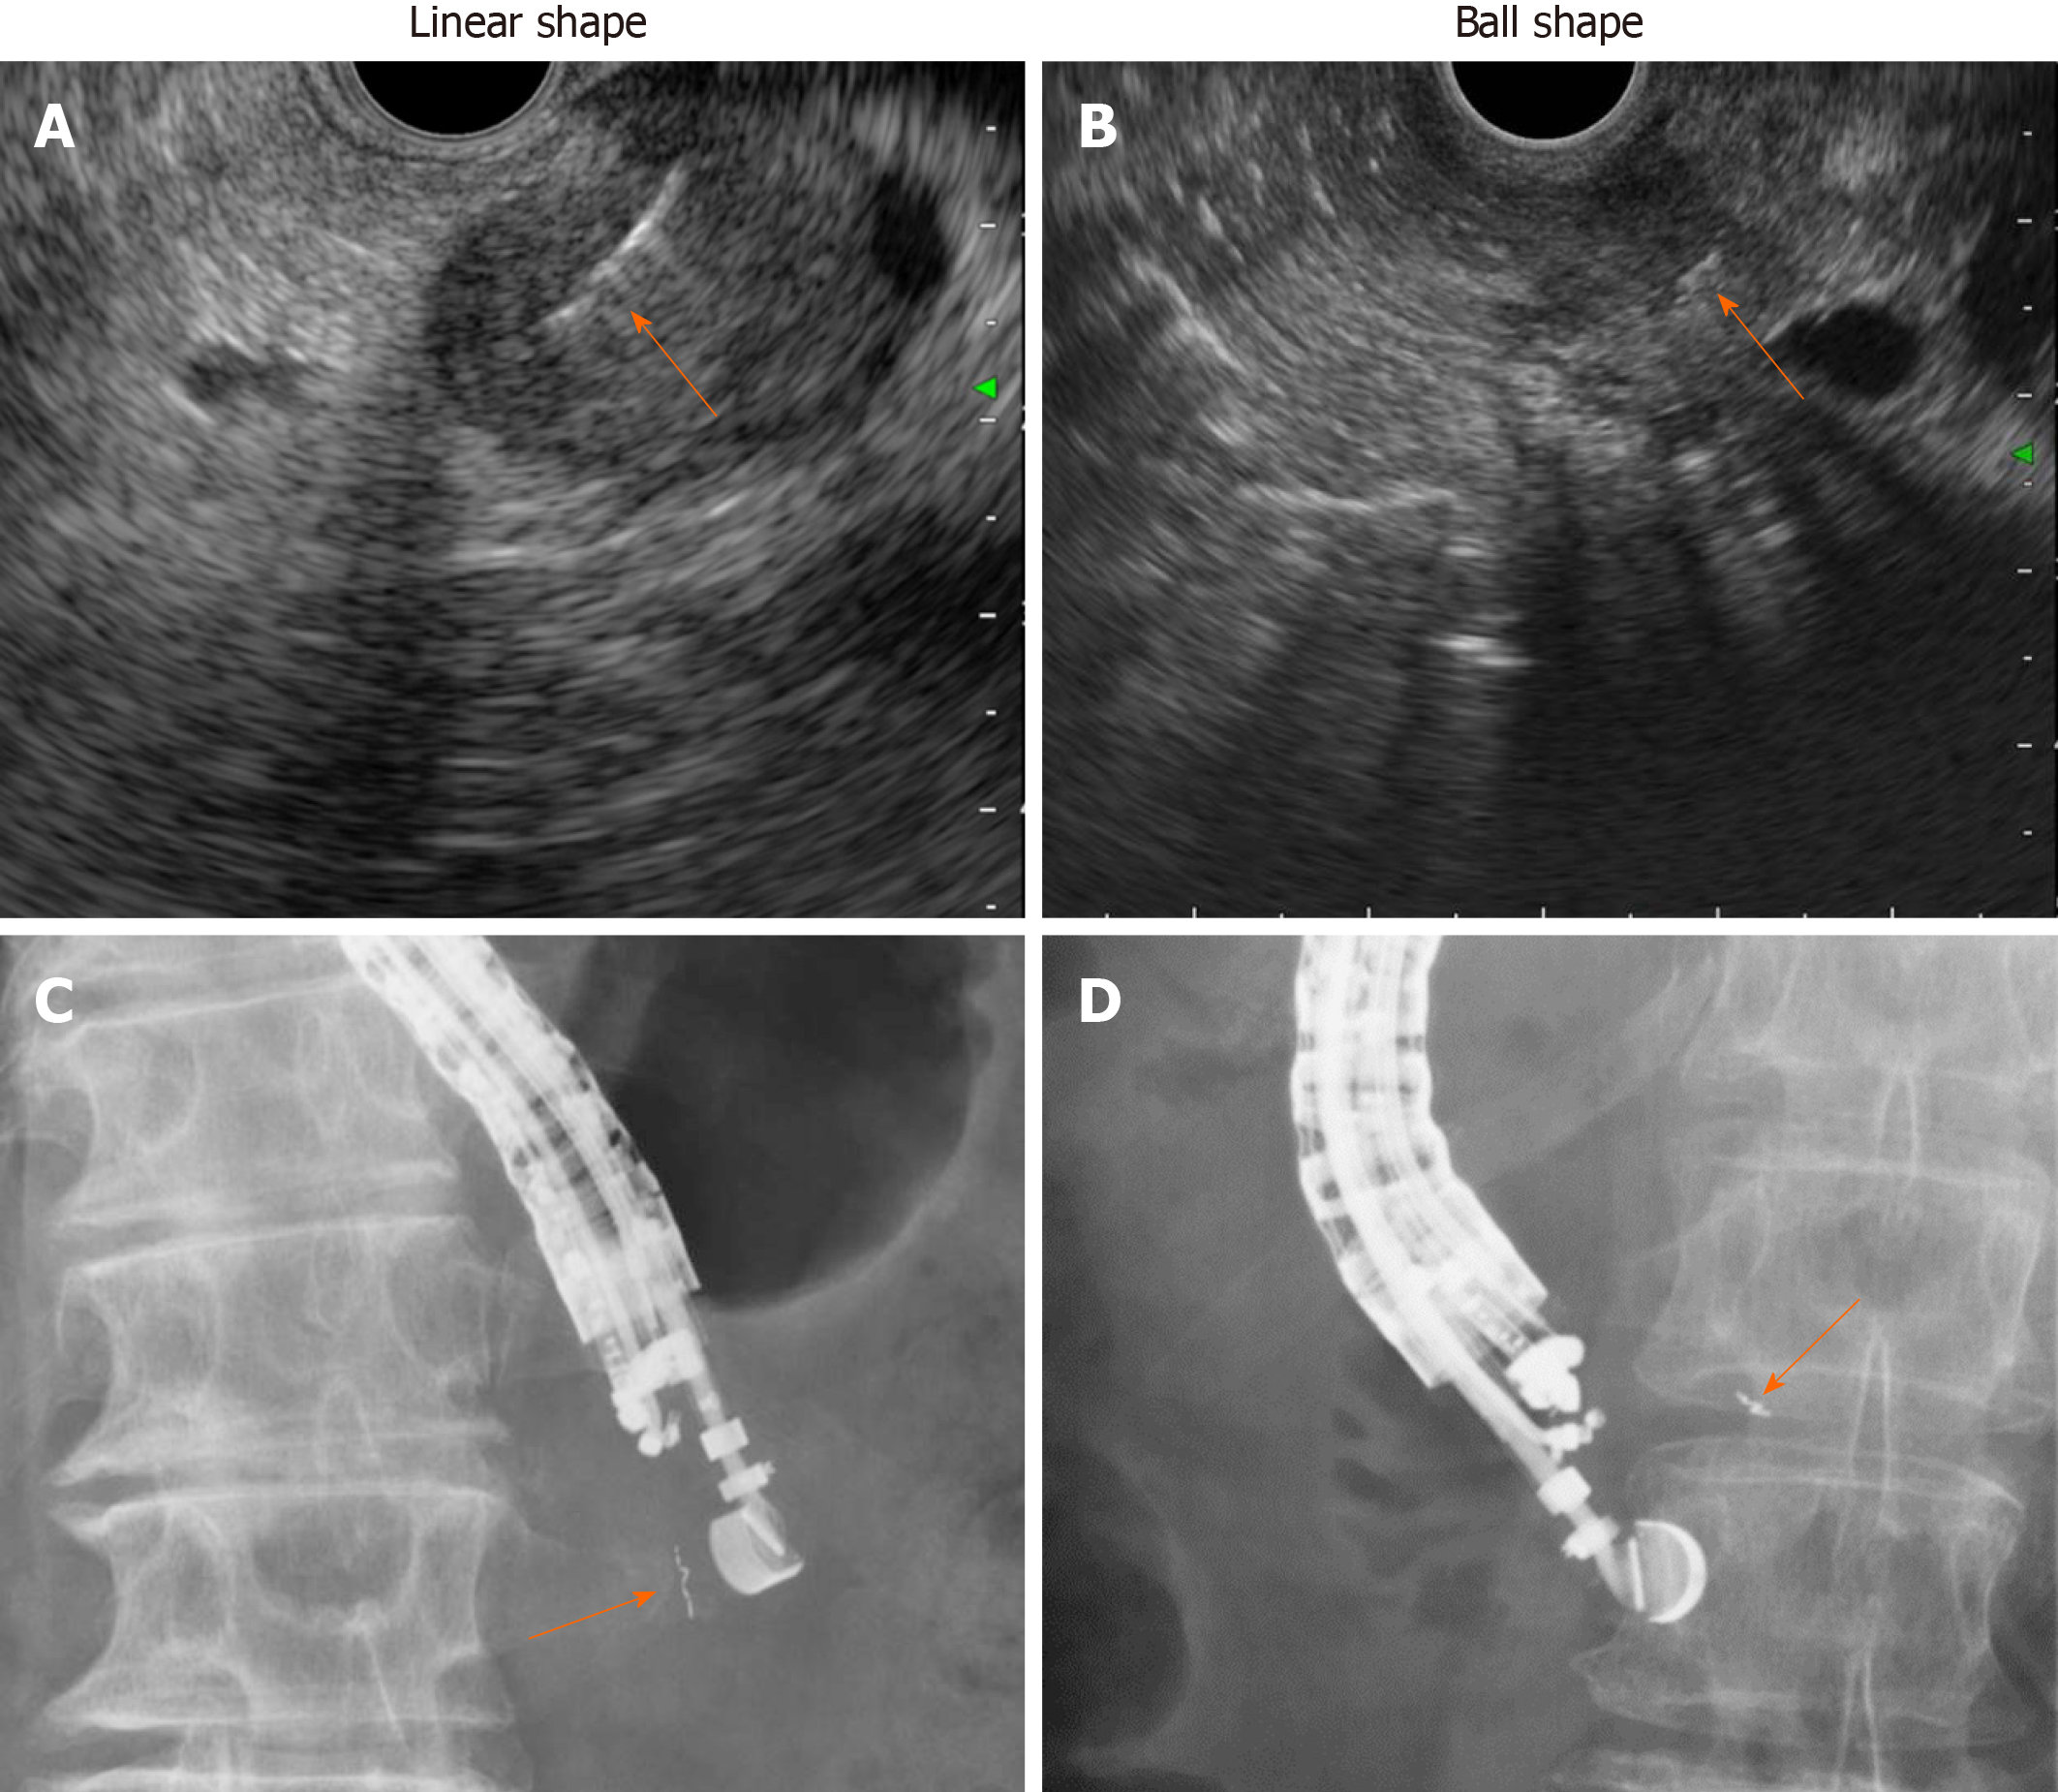
Figure 7 Various insertion techniques for gold anchor.
Linear shape insertion. A: Endoscopic ultrasound image for linear shape insertion; B: Endoscopic ultrasound image for ball shape insertion; C: X-ray image for linear shape insertion. D: X-ray image for ball shape insertion. Orange arrow indicates gold anchor placed in either linear (A, C) or ball (B, D) shape.
- Citation: Ashida R, Fukutake N, Takada R, Ioka T, Ohkawa K, Katayama K, Akita H, Takahashi H, Ohira S, Teshima T. Endoscopic ultrasound-guided fiducial marker placement for neoadjuvant chemoradiation therapy for resectable pancreatic cancer. World J Gastrointest Oncol 2020; 12(7): 768-781
- URL: https://www.wjgnet.com/1948-5204/full/v12/i7/768.htm
- DOI: https://dx.doi.org/10.4251/wjgo.v12.i7.768


