Copyright
©The Author(s) 2020.
World J Gastrointest Oncol. Oct 15, 2020; 12(10): 1146-1166
Published online Oct 15, 2020. doi: 10.4251/wjgo.v12.i10.1146
Published online Oct 15, 2020. doi: 10.4251/wjgo.v12.i10.1146
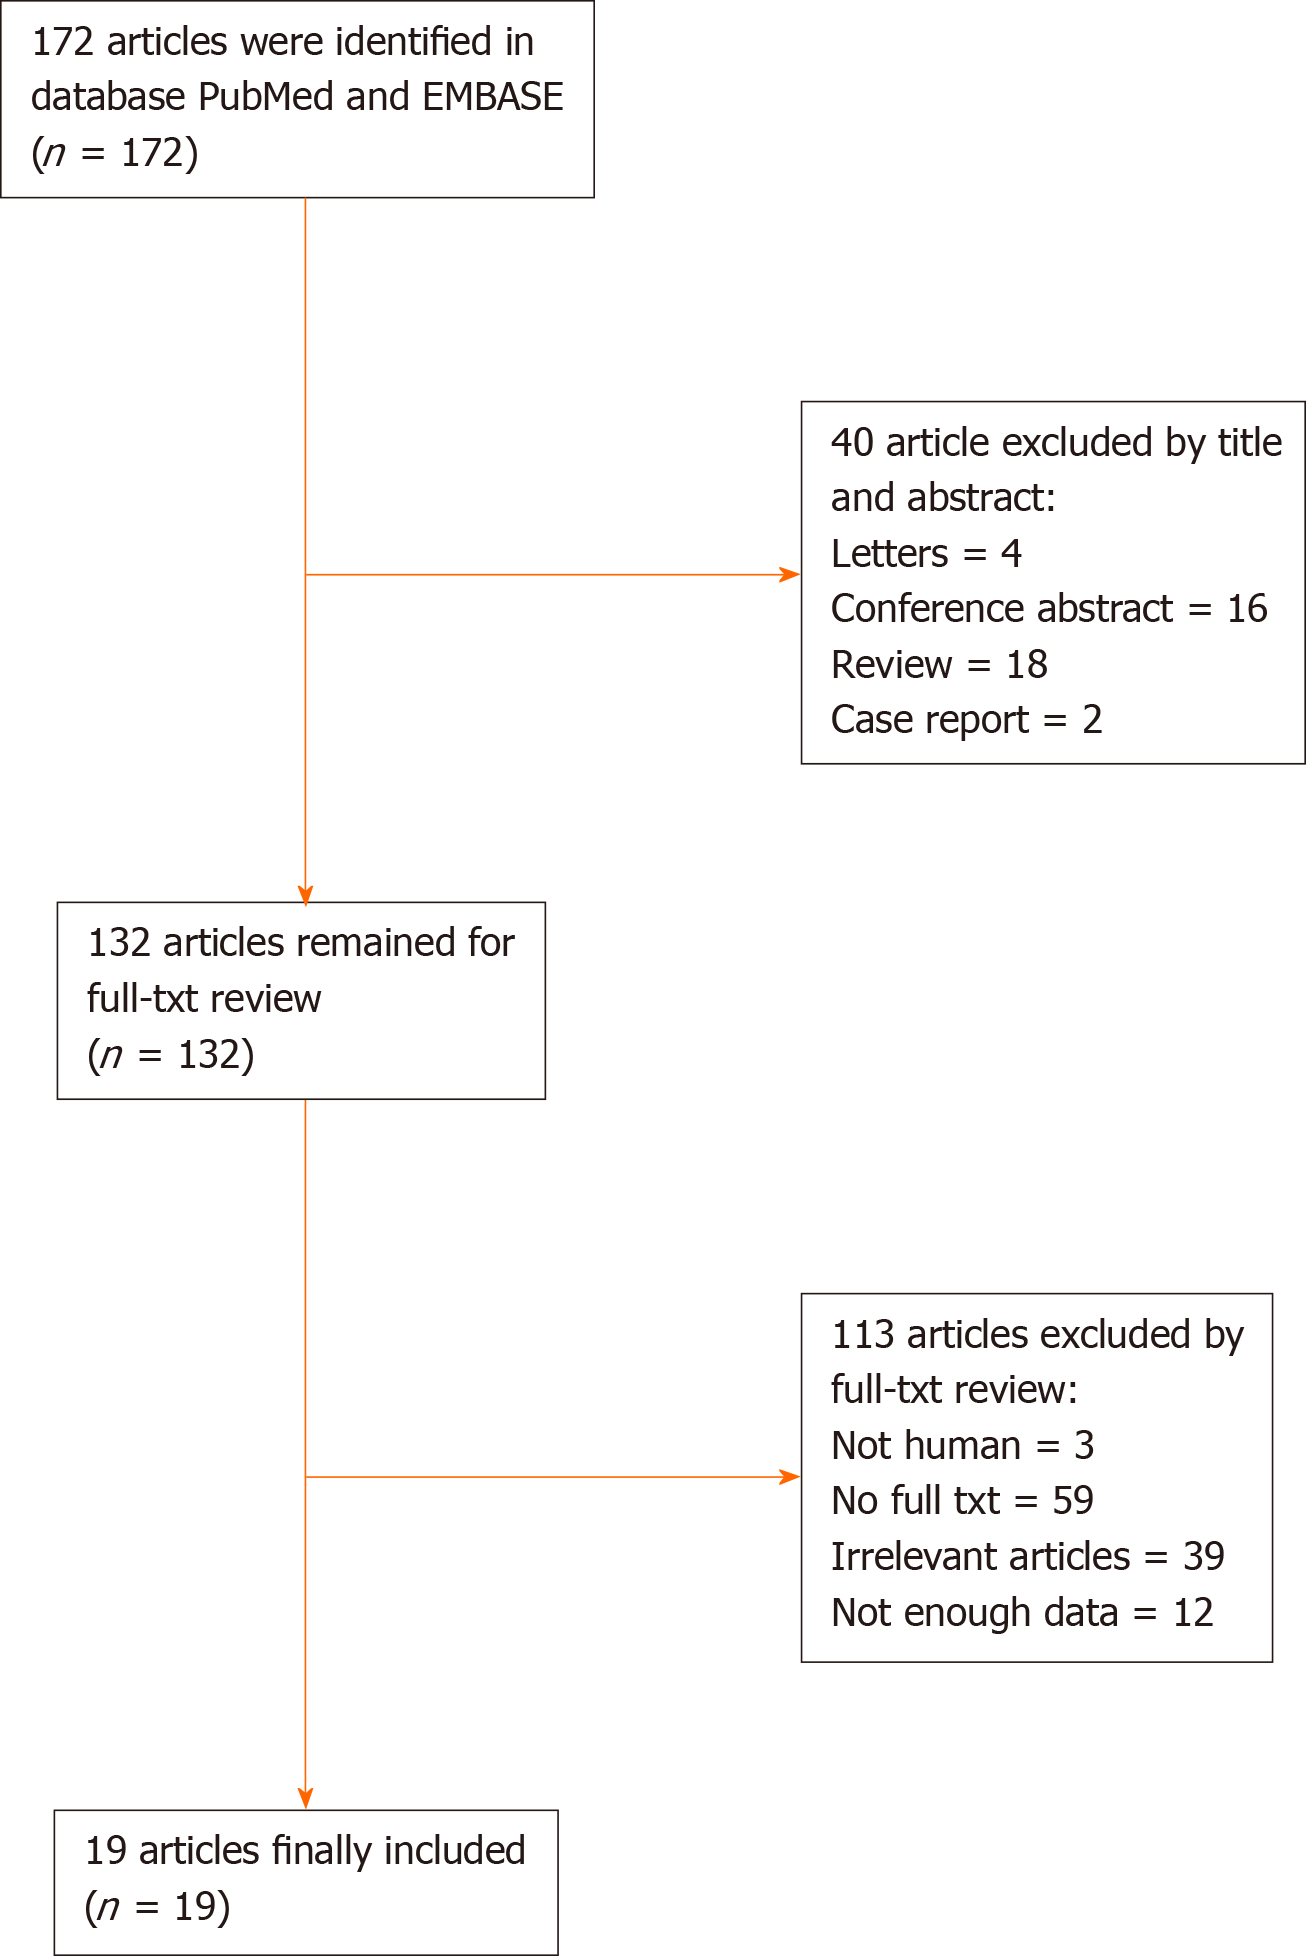
Figure 1 Flow chart of the meta-analysis.
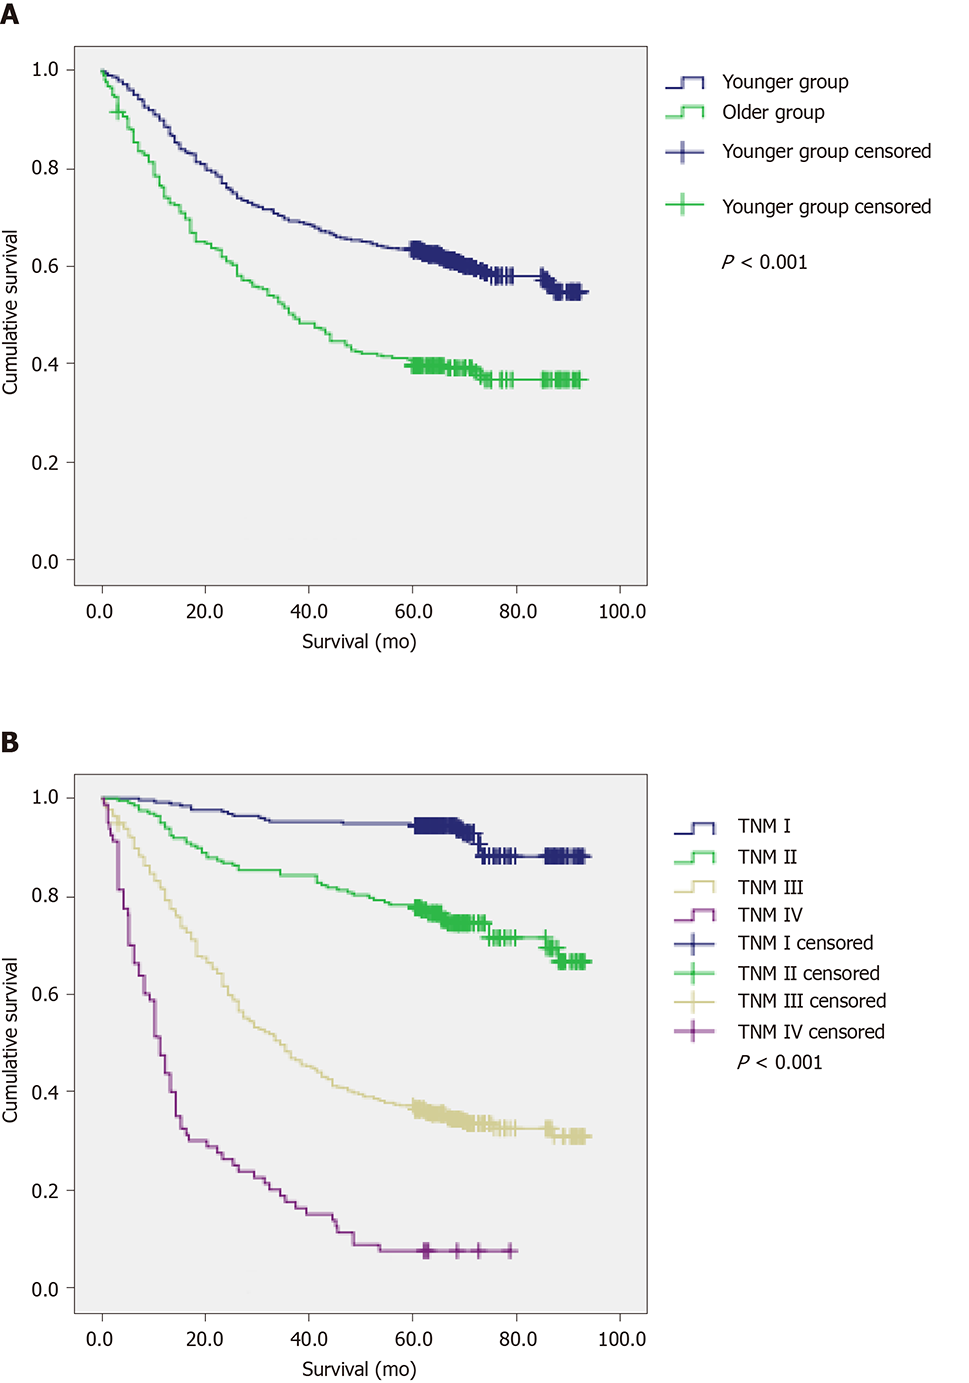
Figure 2 Overall survival.
A: Overall survival based on age in 1037 patients (P < 0.001); B: Overall survival based on tumor–node–metastasis stage in 1037 patients (P < 0.001).
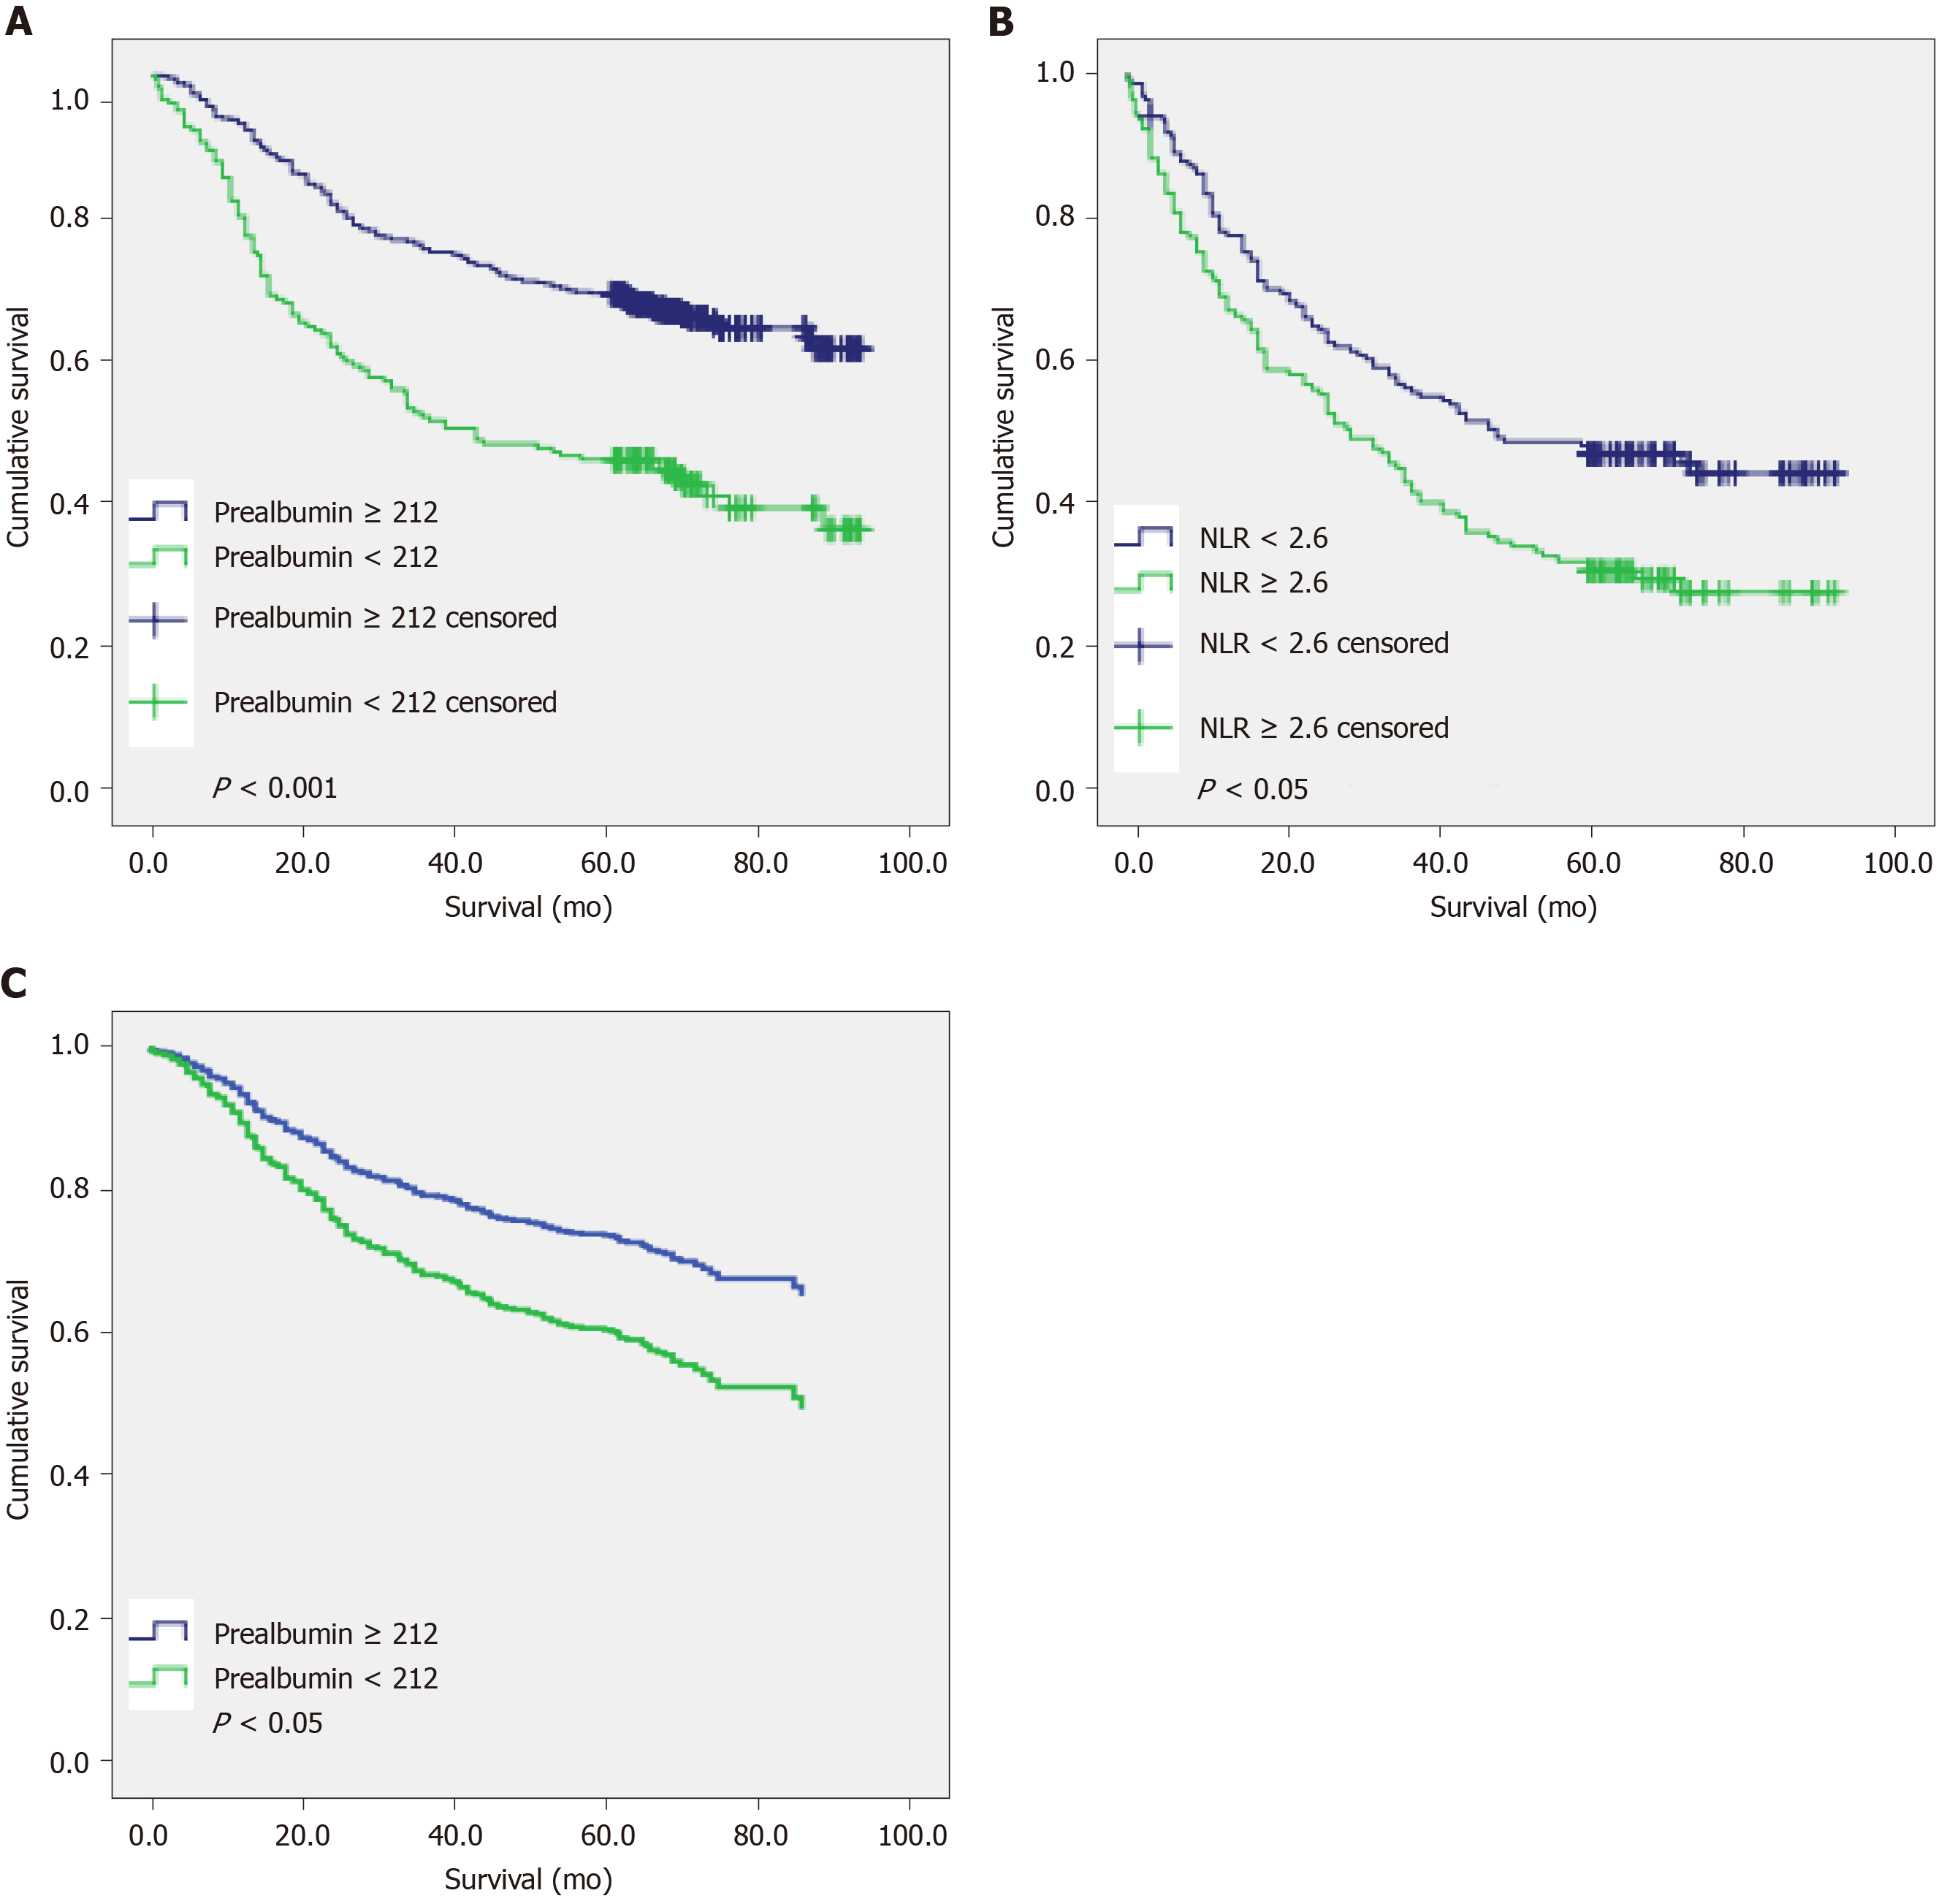
Figure 3 Overall survival.
A: Overall survival based on preoperative pre-albumin in 716 younger patients (P < 0.001); B: Overall survival based on preoperative neutrophil-lymphocyte ratio in 321 older patients (P < 0.05); C: Overall survival based on preoperative pre-albumin in 651 middle age patients (45 ≤ age < 70) (P < 0.05).
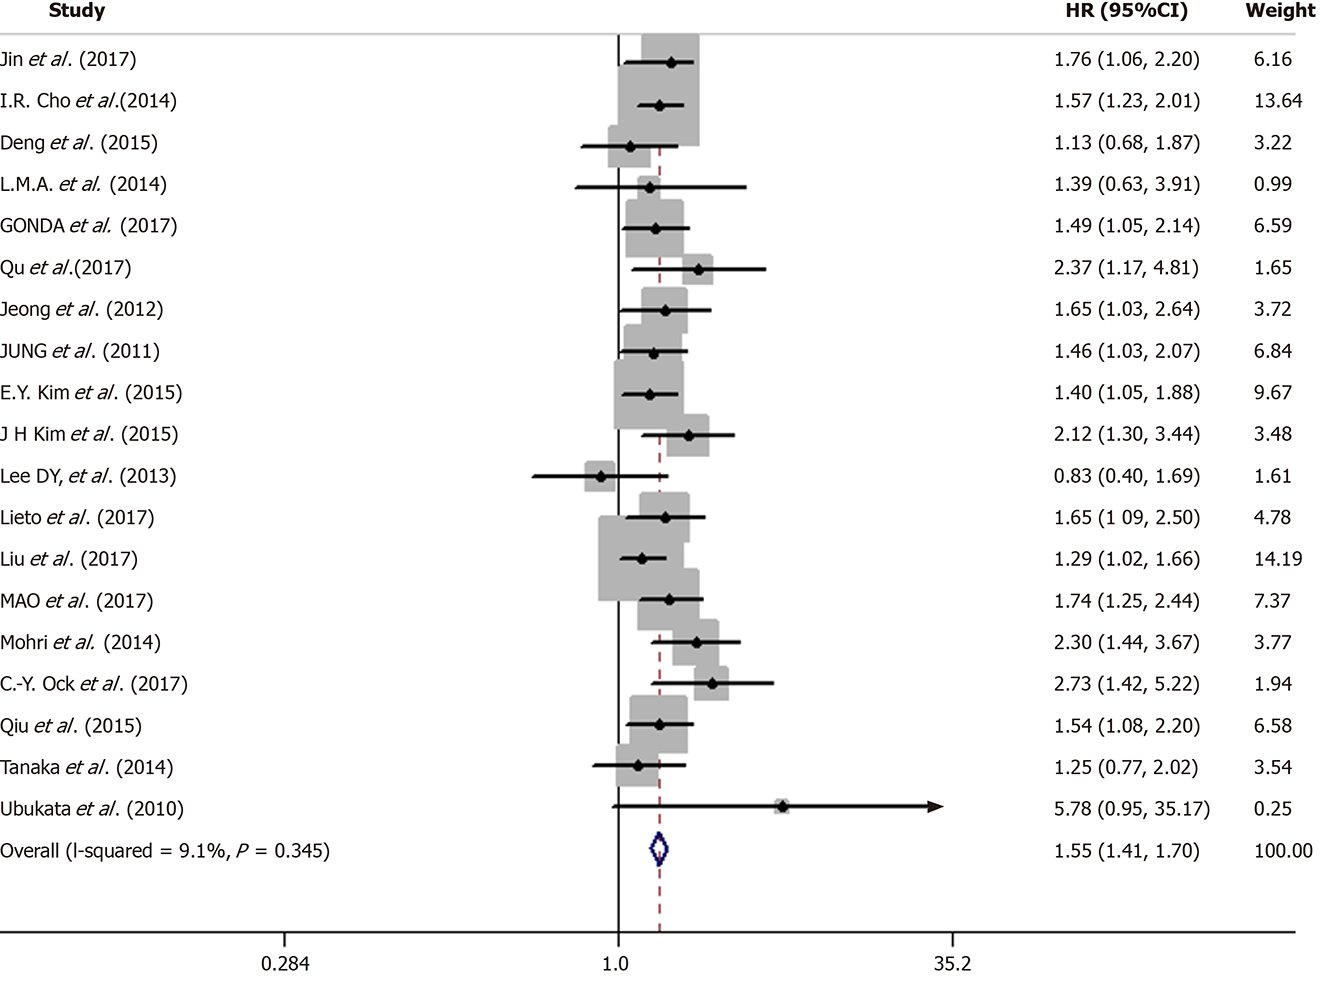
Figure 4 Forest plots of relationship between neutrophil-lymphocyte ratio and overall survival in patients with gastric cancer.
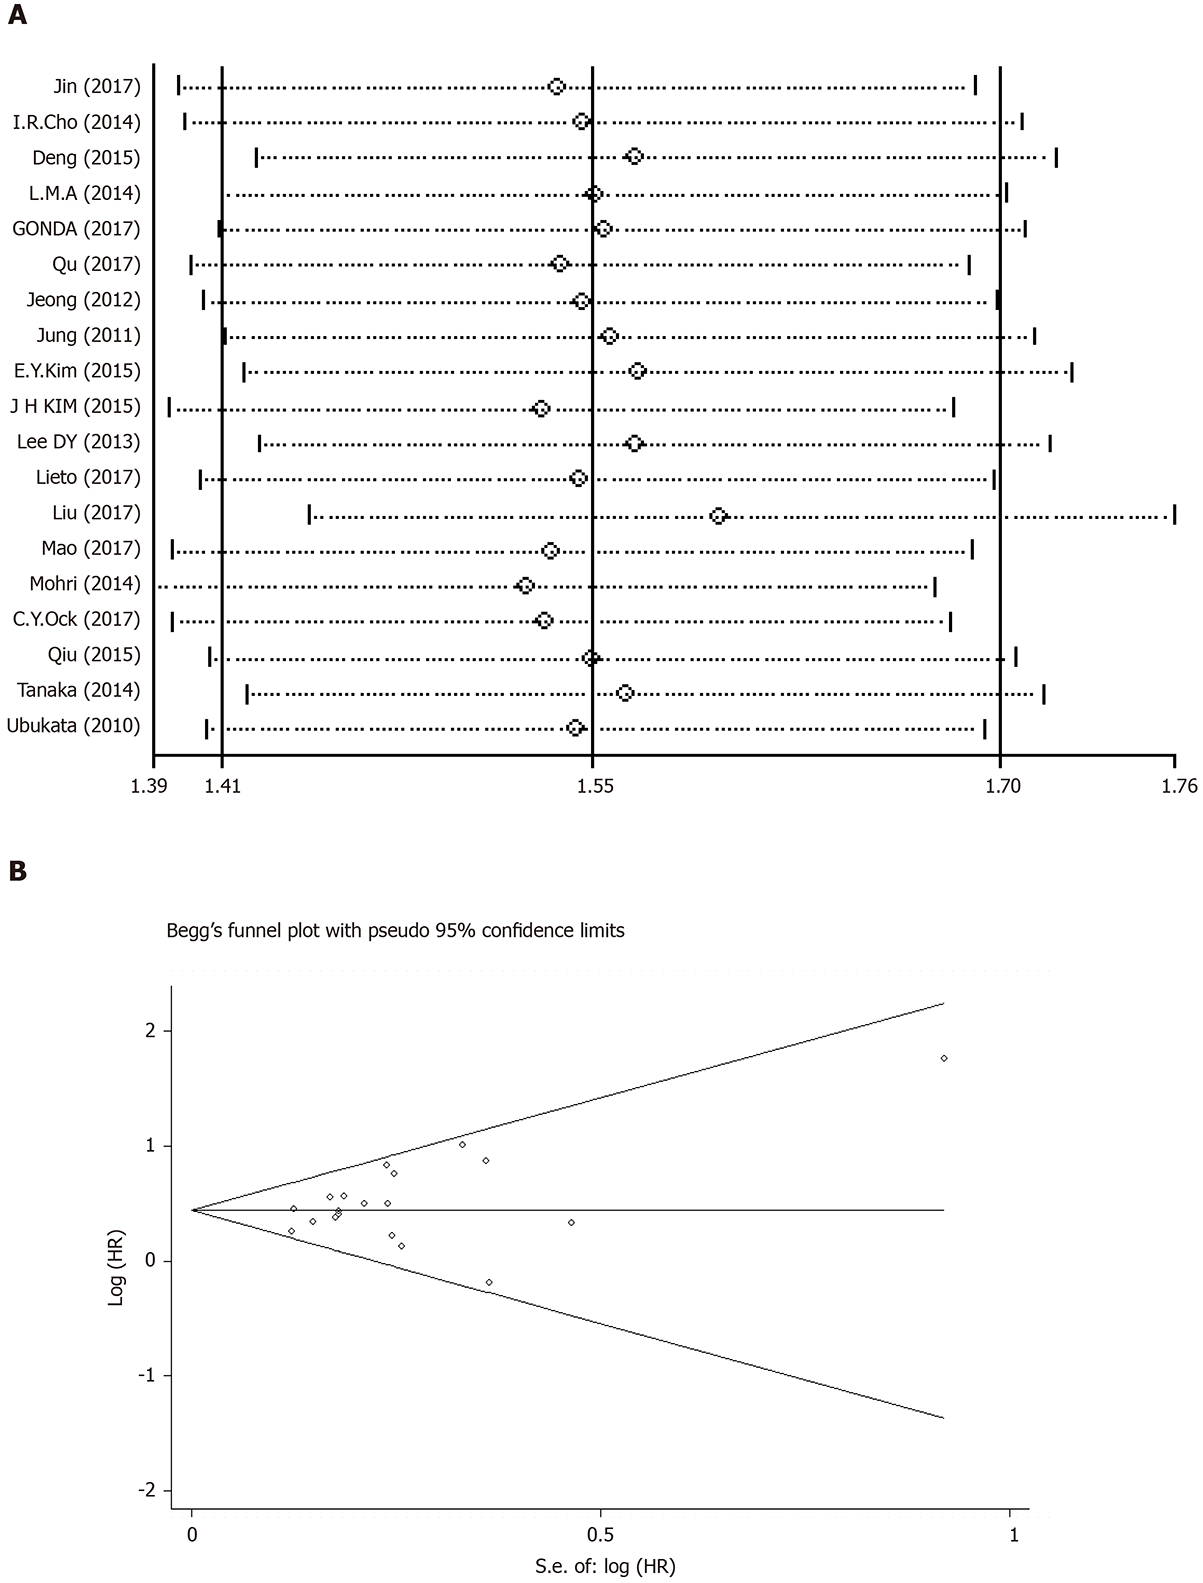
Figure 5 Results of sensitivity analysis and Begg’s funnel plot.
A: Sensitivity analysis of neutrophil-lymphocyte ratio for overall survival in patients with gastric cancer; B: Begg’s funnel plot for overall survival in patients with gastric cancer.
- Citation: Li Q, Huang LY, Xue HP. Comparison of prognostic factors in different age groups and prognostic significance of neutrophil-lymphocyte ratio in patients with gastric cancer. World J Gastrointest Oncol 2020; 12(10): 1146-1166
- URL: https://www.wjgnet.com/1948-5204/full/v12/i10/1146.htm
- DOI: https://dx.doi.org/10.4251/wjgo.v12.i10.1146


