Copyright
©The Author(s) 2019.
World J Gastrointest Oncol. Mar 15, 2019; 11(3): 250-263
Published online Mar 15, 2019. doi: 10.4251/wjgo.v11.i3.250
Published online Mar 15, 2019. doi: 10.4251/wjgo.v11.i3.250
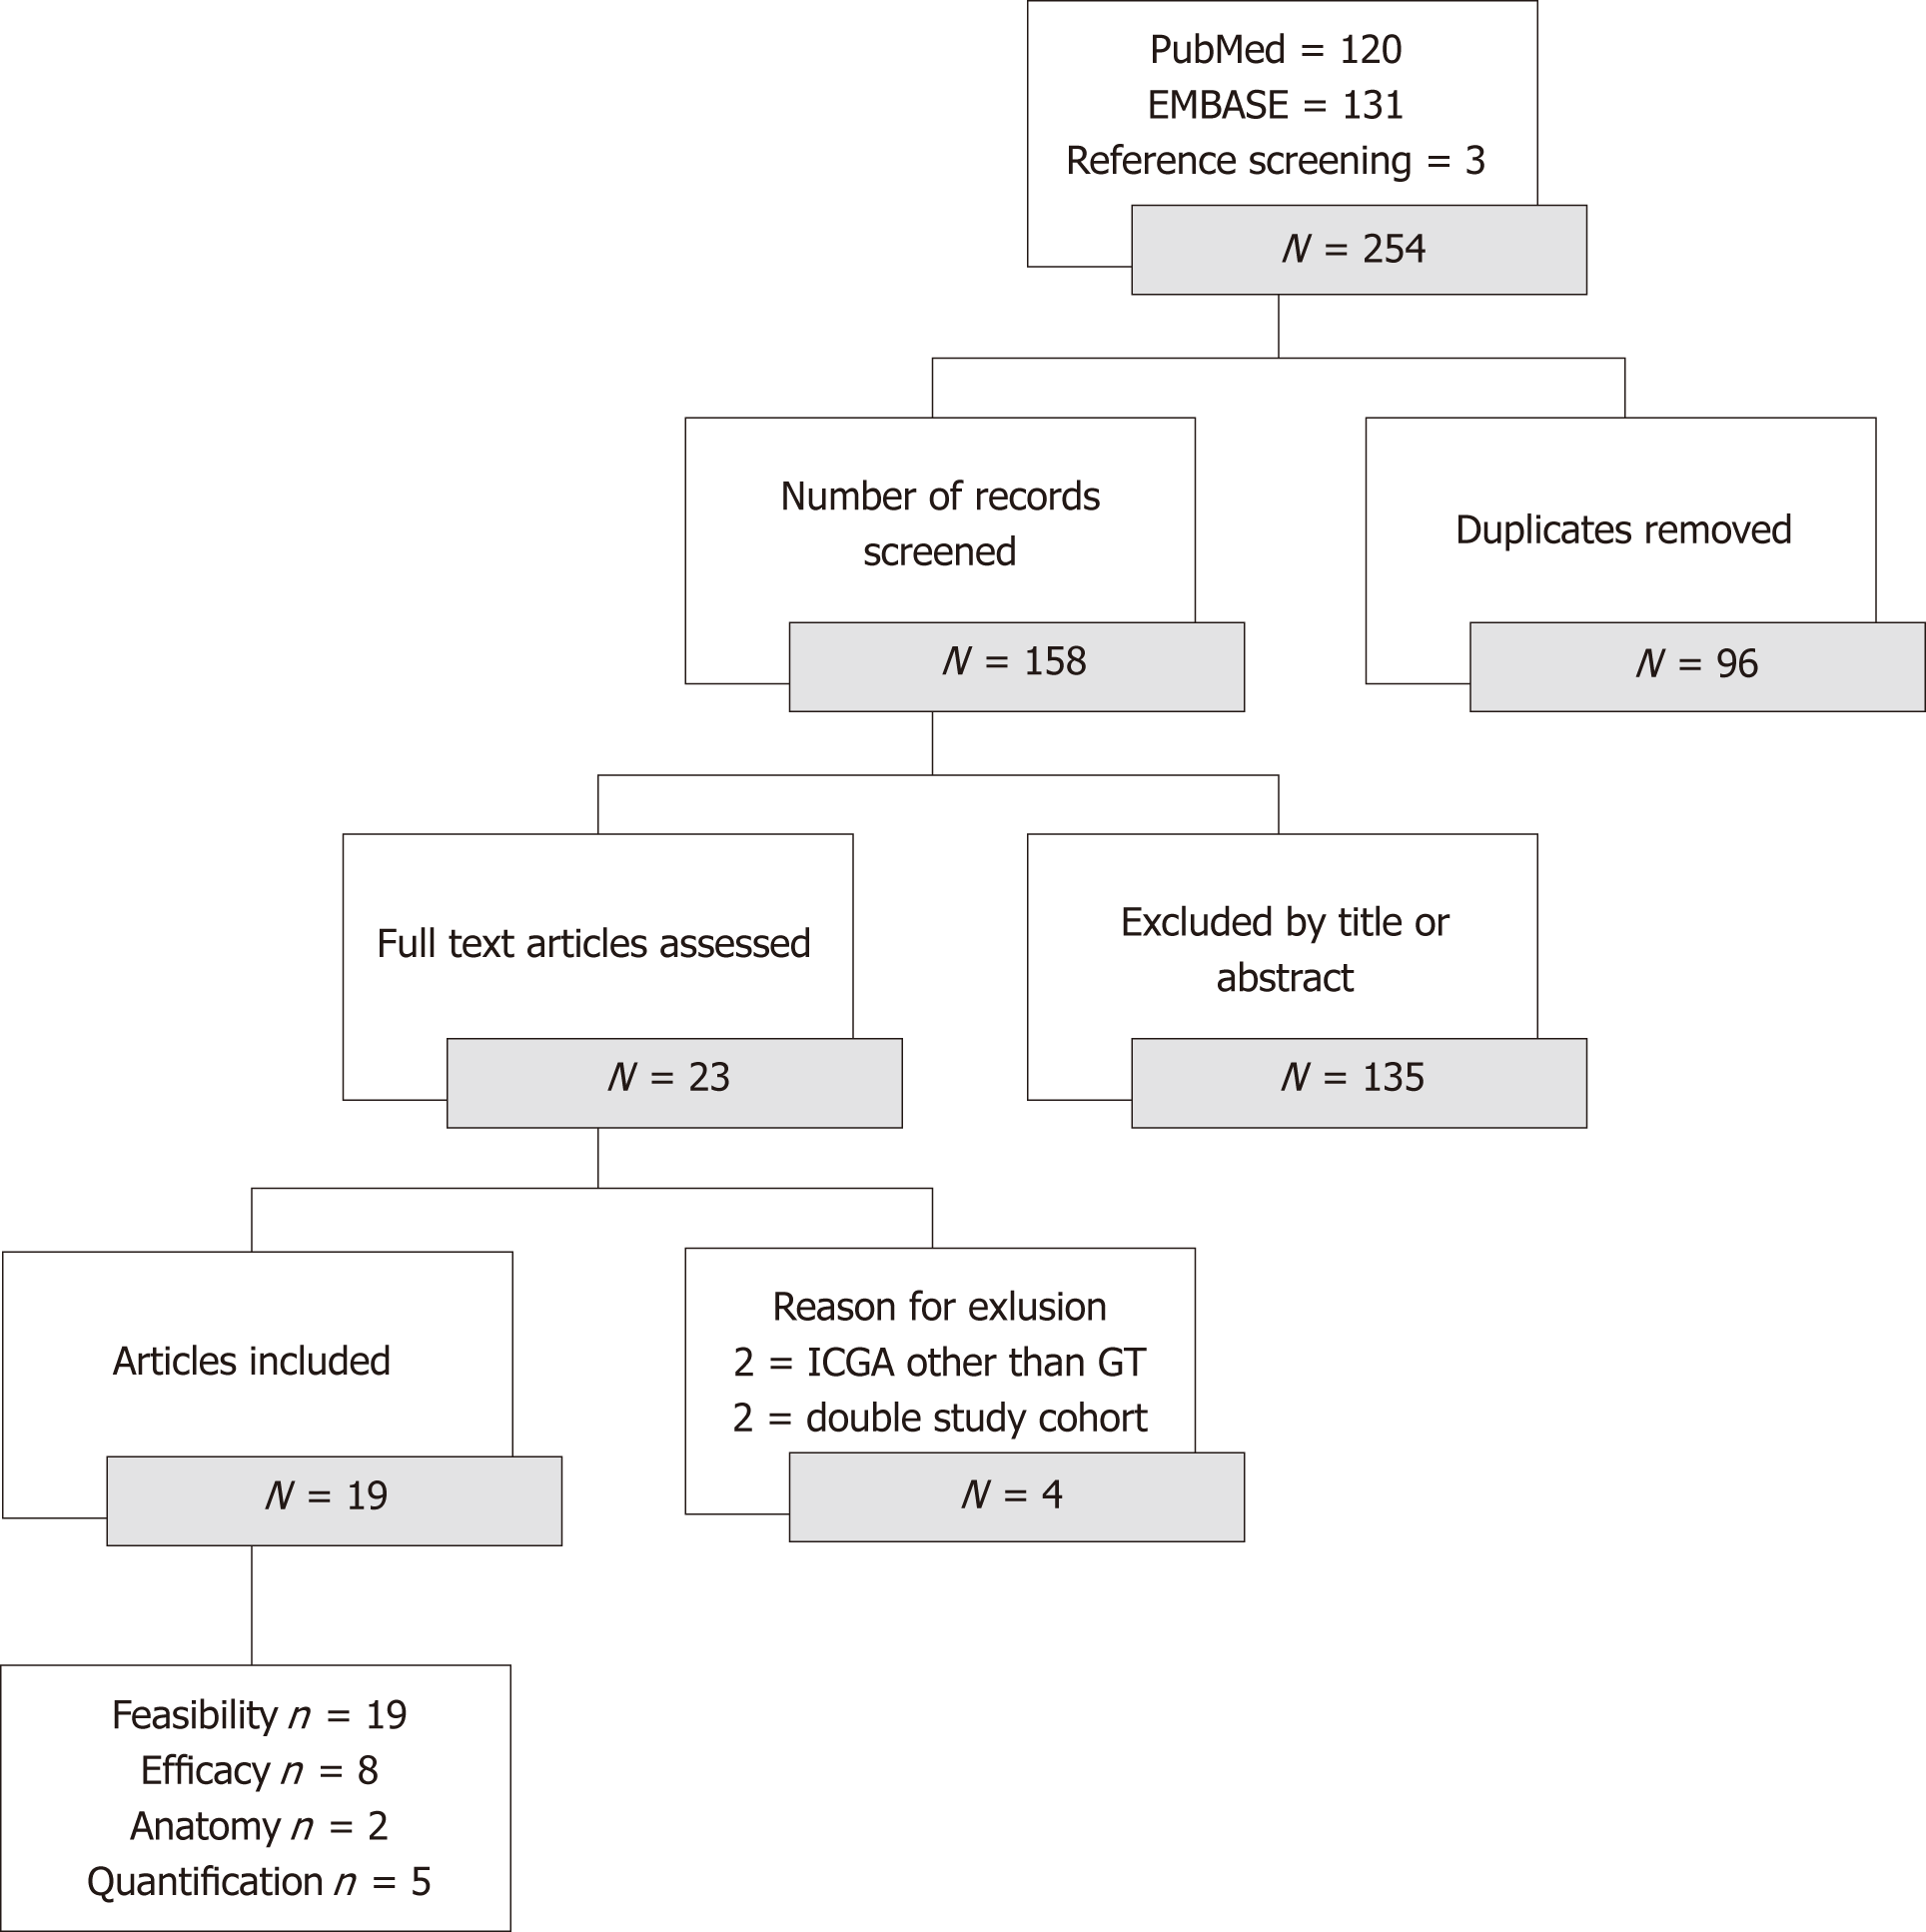
Figure 1 PRISMA flowchart of the search.
ICGA: Indocyanine green fluorescence angiography; GT: Gastric tube.
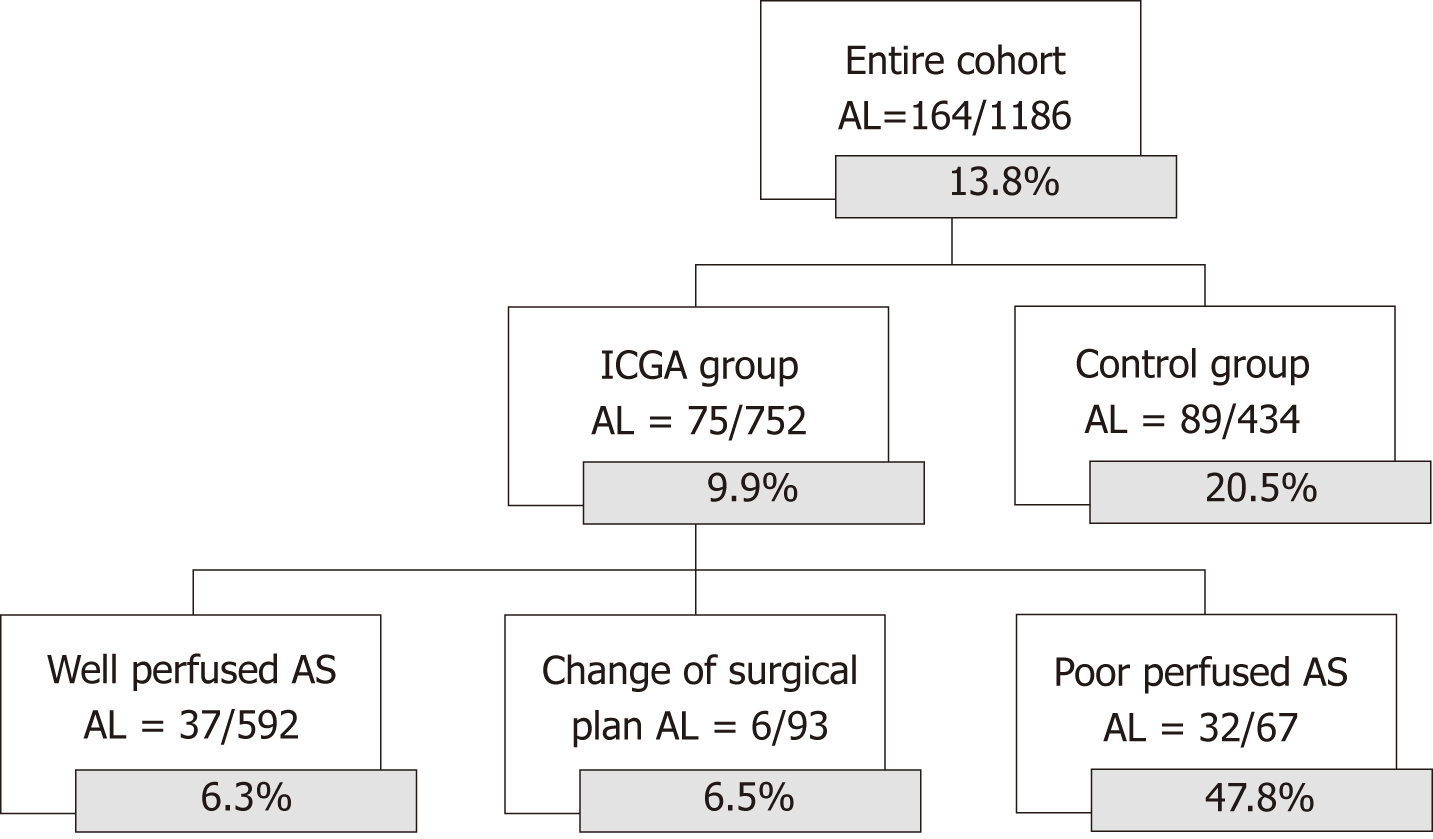
Figure 2 Anastomotic leakage rates of the entire cohort.
ICGA: Indocyanine green fluorescence angiography; AL: Anastomotic leakage; AS: Anastomotic sites.
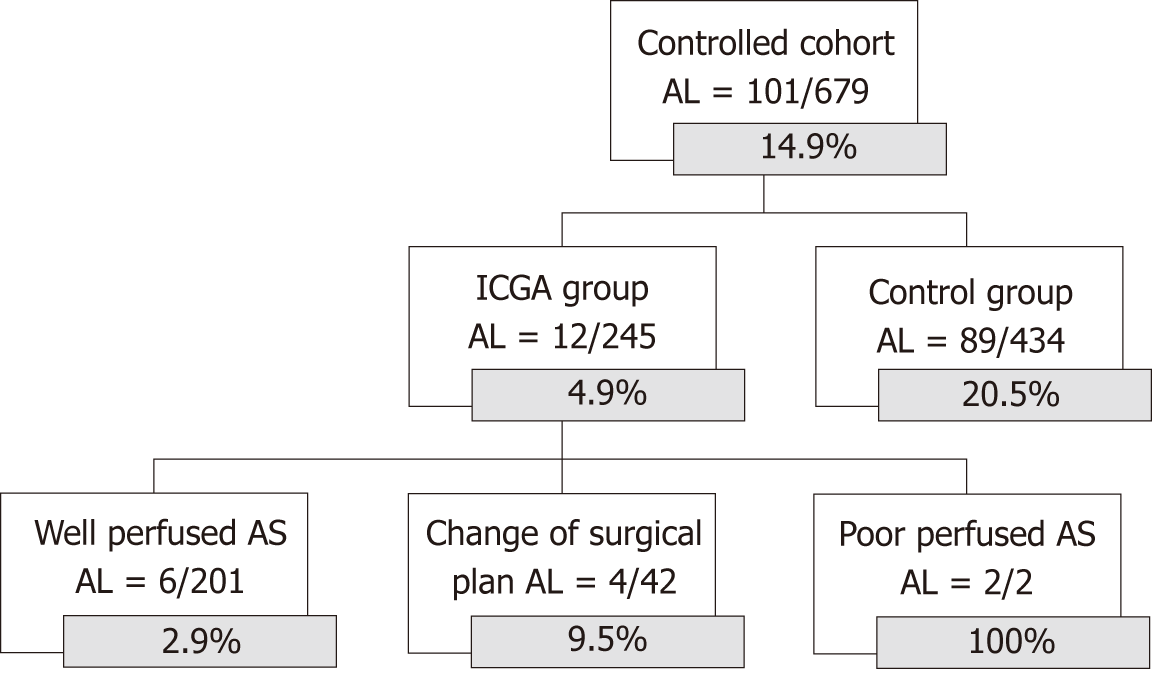
Figure 3 Anastomotic leakage rates of the cohort with a historical control group.
ICGA: Indocyanine green fluorescence angiography; AL: Anastomotic leakage; AS: Anastomotic sites.
- Citation: Van Daele E, Van Nieuwenhove Y, Ceelen W, Vanhove C, Braeckman BP, Hoorens A, Van Limmen J, Varin O, Van de Putte D, Willaert W, Pattyn P. Near-infrared fluorescence guided esophageal reconstructive surgery: A systematic review. World J Gastrointest Oncol 2019; 11(3): 250-263
- URL: https://www.wjgnet.com/1948-5204/full/v11/i3/250.htm
- DOI: https://dx.doi.org/10.4251/wjgo.v11.i3.250


