Copyright
©The Author(s) 2018.
World J Gastrointest Oncol. Jan 15, 2018; 10(1): 56-61
Published online Jan 15, 2018. doi: 10.4251/wjgo.v10.i1.56
Published online Jan 15, 2018. doi: 10.4251/wjgo.v10.i1.56
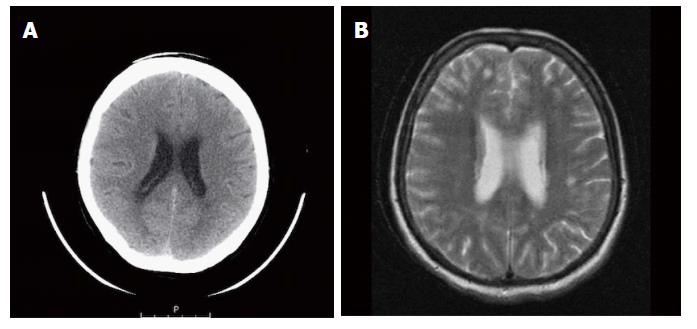
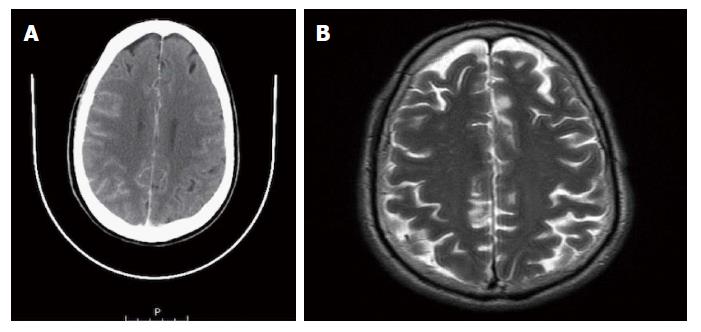
Figure 1 Patient No.
1. A: Computed tomography brain did not reveal brain lesions; B: Magnetic resonance imaging brain showed findings consistent with leptomeningeal carcinomatosis.
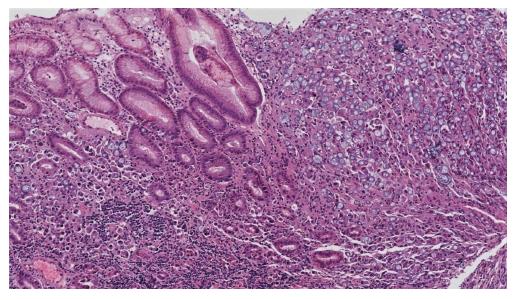
Figure 2 Patient No.
1. Diffuse infiltration of gastric mucosa from a poorly differentiated poorly cohesive gastric adenocarcinoma (including mixed adenocarcinoma with > 50% signet ring cells features (HE 100 ×).
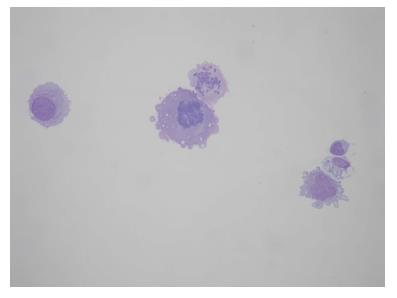
Figure 3 Patient No.
1. Four atypical cells, one lymphocyte and one macrophages next to the lymphocyte. Atypical cells are isolated, two of those show mitotic activity. The size of atypical cells and lymphocyte could be compared (Hemacolor 40 ×).
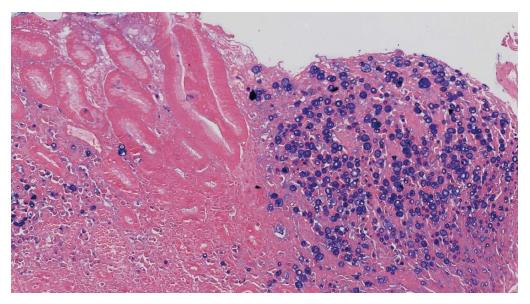
Figure 4 Patient No.
2. Alcian blue highlights difference in mucin production between cancer cells (blue) and normal gastric tissue (no presence), helping us also determine about the extent of the infiltration (Alcian blue 200 ×).
Figure 5 Patient No.
2. A: Computed tomography brain did not reveal brain lesions; B: Magnetic resonance imaging brain showed findings consistent with leptomeningeal carcinomatosis.
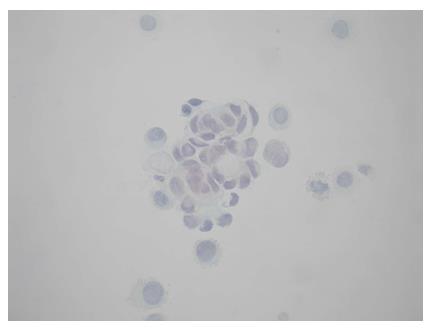
Figure 6 Patient No.
2. An irregular cluster of atypical cells. The cells show intermediate size, degeneration changes, indistinct cytoplasmic borders and moderate size of nuclei. Nuclear/cytoplasmic ratio is increased (Papanicolaou 40 ×).
- Citation: Kountourakis P, Papamichael D, Haralambous H, Michael M, Nakos G, Lazaridou S, Fotiou E, Vassiliou V, Andreopoulos D. Leptomeningeal metastases originated from esophagogastric junction/gastric cancer: A brief report of two cases. World J Gastrointest Oncol 2018; 10(1): 56-61
- URL: https://www.wjgnet.com/1948-5204/full/v10/i1/56.htm
- DOI: https://dx.doi.org/10.4251/wjgo.v10.i1.56


