Copyright
©The Author(s) 2016.
World J Hepatol. Aug 18, 2016; 8(23): 985-993
Published online Aug 18, 2016. doi: 10.4254/wjh.v8.i23.985
Published online Aug 18, 2016. doi: 10.4254/wjh.v8.i23.985
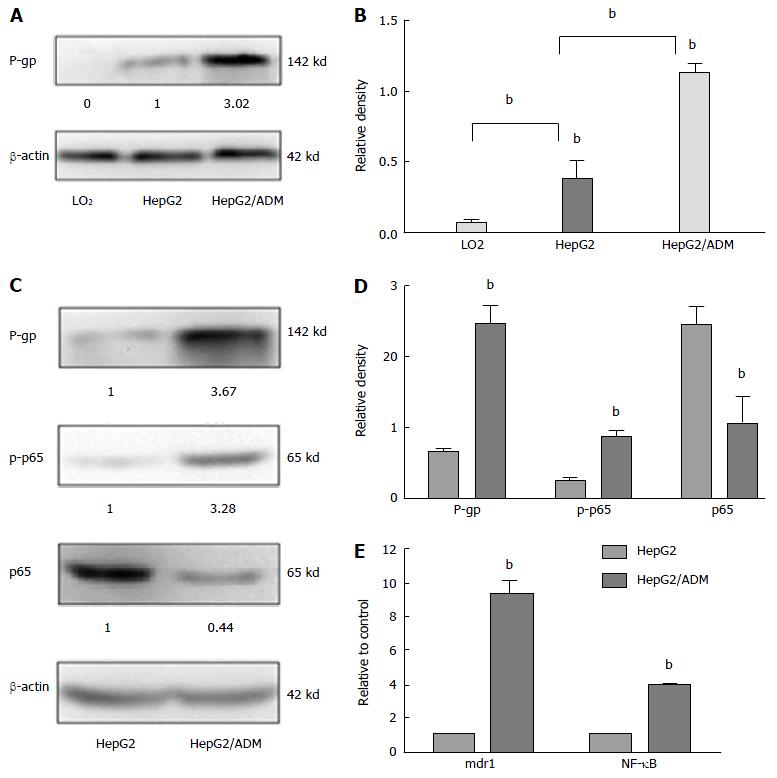
Figure 1 The levels of P-glycoprotein, mdr1 and nuclear factor-κB expression in different cell lines.
A and C: The levels of P-gp and NF-κB expression in HepG2 or HepG2/ADM cells were determined by Western blot. The number indicates the ratio of HepG2/ADM cells to HepG2 cells (n = 3, mean ± SD); B and D: The gray intensity images of Figure 1A and Figure 1C, respectively; E: The levels of mdr1 and NF-κB mRNA expression were determined by qRT-PCR. bP < 0.01 (n = 3, mean ± SD), compared with hepG2 or LO2 cell line. P-gp: P-glycoprotein; NF-κB: Nuclear factor-κB; ADM: Adriamycin.
Figure 2 Metformin enhances adriamycin-induced apoptosis of HepG2/adriamycin cells.
Cell early apoptosis was measured by Annexin-V-PE/7-AAD double staining assay in triplicate. A: The blank group (untreated); B: The control group (only treated with adriamycin); C: The experiment group (treated with metformin plus adriamycin). AAD: AnnexinV apoptosis detection.
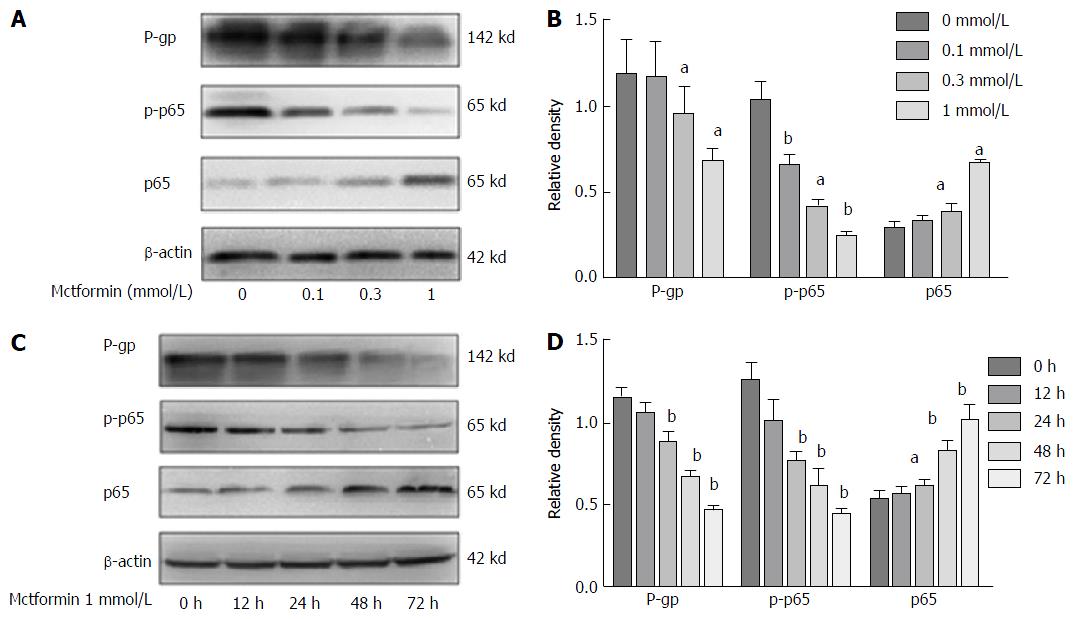
Figure 3 Metformin down-regulates P-glycoprotein expression via the nuclear factor-κB signaling pathway.
A: After HepG2/ADM cells were treated with different doses of metformin for 24 h, the levels of P-gp and p-p65 expression analyzed by Western blot were decreased in a dose-dependent manner, and the cytoplasma p65 increased in a dose-dependent manner; B: The gray intensity images of Figure 3A. aP < 0.05, bP < 0.01 vs the blank group (n = 3, mean ± SD); C: After HepG2/ADM cells were treated with 1 mmol/L metformin for different time periods, the levels of P-gp and p-p65 expression analyzed by Western blot were decreased in a time-dependent manner, and the cytoplasma p65 increased in a time-dependent manner; D: The gray intensity images of Figure 3C. aP < 0.05, bP < 0.01 vs the blank group (n = 3, mean ± SD). P-gp: P-glycoprotein; NF-κB: Nuclear factor-κB; ADM: Adriamycin.
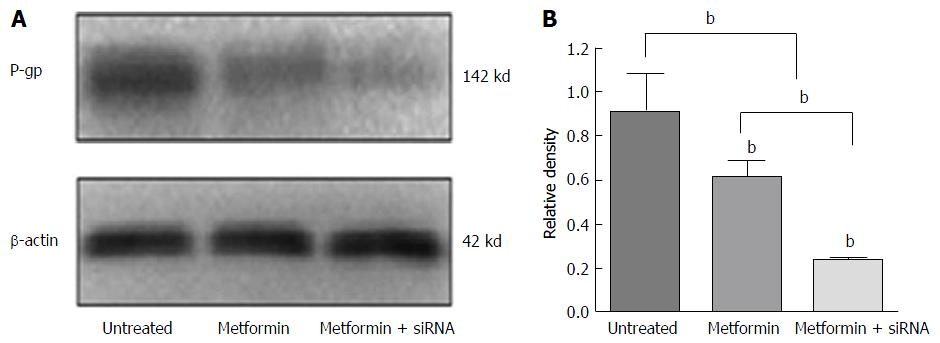
Figure 4 Alteration of P-glycoprotein expression in cells treated with metformin plus nuclear factor-κB-small interference RNA.
A: Alteration of P-gp expression in different groups of cells. A significant decrease of P-gp expression analyzed by Western blot was found in HepG2/ADM cells treated with the metformin plus NF-κB-siRNA; B: The gray intensity images of Figure 4A. bP < 0.01 vs the blank group (n = 3, mean ± SD). P-gp: P-glycoprotein; NF-κB: Nuclear factor-κB; ADM: Adriamycin; siRNA: Small interference RNA.
- Citation: Wu W, Yang JL, Wang YL, Wang H, Yao M, Wang L, Gu JJ, Cai Y, Shi Y, Yao DF. Reversal of multidrug resistance of hepatocellular carcinoma cells by metformin through inhibiting NF-κB gene transcription. World J Hepatol 2016; 8(23): 985-993
- URL: https://www.wjgnet.com/1948-5182/full/v8/i23/985.htm
- DOI: https://dx.doi.org/10.4254/wjh.v8.i23.985


