Copyright
©The Author(s) 2015.
World J Hepatol. Jun 8, 2015; 7(10): 1337-1346
Published online Jun 8, 2015. doi: 10.4254/wjh.v7.i10.1337
Published online Jun 8, 2015. doi: 10.4254/wjh.v7.i10.1337
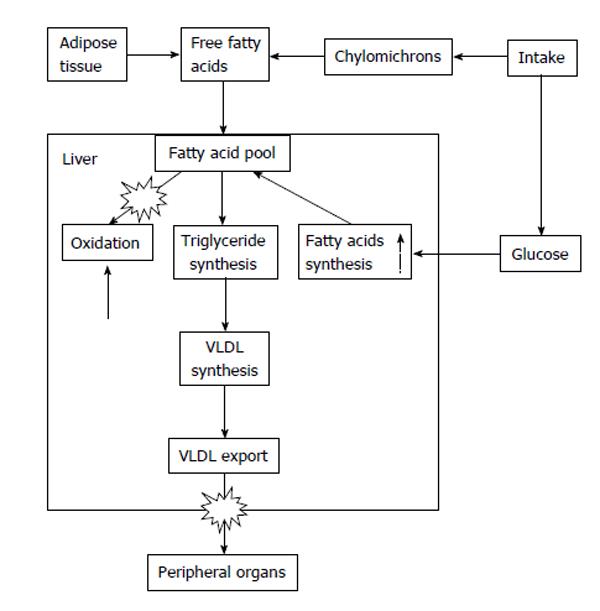
Figure 1 Simplified schematic pathway of lipid metabolism.
The symbol corresponds to the points at which hepatitis C virus (HCV) blocks lipid metabolism, and the dotted arrows the point at which HCV enhances it. VLDL: Very low density lipoprotein.
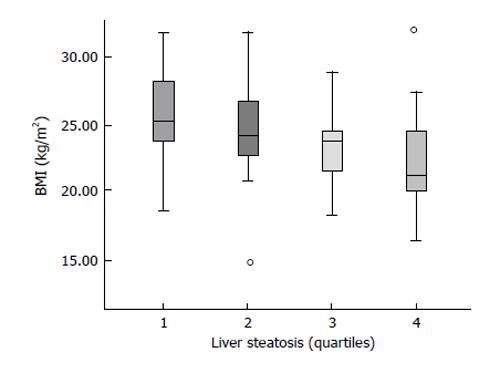
Figure 2 Preliminary data on 83 patients with hepatitis C virus infection.
Liver steatosis was histomorphometrically assessed. In this figure, it is shown that the amount of liver steatosis (in quartiles) is related to body mass index.
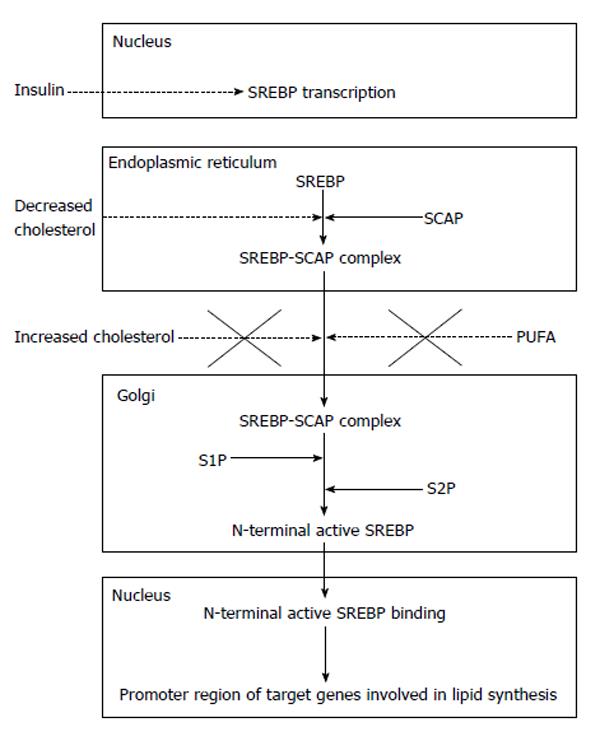
Figure 3 Simplified representation of the effect of steroid response element binding protein on lipid synthesis.
Insulin promotes transcription of steroid response element binding protein (SREBP). In the endoplasmic reticulum, SREBP binds to SREBP cleavage-activating protein, a complex which moves to the Golgi apparatus, where the active N-terminal form of SREBP is formed by the sequential action of two proteases (S1P and S2P), and is finally translocated to the nucleus. SCAP: SREBP cleavage-activating protein; PUFA: Polyunsaturated fatty acid.
- Citation: González-Reimers E, Quintero-Platt G, Rodríguez-Gaspar M, Alemán-Valls R, Pérez-Hernández O, Santolaria-Fernández F. Liver steatosis in hepatitis C patients. World J Hepatol 2015; 7(10): 1337-1346
- URL: https://www.wjgnet.com/1948-5182/full/v7/i10/1337.htm
- DOI: https://dx.doi.org/10.4254/wjh.v7.i10.1337


