Copyright
©2013 Baishideng Publishing Group Co.
World J Hepatol. Oct 27, 2013; 5(10): 558-567
Published online Oct 27, 2013. doi: 10.4254/wjh.v5.i10.558
Published online Oct 27, 2013. doi: 10.4254/wjh.v5.i10.558
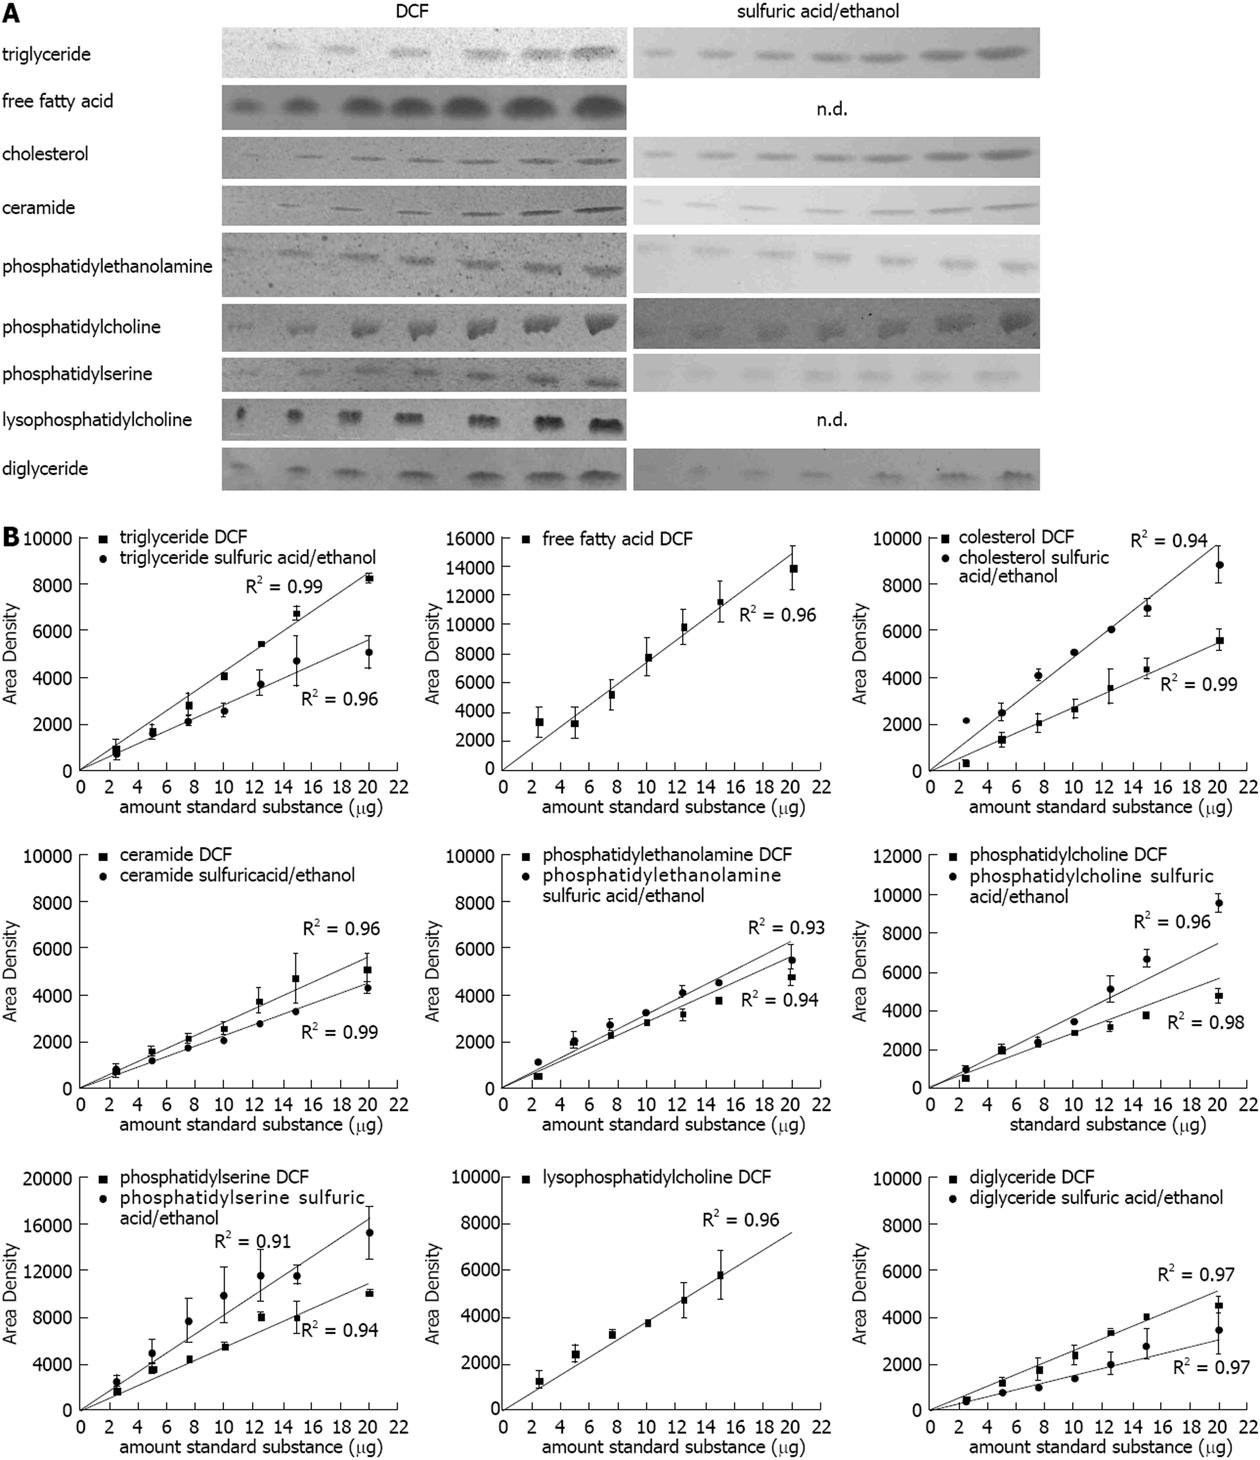
Figure 1 Quantification of lipids on the thin layer chromatography plate.
A: Representative lipid dilution series (range: 2.5, 5, 7.5, 10, 12.5, 15, 20 μg) detected with 2’,7’-dichlorofluorescein (DCF) or sulfuric acid/ethanol; B: Quantification of the standard dilution series detected with DCF or sulfuric acid/ethanol and quantified with ImageJ. Results represent the mean ± SE from at least two independent thin layer chromatography plates. FFA: Free fatty acids.
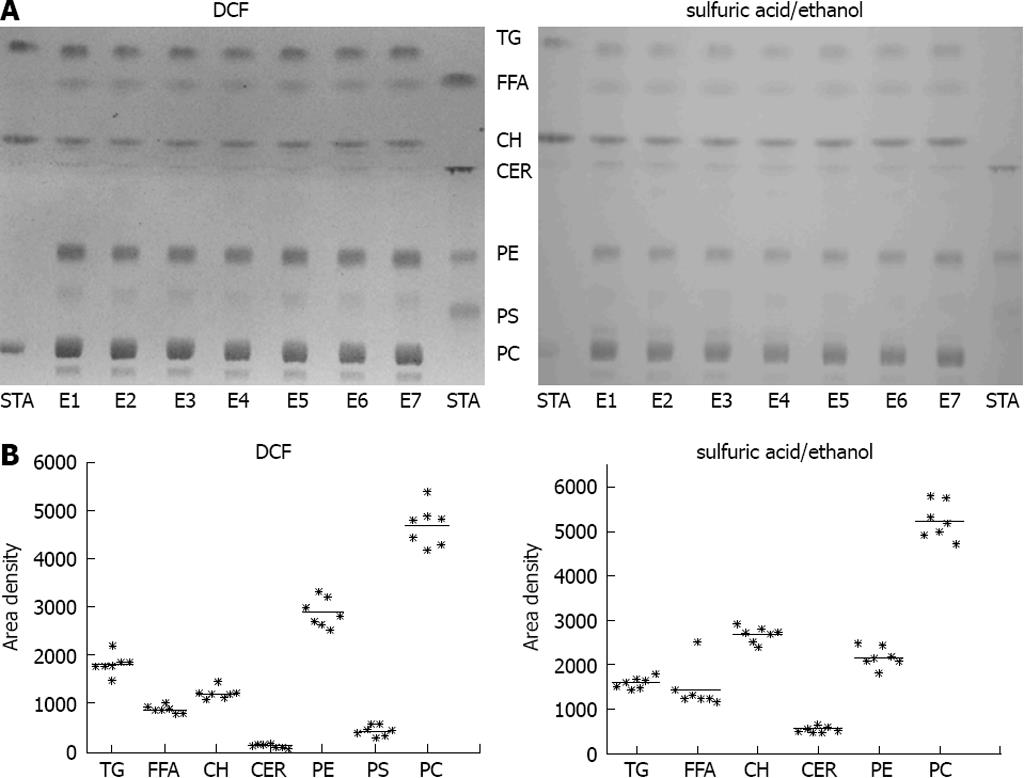
Figure 2 Validation of the lipid extraction procedure.
A: Freeze-dried bovine liver was extracted in seven independent extraction procedures (E1-E7). STA: Standard substances co-chromatographed with the samples. left: detection with 2’,7’-dichlorofluorescein (DCF); right: detection with sulfuric acid/ethanol; B: Quantification of thin layer chromatography (TLC) with ImageJ detected with DCF (left) or sulfuric acid/ethanol (right).
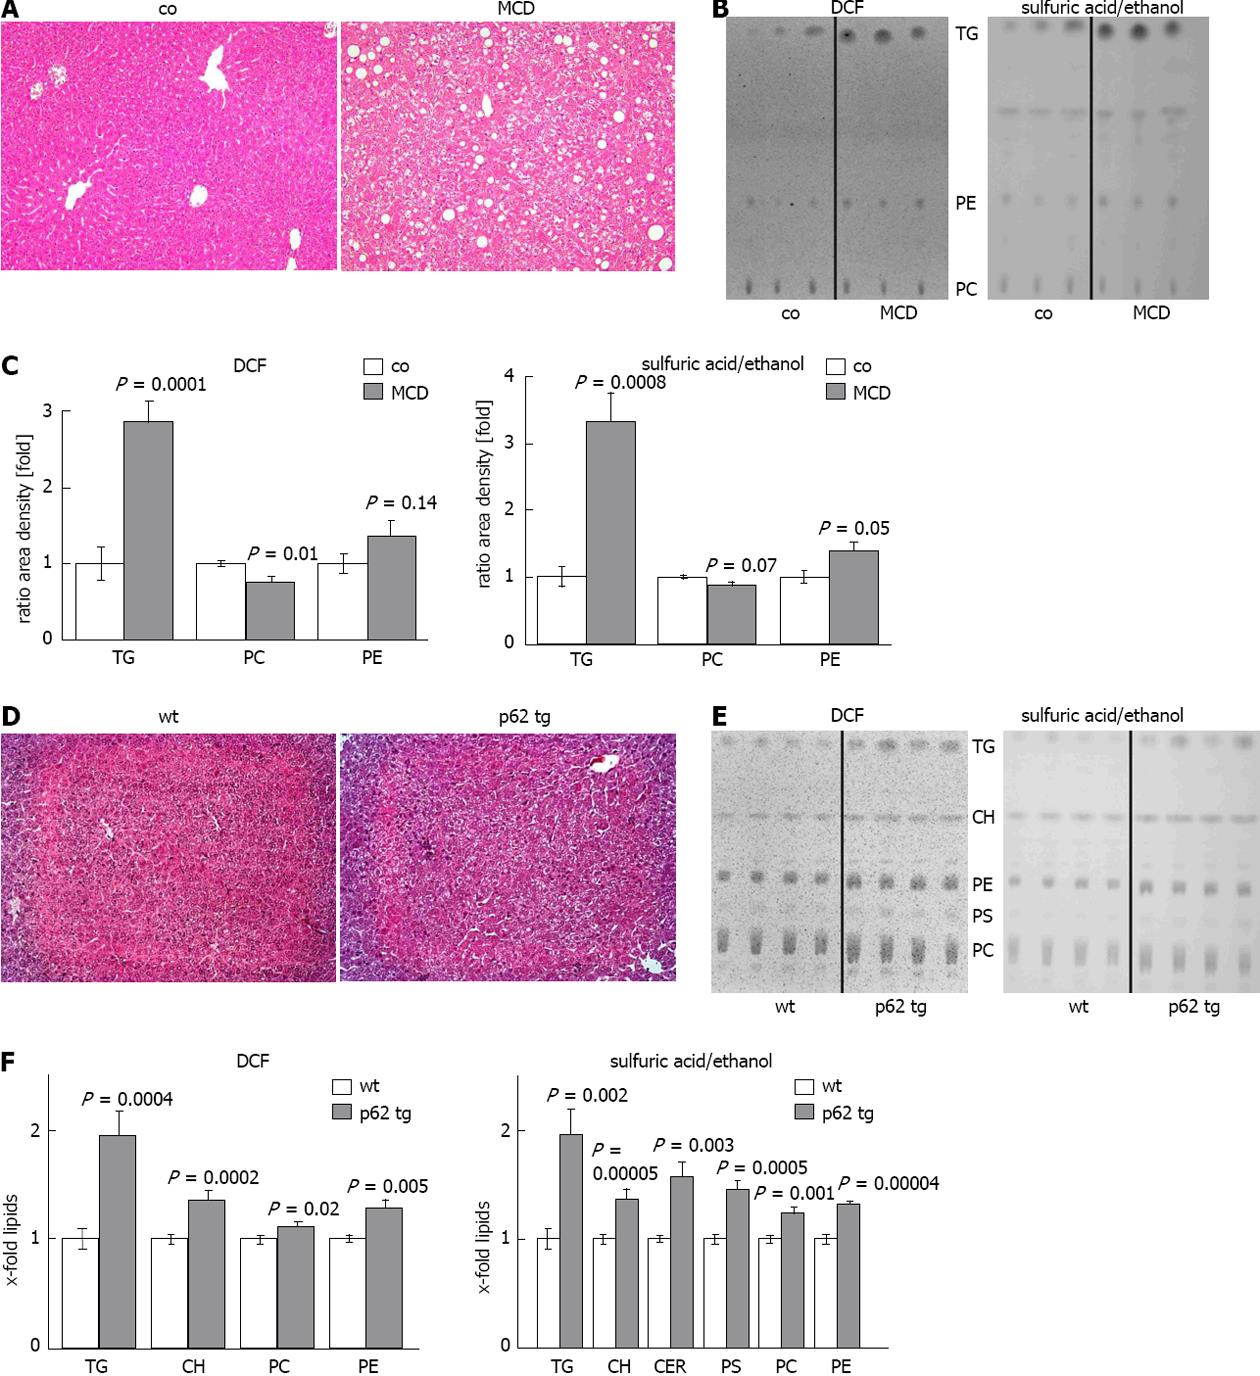
Figure 3 Lipid quantification in different mouse models.
A: Representative hematoxylin eosin (HE) staining of control (co) or methionine choline deficient diet (MCD) fed mice (× 200); B: Representative thin layer chromatography (TLC) detected with 2’,7’-dichlorofluorescein (DCF) (left) or sulfuric acid/ethanol (right); C: Quantification of TLC with ImageJ, detected with DCF (left) or sulfuric acid/ethanol (right). Results represent the mean ± SE from at least two independent TLC plates with n = 7 in each group; D: representative HE staining of wildtype (wt) and p62 transgenic mice (p62 tg)(× 200); E: Representative TLC detected with DCF (left) or sulfuric acid/ethanol (right); F: Quantification of TLC with ImageJ detected with DCF (left) or sulfuric acid/ethanol (right). Results represent the mean ± SE from at least two independent TLC plates and n = 4 in each group.
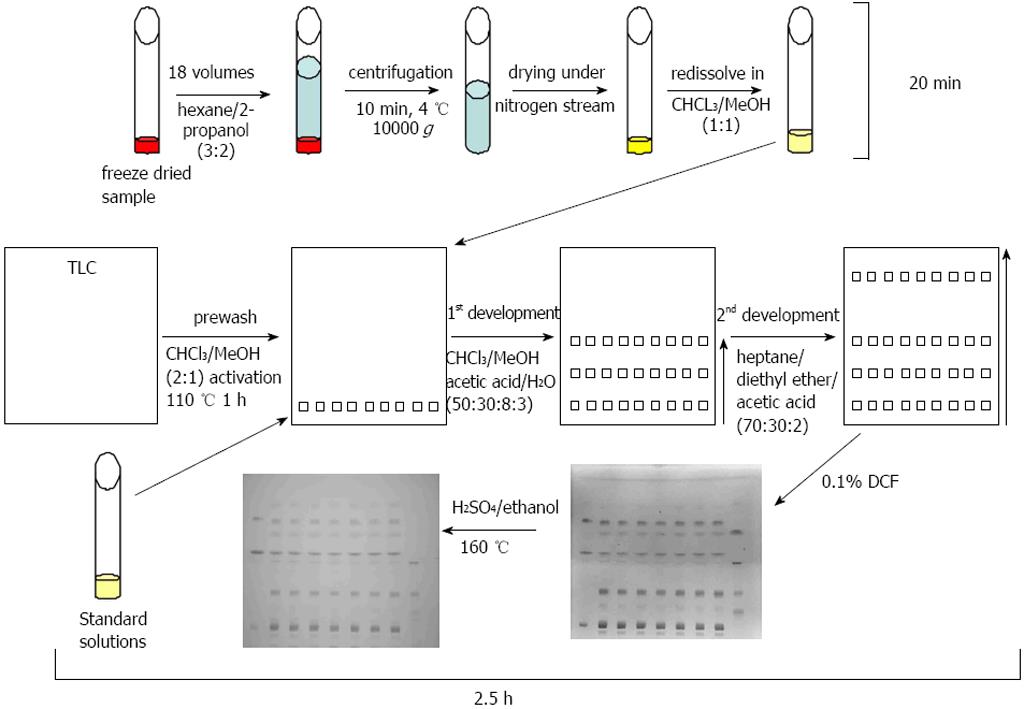
Figure 4 Thin layer chromatography method.
Samples were freeze-dried, extracted, centrifuged, and the supernatant was transferred to a new vessel and dried under gaseous nitrogen. In the meantime plates were prewashed and activated. Standard solutions and samples were subjected to the prewashed and activated thin layer chromatography (TLC) plates and developed with the first eluant system to half of the plate. After drying the TLC plate was subjected to a second eluant system in the same direction up to the top of the plate. After drying of the plates, lipids were visualised with 2’,7’-dichlorofluorescein (DCF) and afterwards with sulfuric acid/ethanol and heating to 160 °C.
- Citation: Laggai S, Simon Y, Ranssweiler T, Kiemer AK, Kessler SM. Rapid chromatographic method to decipher distinct alterations in lipid classes in NAFLD/NASH. World J Hepatol 2013; 5(10): 558-567
- URL: https://www.wjgnet.com/1948-5182/full/v5/i10/558.htm
- DOI: https://dx.doi.org/10.4254/wjh.v5.i10.558


