Copyright
©The Author(s) 2025.
World J Hepatol. Jun 27, 2025; 17(6): 105332
Published online Jun 27, 2025. doi: 10.4254/wjh.v17.i6.105332
Published online Jun 27, 2025. doi: 10.4254/wjh.v17.i6.105332
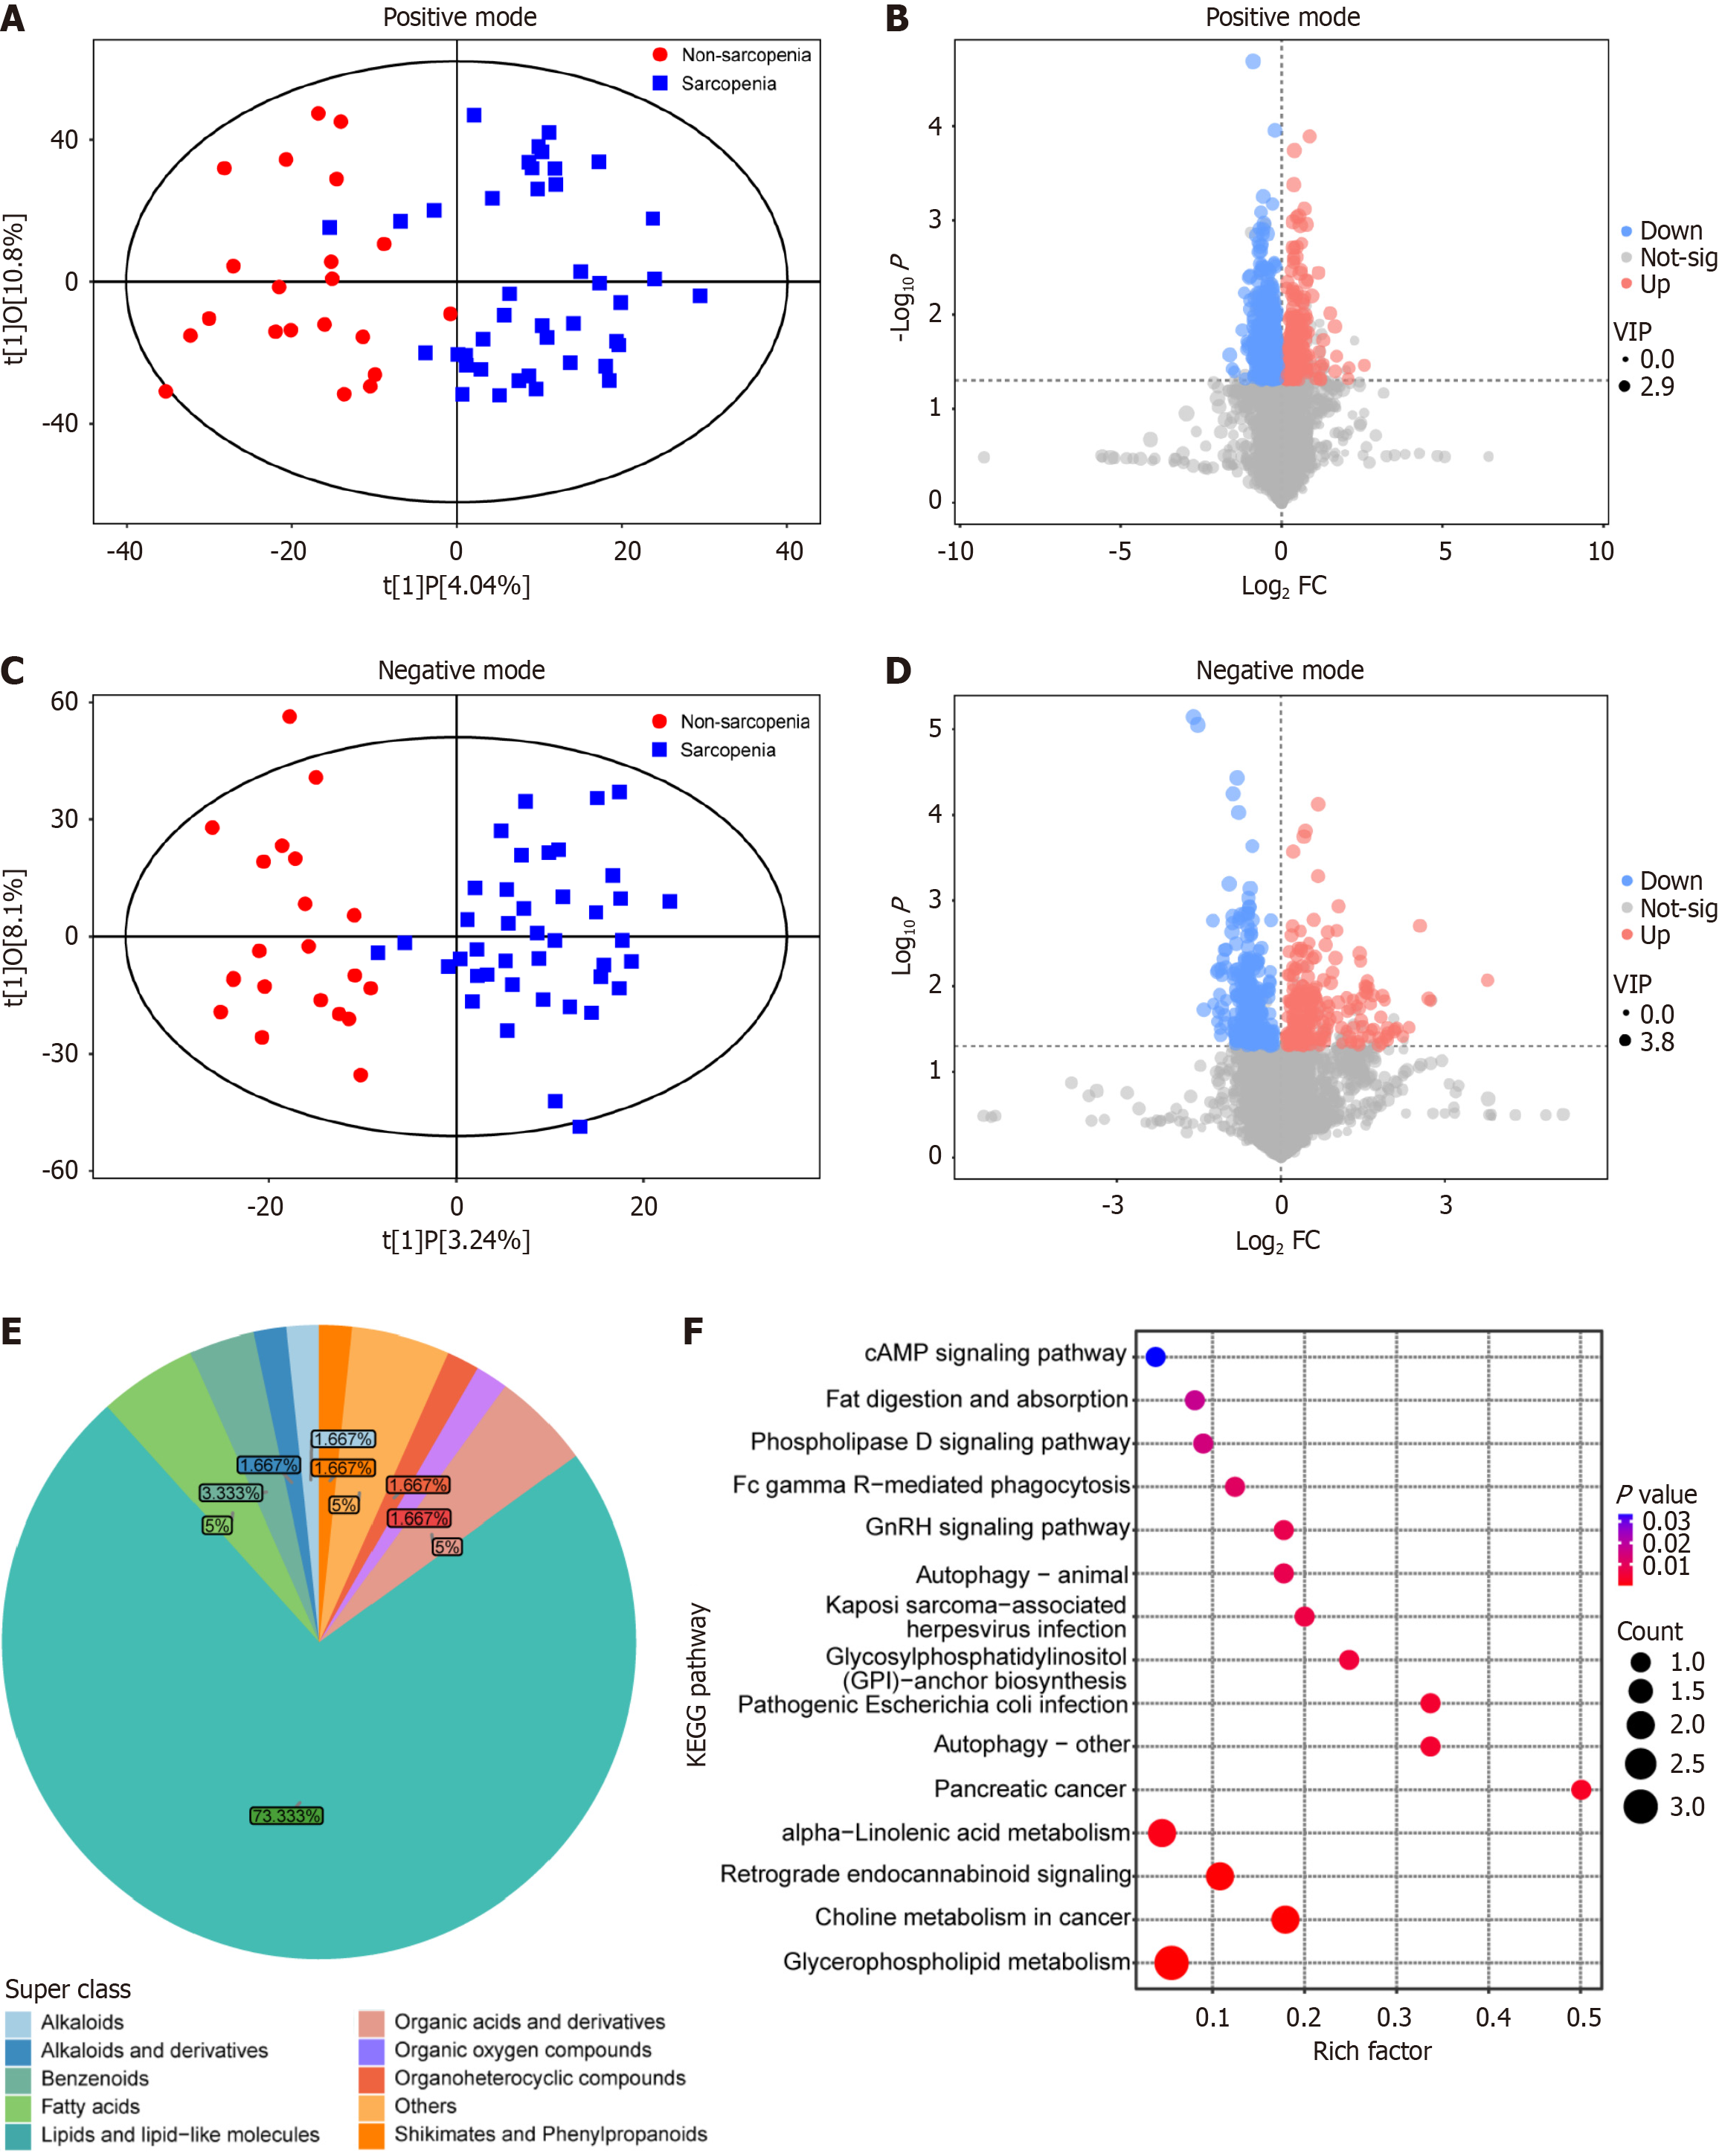
Figure 1 Analysis of serum metabolic profiling between sarcopenic and non-sarcopenic cirrhotic patients.
A: Orthogonal partial least squares discriminant analysis (OPLS-DA) of metabolites in positive mode; B: Volcano plot of metabolites by univariate analysis in positive mode; C: OPLS-DA of metabolites in negative mode; D: Volcano plot of metabolites by univariate analysis in negative mode; E: Metabolite classes with significantly different concentrations between sarcopenic and non-sarcopenic cirrhotic patients; F: Enriched metabolic pathways of differential metabolites. VIP: Variable importance in the projection.
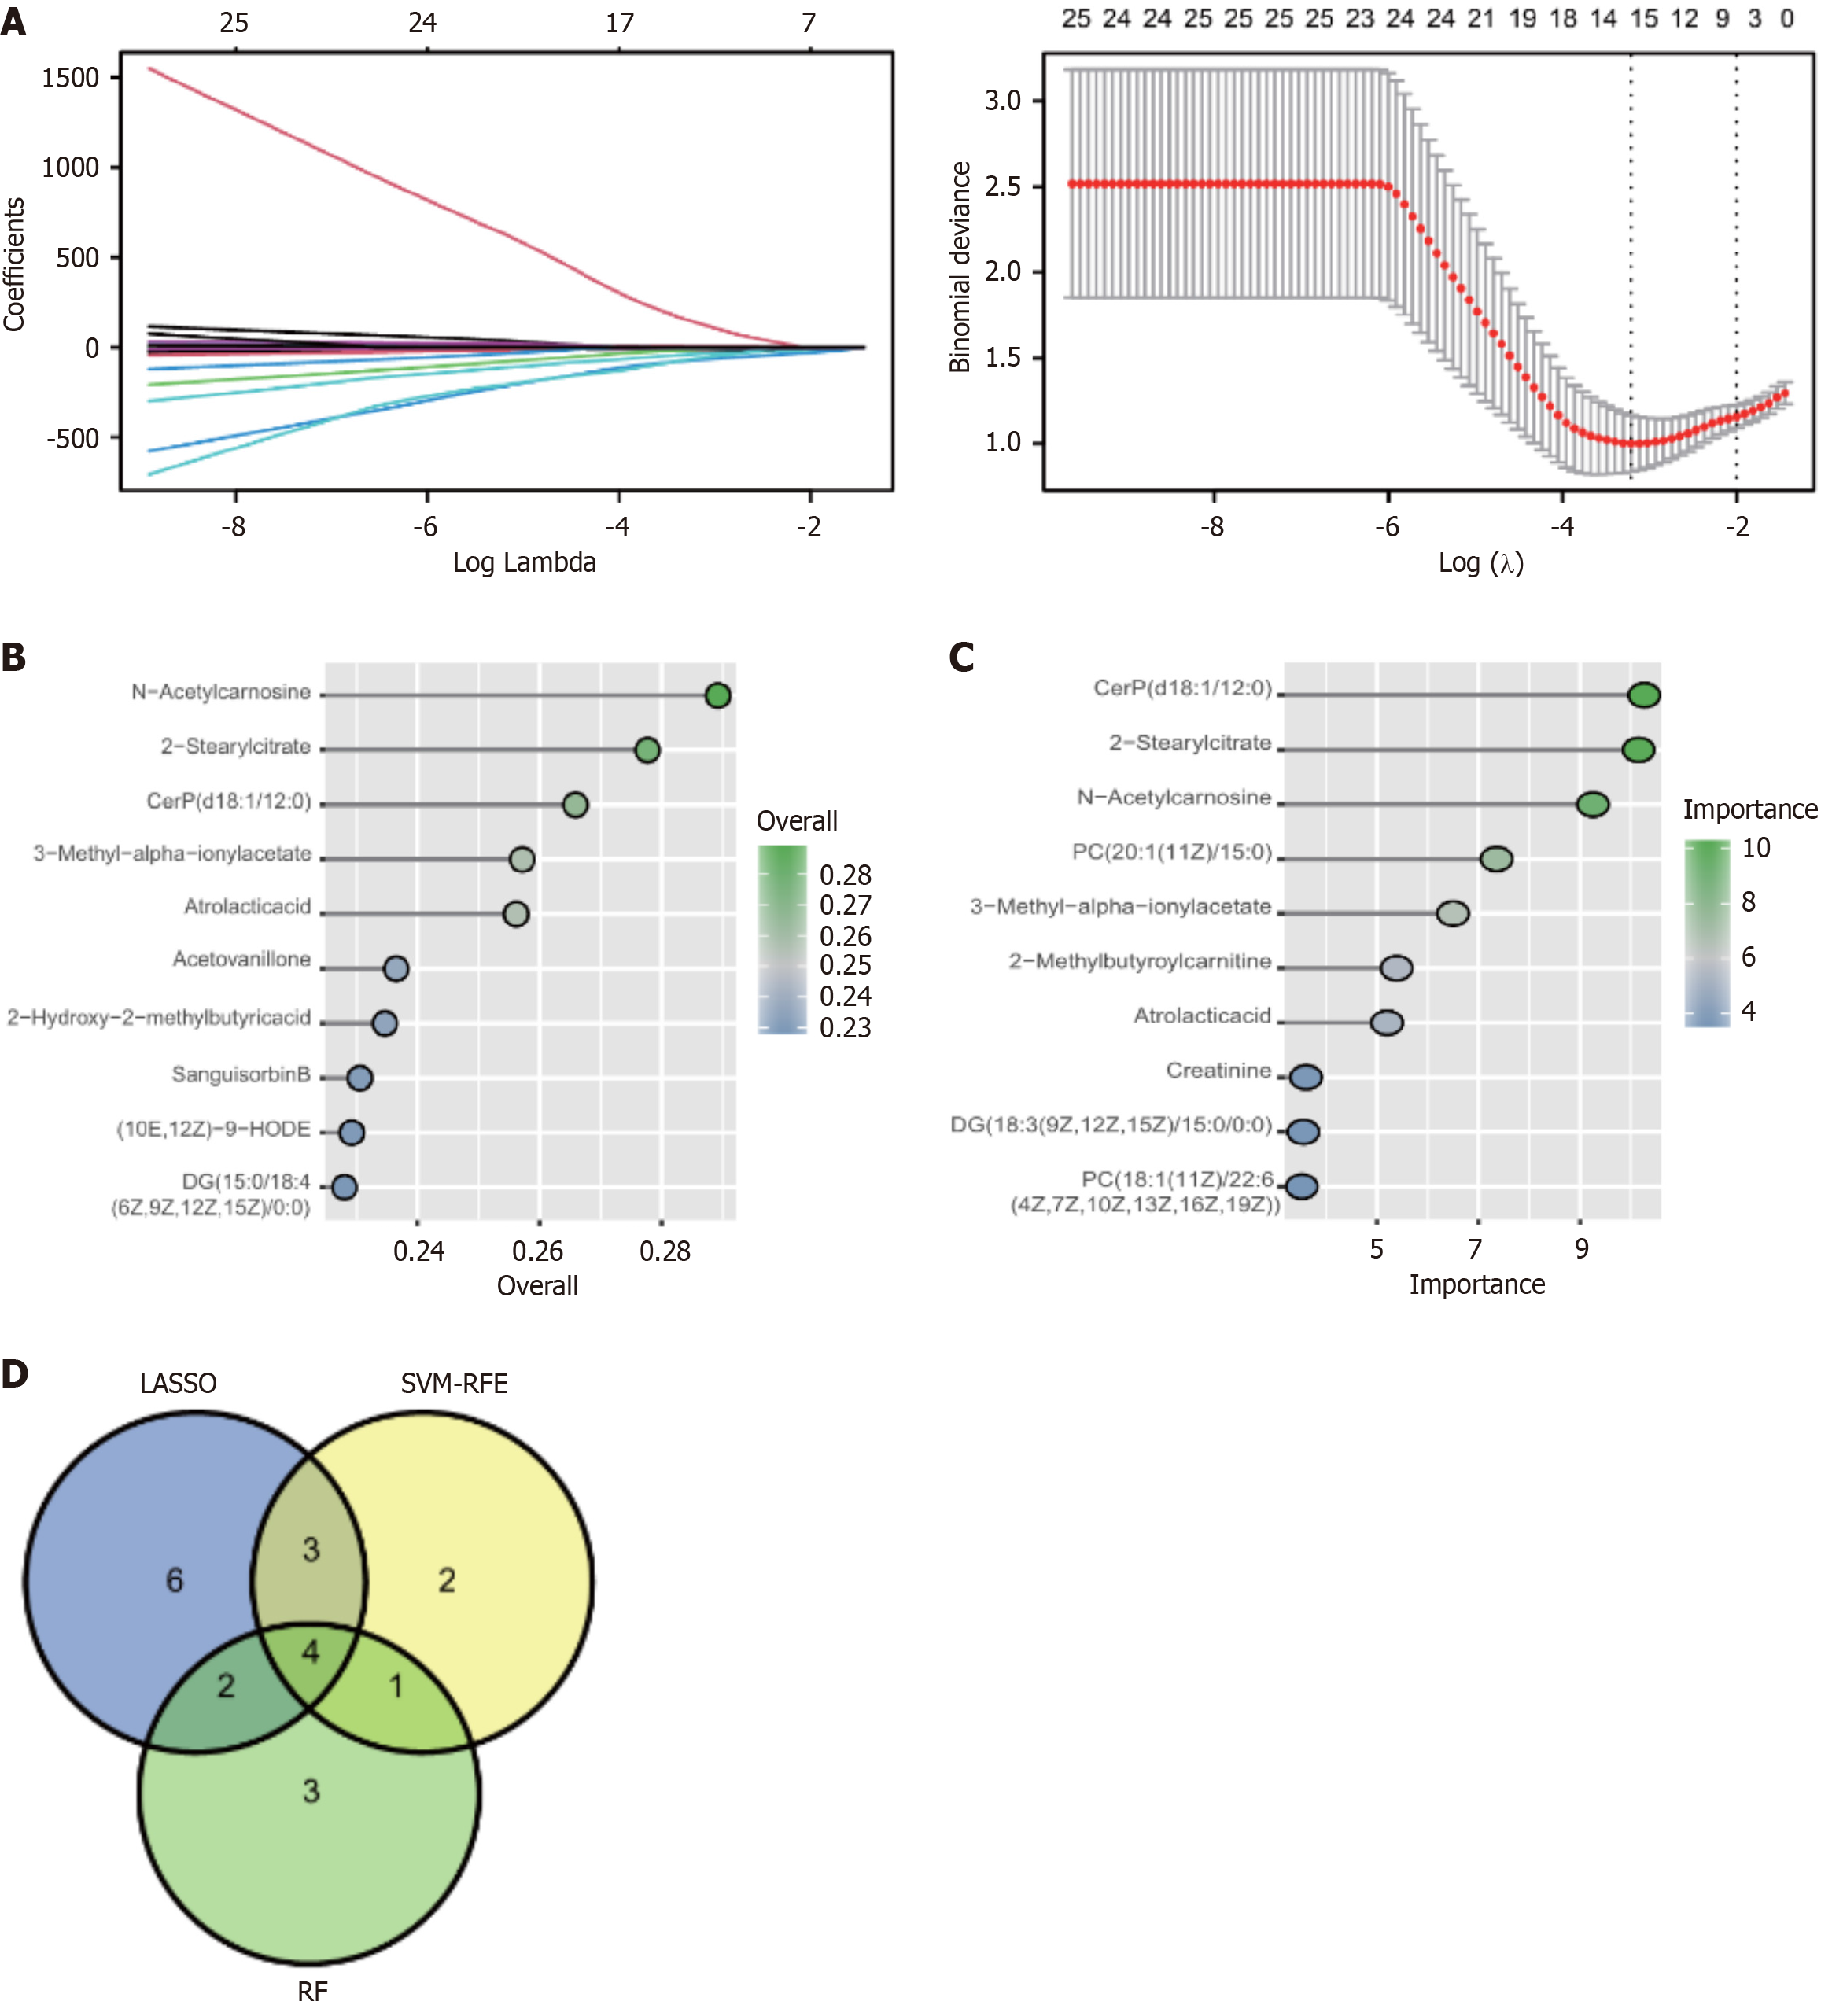
Figure 2 Screening of candidate diagnostic biomarkers in sarcopenic cirrhotic patients.
A: Coefficient profile plot of the Least Absolute Shrinkage and Selection Operator model for cirrhotic patients with sarcopenia showed the final parameter selection l (lambda); B: Top-10 biomarkers based on their discriminant ability in the Support Vector Machine-Recursive Feature Elimination algorithm; C: Top-10 biomarkers selected by using the random forest algorithm; D: The Venn diagram for four candidate metabolic biomarkers in sarcopenic cirrhotic patients by intersecting the results of three algorithms. LASSO: Least Absolute Shrinkage and Selection Operator; RF: Random Forest; SVM-RFE: Support Vector Machine-Recursive Feature Elimination.
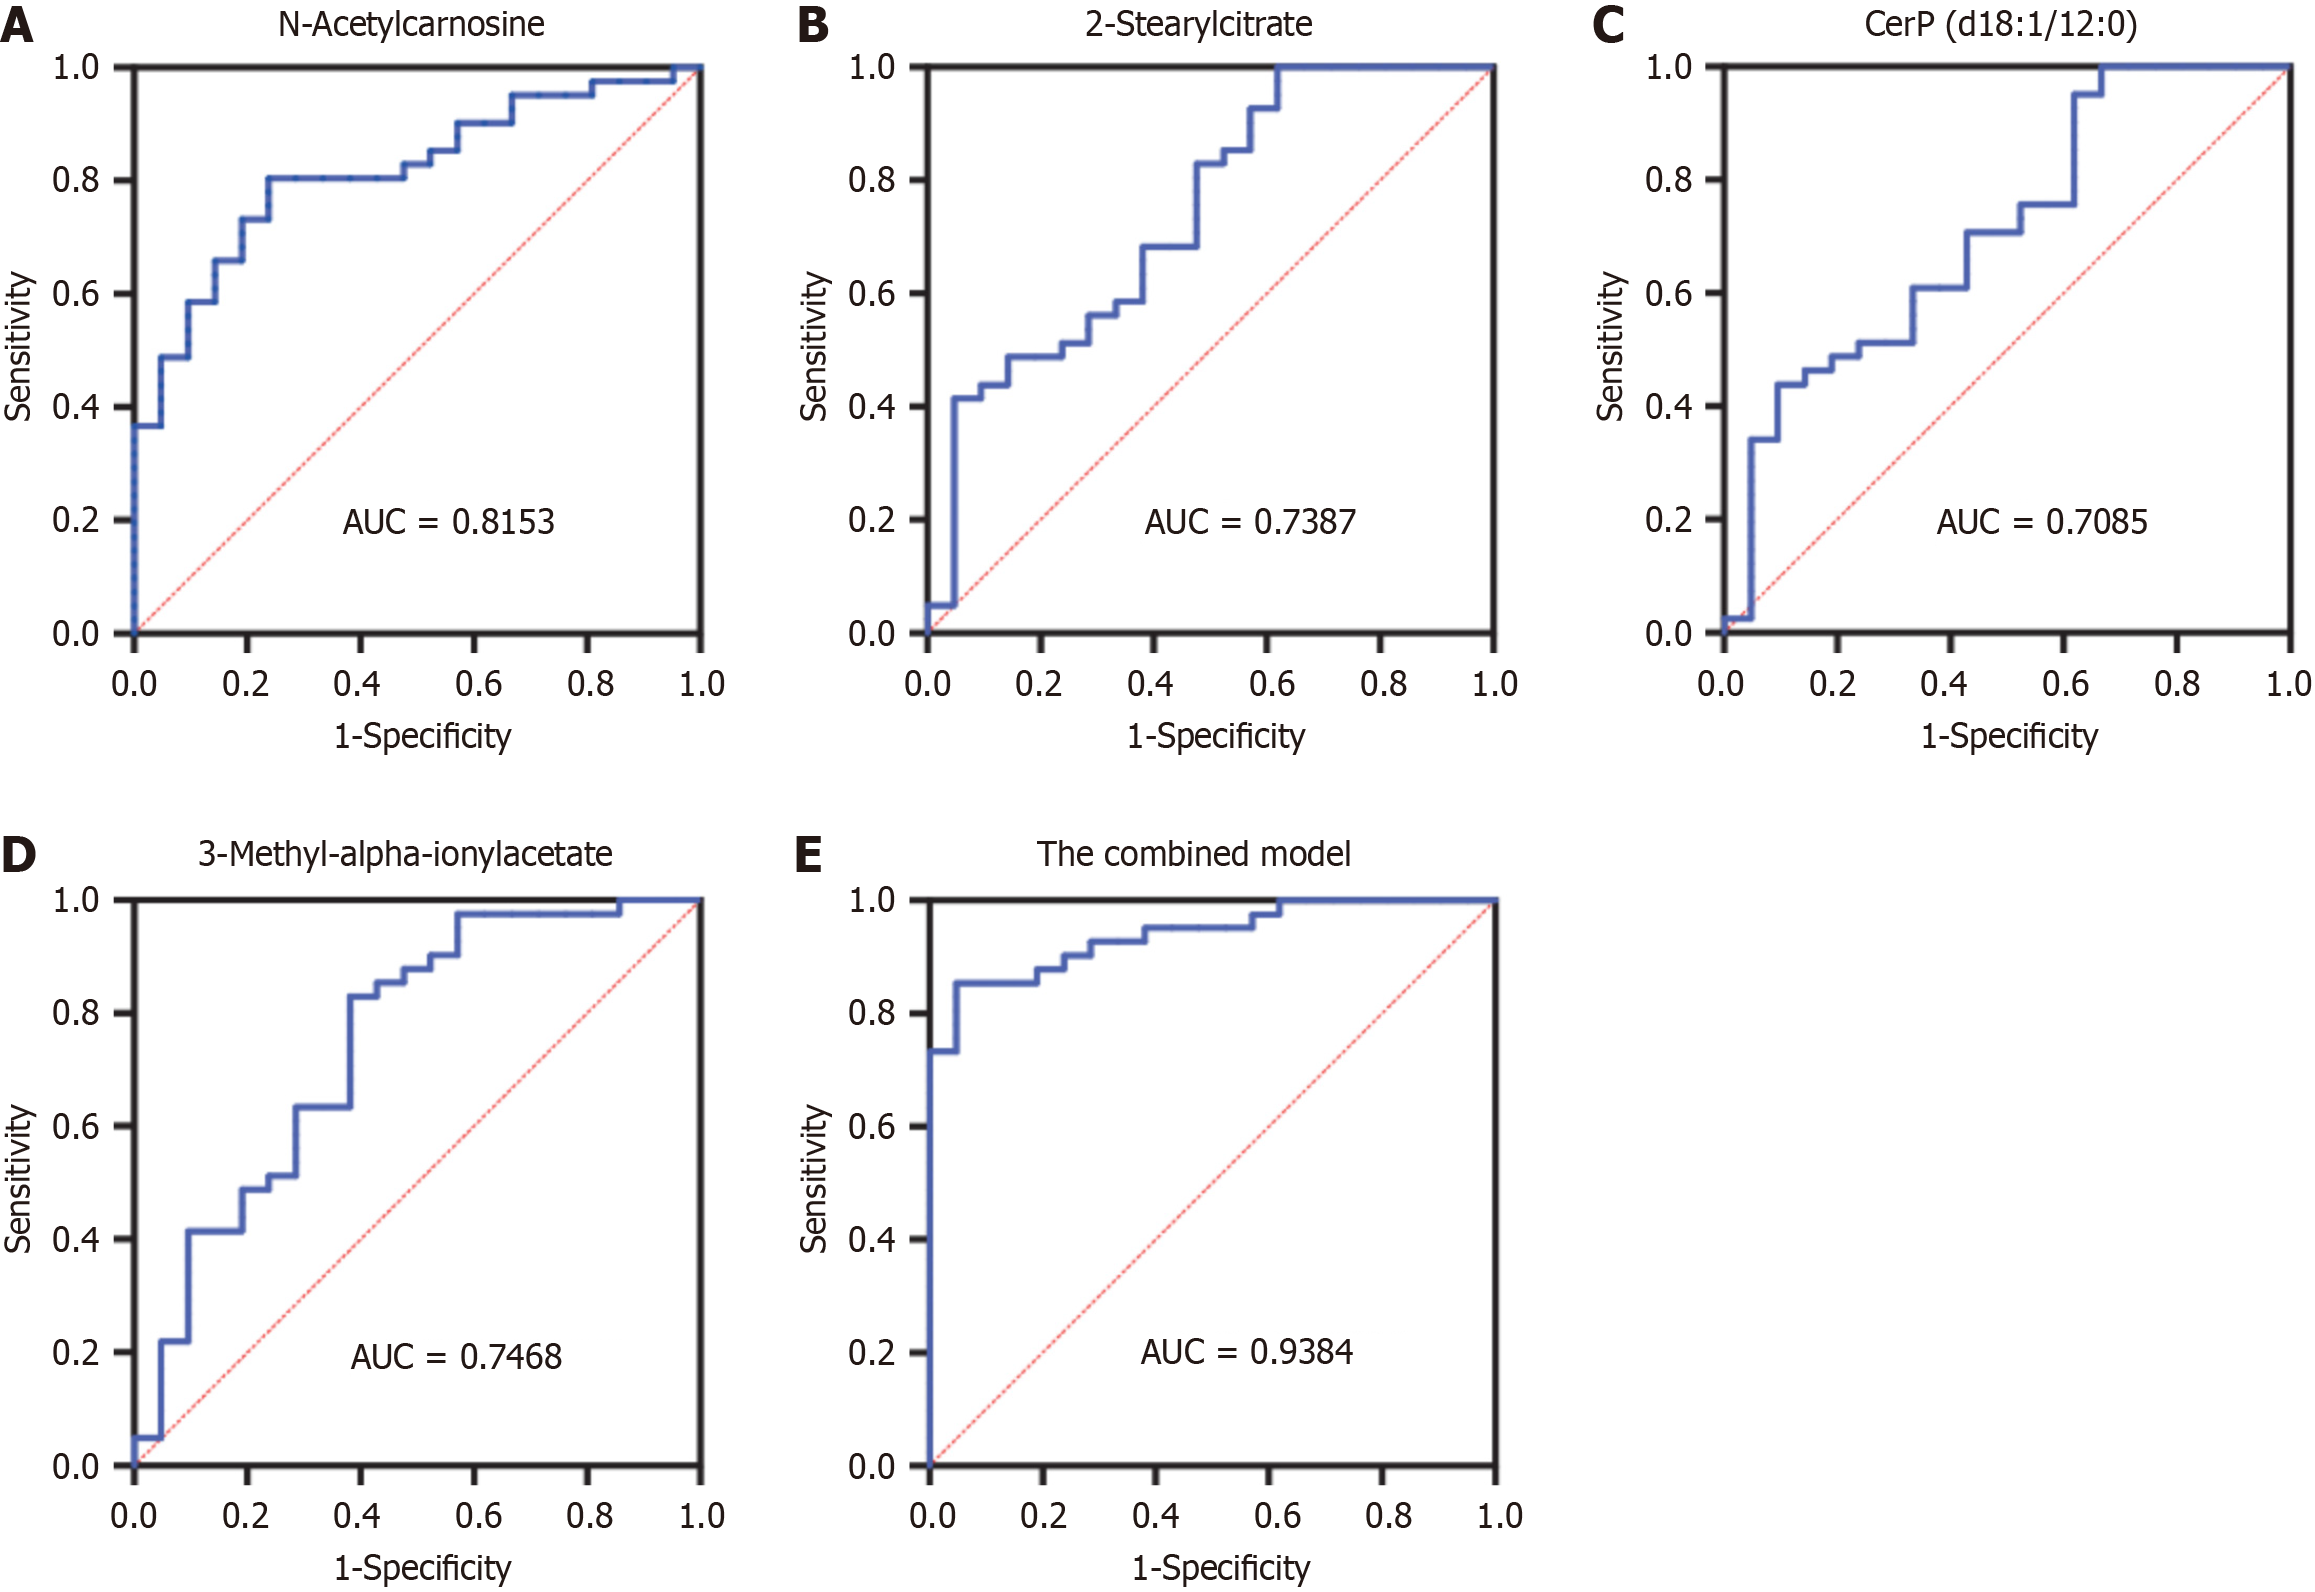
Figure 3 Receiver operating characteristic analysis of potential biomarkers for differentiating cirrhotic patients with or without sarcopenia.
A: N-Acetylcarnosine with an area under the receiver operating characteristic curve (AUC) of 0.8153 (95%CI: 0.7094–0.9213, P < 0.0001); B: 2-Stearylcitrate with an AUC of 0.7387 (95%CI: 0.6046–0.8728, P = 0.0022); C: CerP (d18:1/12:0) with an AUC of 0.7085 (95%CI: 0.57–0.8469, P = 0.0076); D: 3-Methyl-alpha-ionylacetate with an AUC value of 0.7468 (95%CI: 0.6099–0.8838, P = 0.0016); E: The combined model of four metabolites with an AUC of 0.9384.
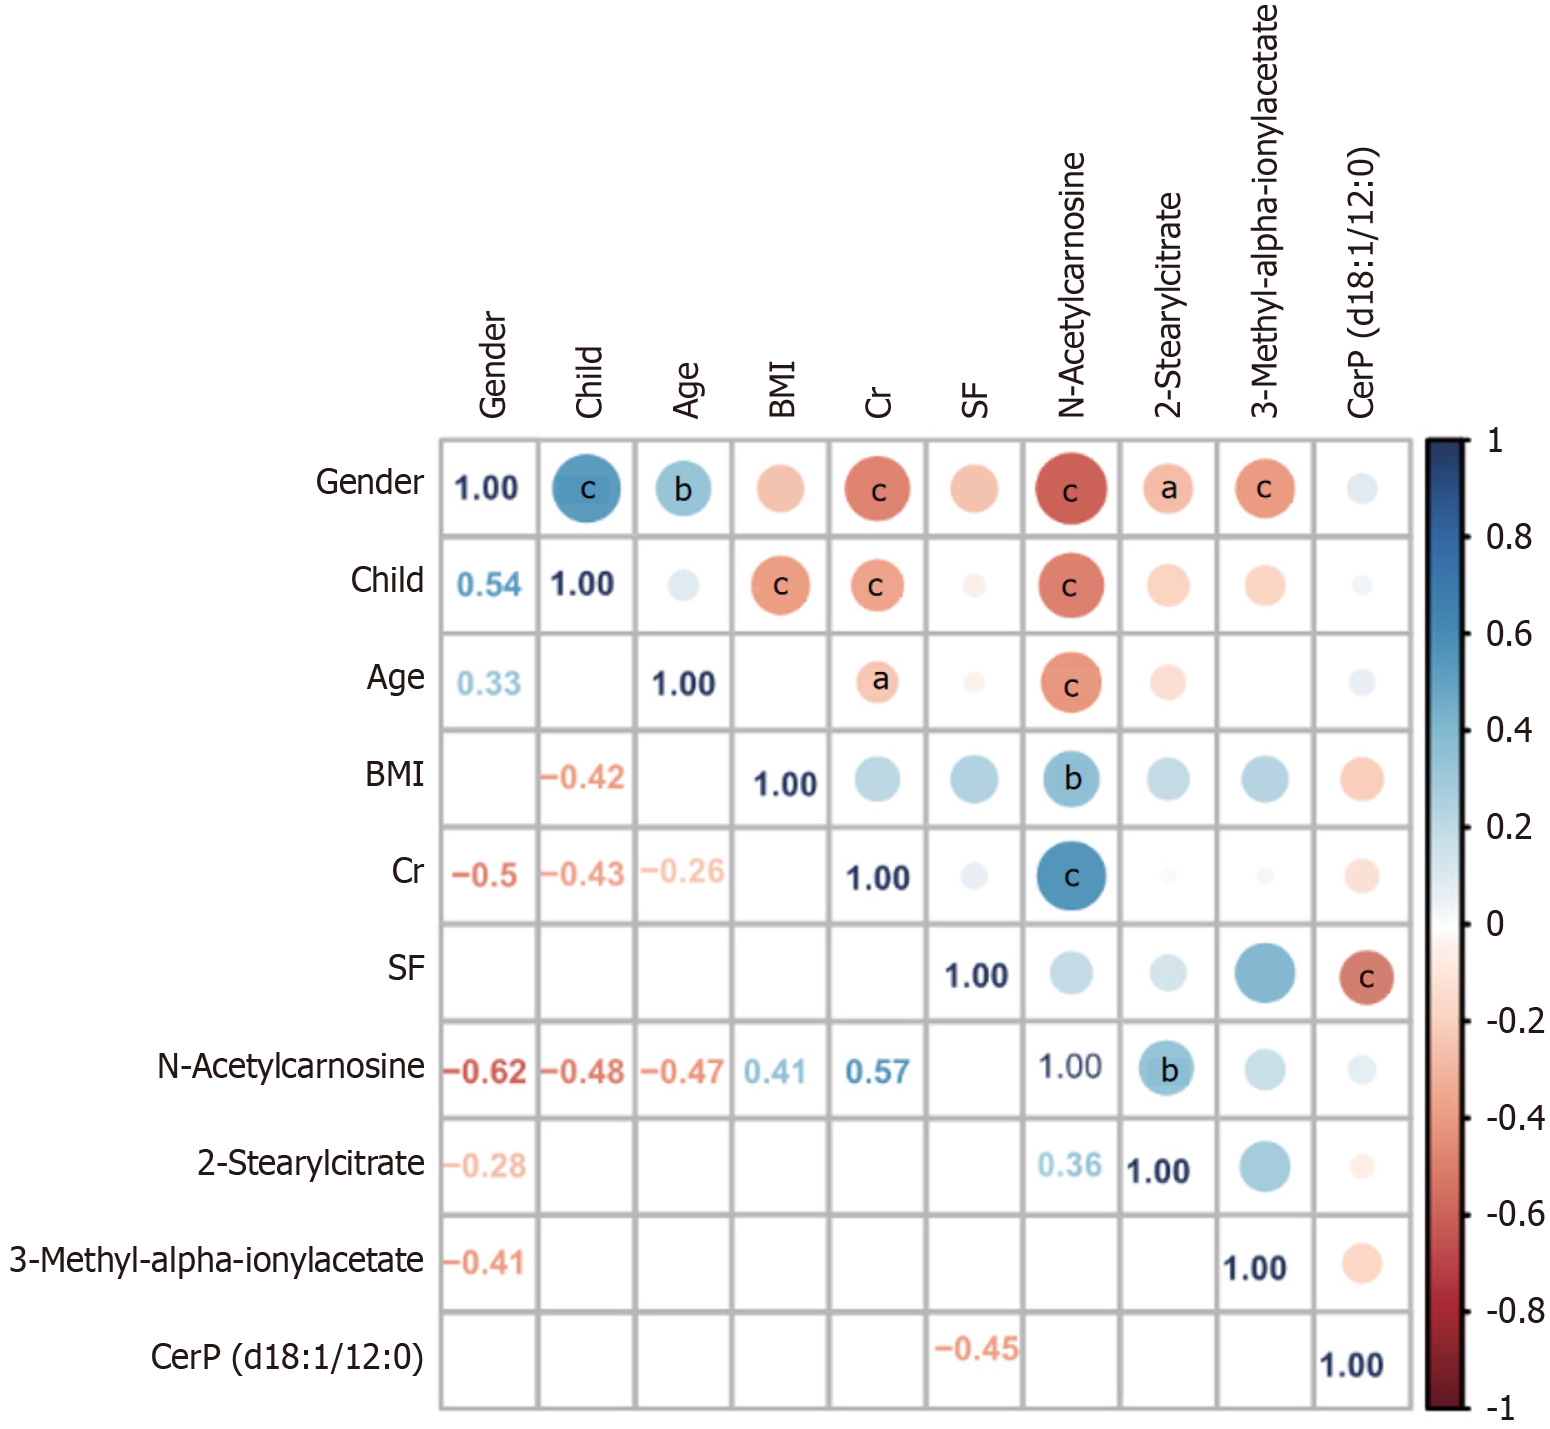
Figure 4 Heatmap of the Spearman correlation coefficient matrix between selected metabolites and clinical variables.
Red and blue indicate negative and positive correlations, respectively. Empty cells indicate non-significant correlations (P values > 0.05). aP < 0.05, bP < 0.01, cP < 0.001. BMI: Body mass index; Cr: Creatinine; SF: Serum ferritin.
- Citation: Liang QY, Wang J, Yang YF, Zhao K, Luo RL, Tian Y, Li FX. Machine learning to identify potential biomarkers for sarcopenia in liver cirrhosis. World J Hepatol 2025; 17(6): 105332
- URL: https://www.wjgnet.com/1948-5182/full/v17/i6/105332.htm
- DOI: https://dx.doi.org/10.4254/wjh.v17.i6.105332


