Copyright
©The Author(s) 2025.
World J Hepatol. Jun 27, 2025; 17(6): 105332
Published online Jun 27, 2025. doi: 10.4254/wjh.v17.i6.105332
Published online Jun 27, 2025. doi: 10.4254/wjh.v17.i6.105332
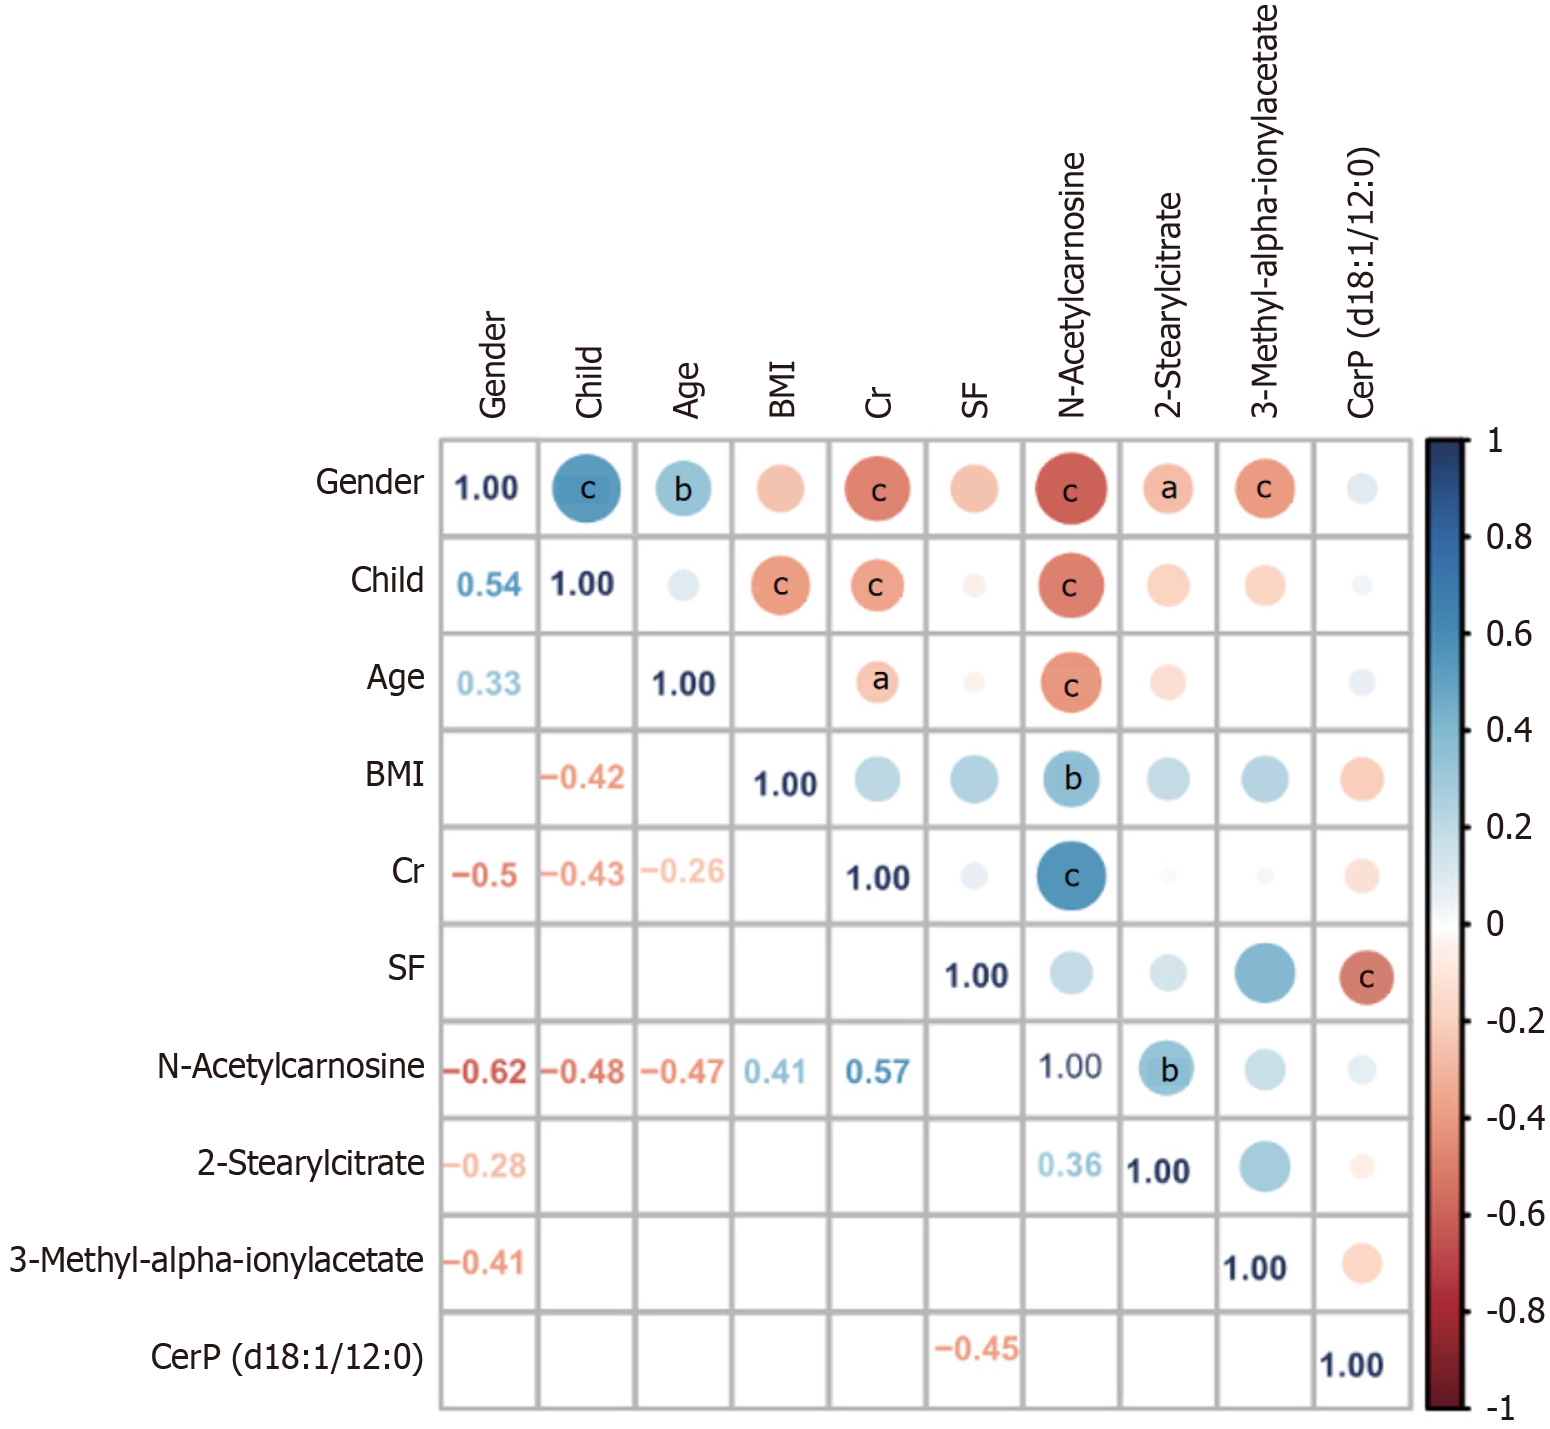
Figure 4 Heatmap of the Spearman correlation coefficient matrix between selected metabolites and clinical variables.
Red and blue indicate negative and positive correlations, respectively. Empty cells indicate non-significant correlations (P values > 0.05). aP < 0.05, bP < 0.01, cP < 0.001. BMI: Body mass index; Cr: Creatinine; SF: Serum ferritin.
- Citation: Liang QY, Wang J, Yang YF, Zhao K, Luo RL, Tian Y, Li FX. Machine learning to identify potential biomarkers for sarcopenia in liver cirrhosis. World J Hepatol 2025; 17(6): 105332
- URL: https://www.wjgnet.com/1948-5182/full/v17/i6/105332.htm
- DOI: https://dx.doi.org/10.4254/wjh.v17.i6.105332


