Copyright
©The Author(s) 2022.
World J Hepatol. Dec 27, 2022; 14(12): 1997-2011
Published online Dec 27, 2022. doi: 10.4254/wjh.v14.i12.1997
Published online Dec 27, 2022. doi: 10.4254/wjh.v14.i12.1997
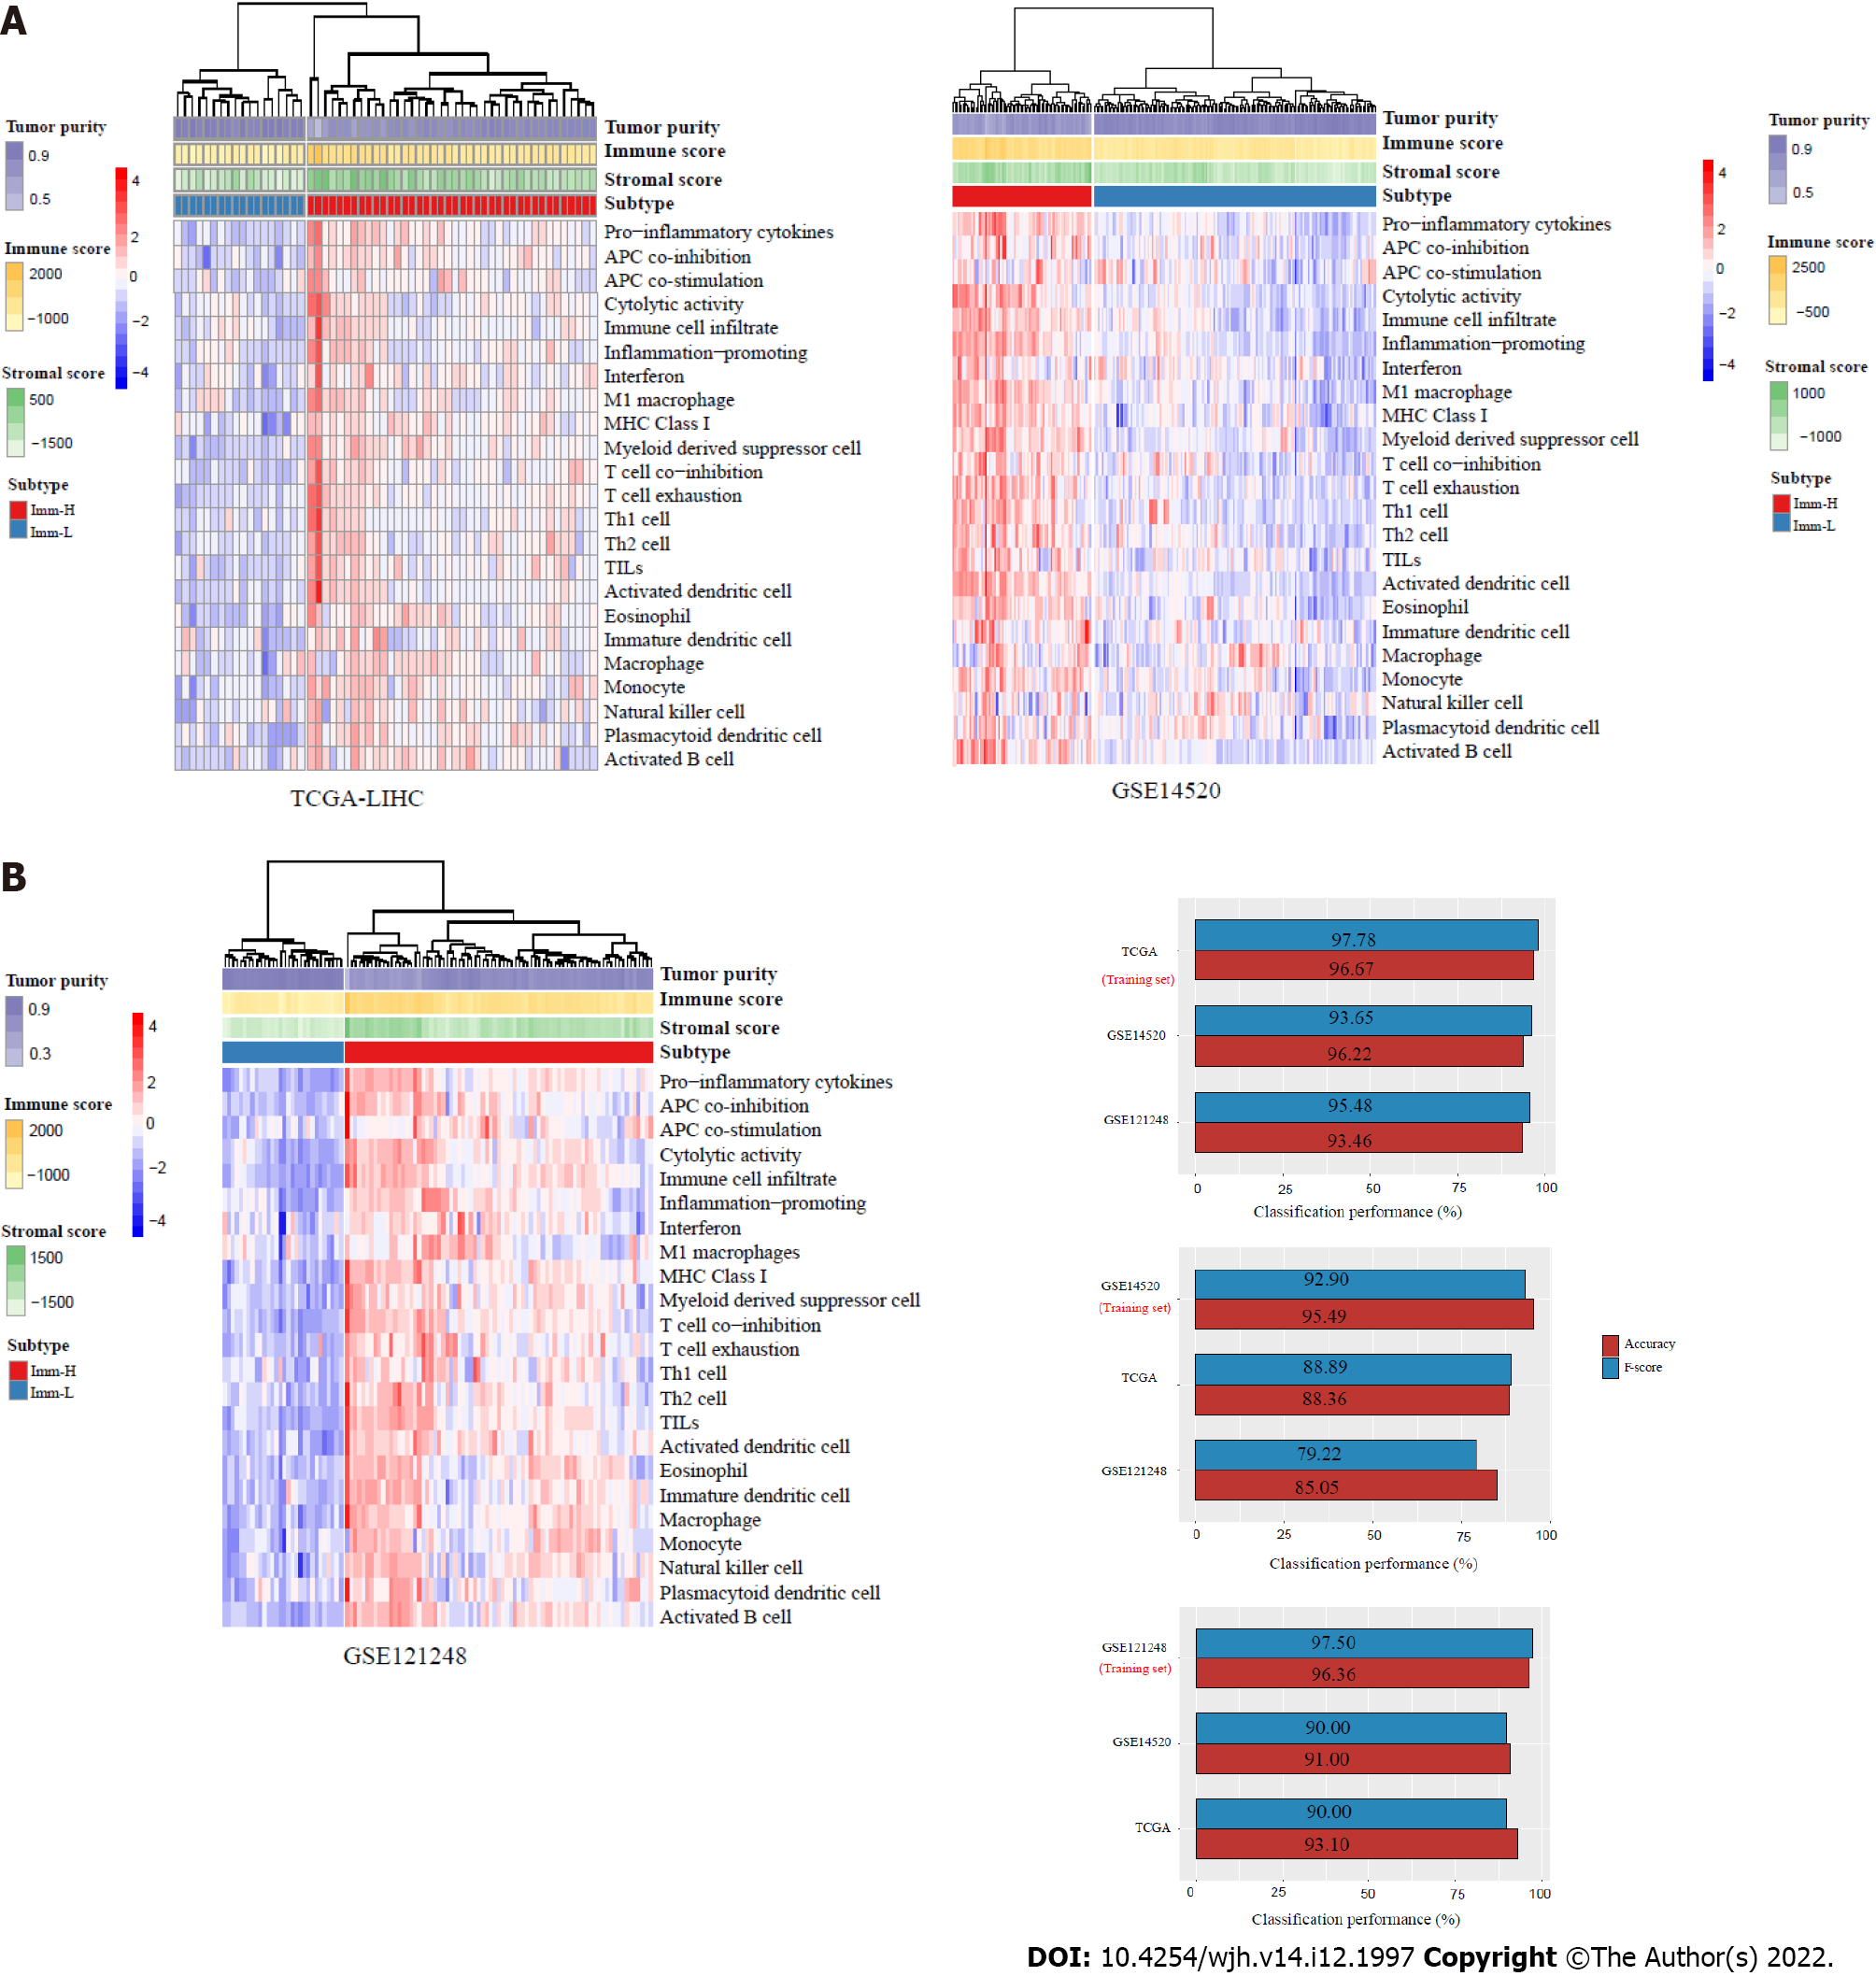
Figure 1 Identification of immune-specific subtypes of hepatitis B virus + hepatocellular carcinoma by clustering analysis.
A: Based on the enrichment scores of 23 immune signatures, hierarchical clustering identifies two immune-specific subtypes of hepatitis B virus (HBV) + hepatocellular carcinoma (HCC): Imm-H and Imm-L, with high and low immunity, respectively, consistently in three datasets; B: Prediction of the immune-specific subtypes of HBV+ HCC by the Random Forest algorithm using the 23 immune signatures as attributes. The 10-fold cross-validation results in the training set and classification results in test sets are shown.
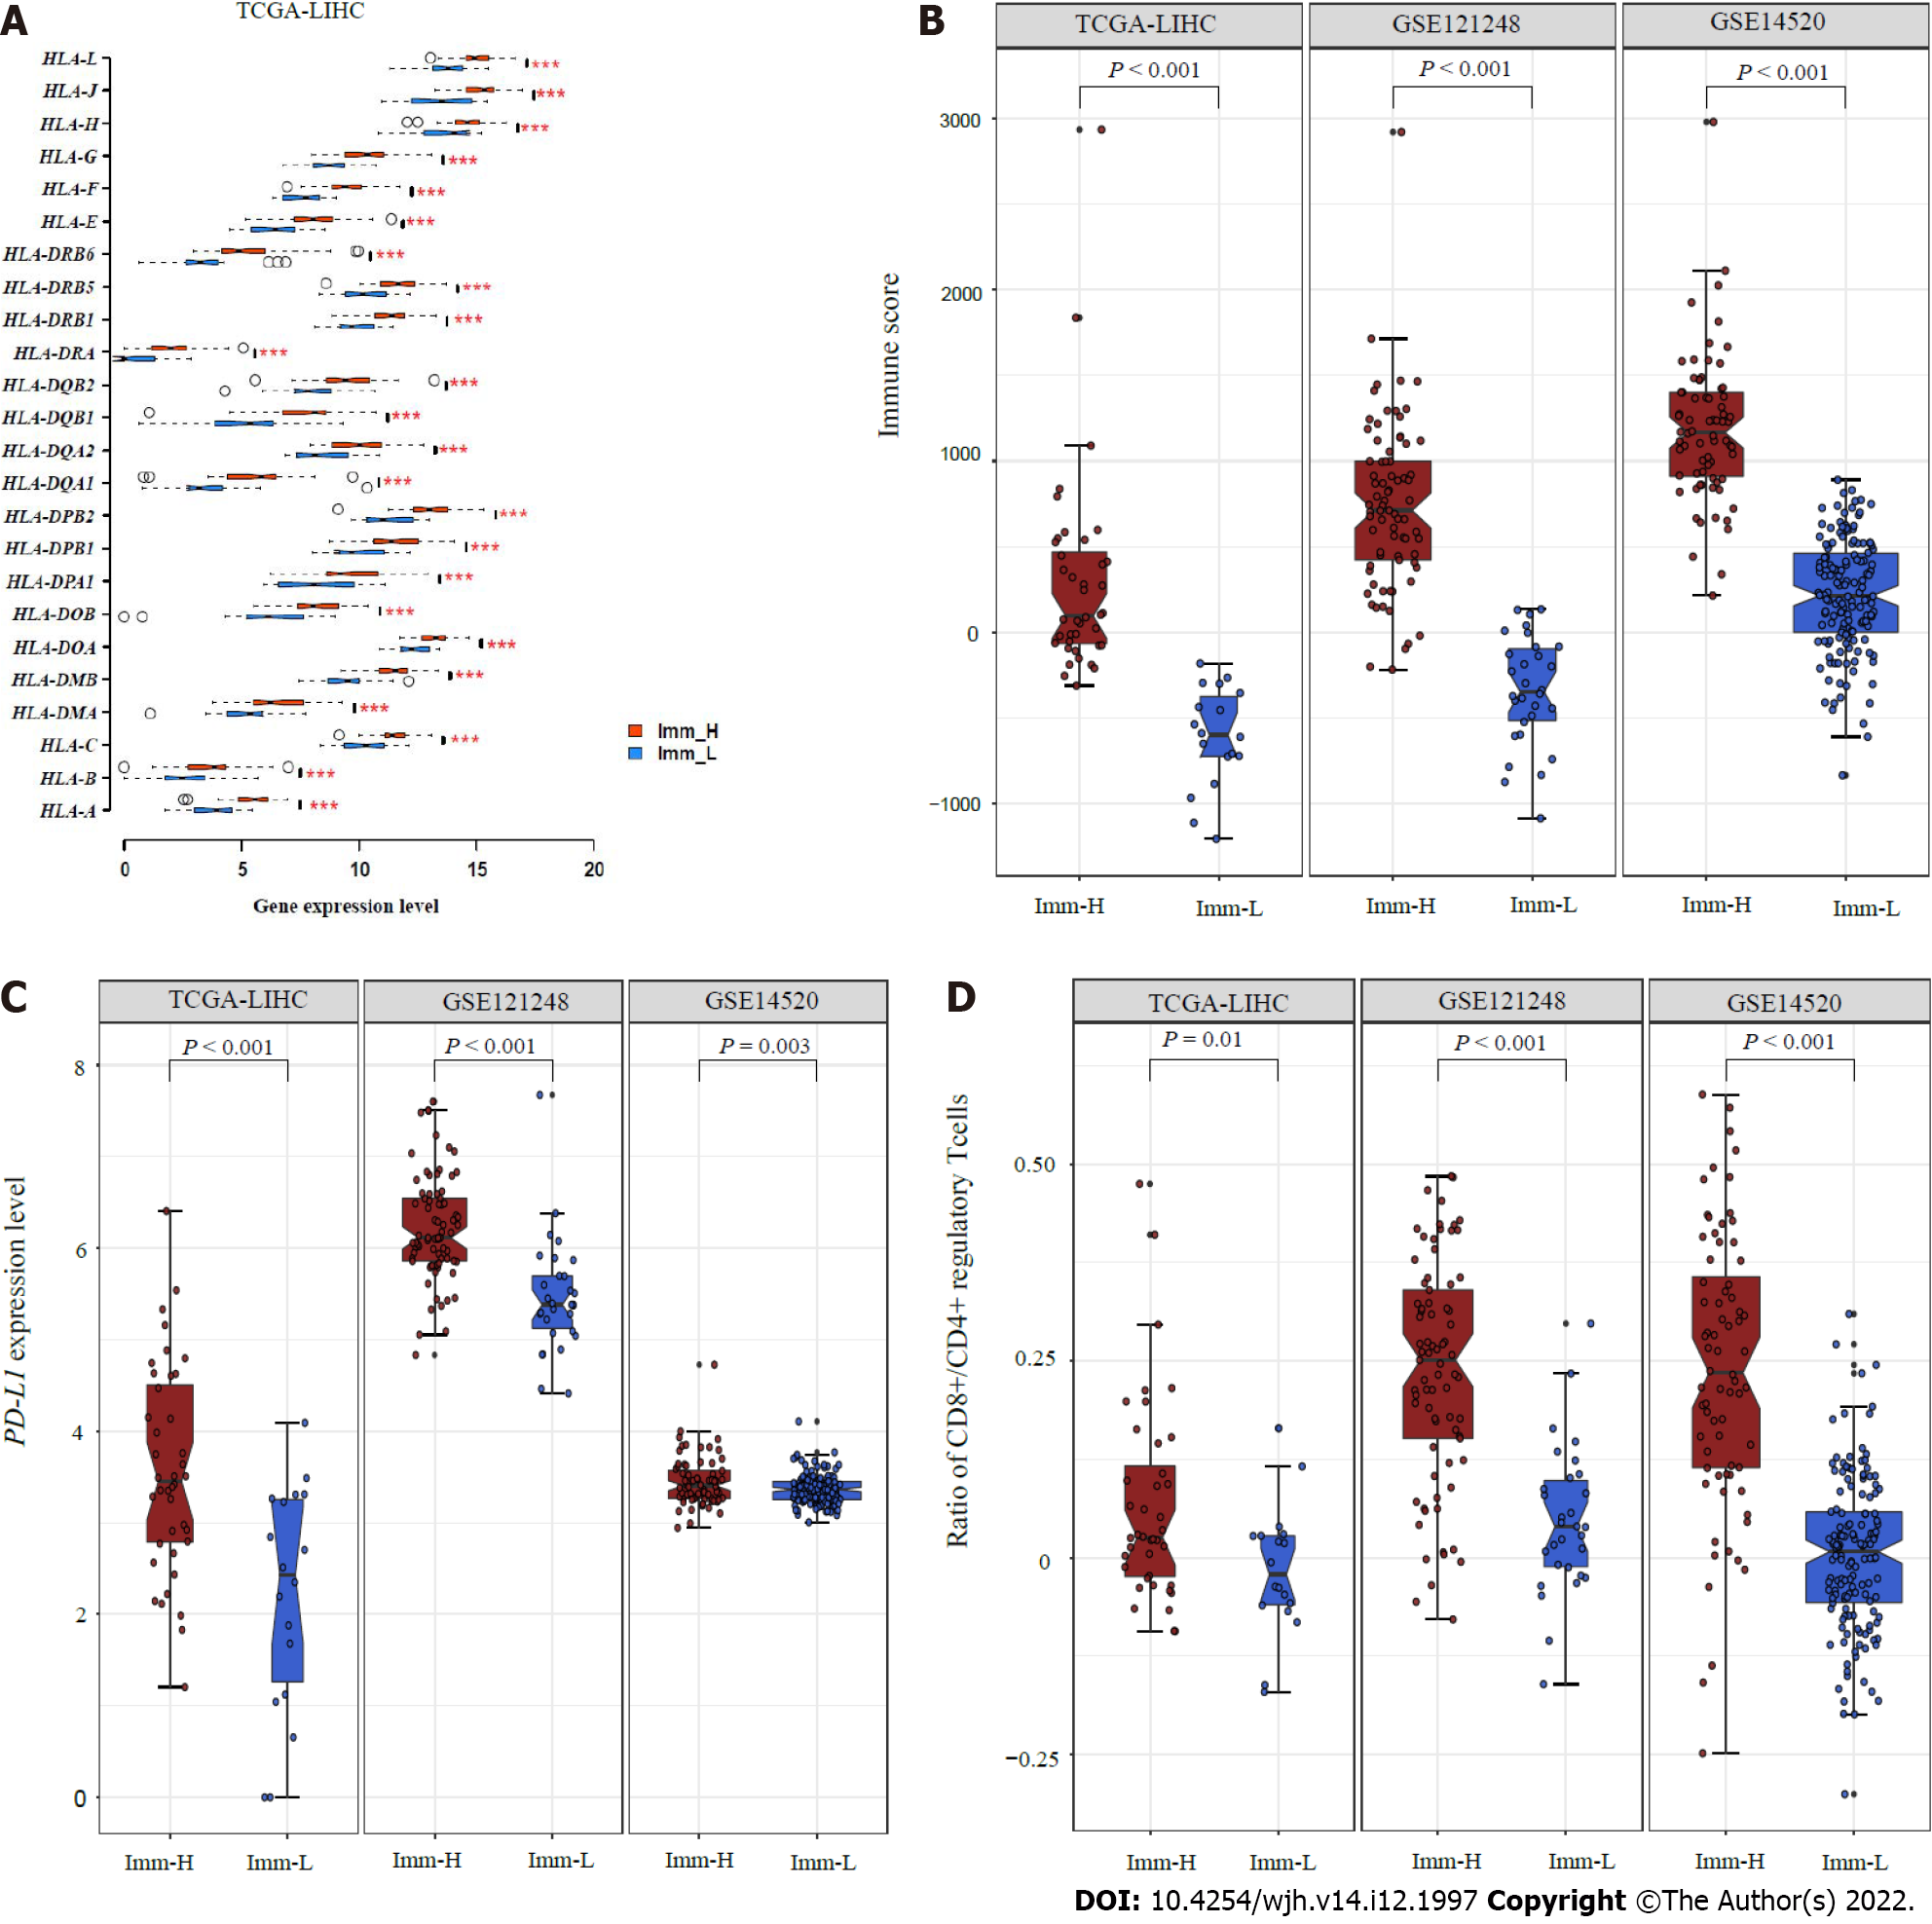
Figure 2 Comparisons of immune features between the immune-specific subtypes of hepatitis B virus + hepatocellular carcinoma.
A: Imm-H shows significantly higher expression levels of HLA genes; B: Immune scores; C: PD-L1 expression levels; D: Ratios of immunostimulatory to immunosuppressive signatures (CD8+/CD4+ regulatory T cells) than Imm-L. The two-tailed Student’s t test P values are shown in (A, C, D), and the one-tailed Mann–Whitney U test P values are shown in (B).
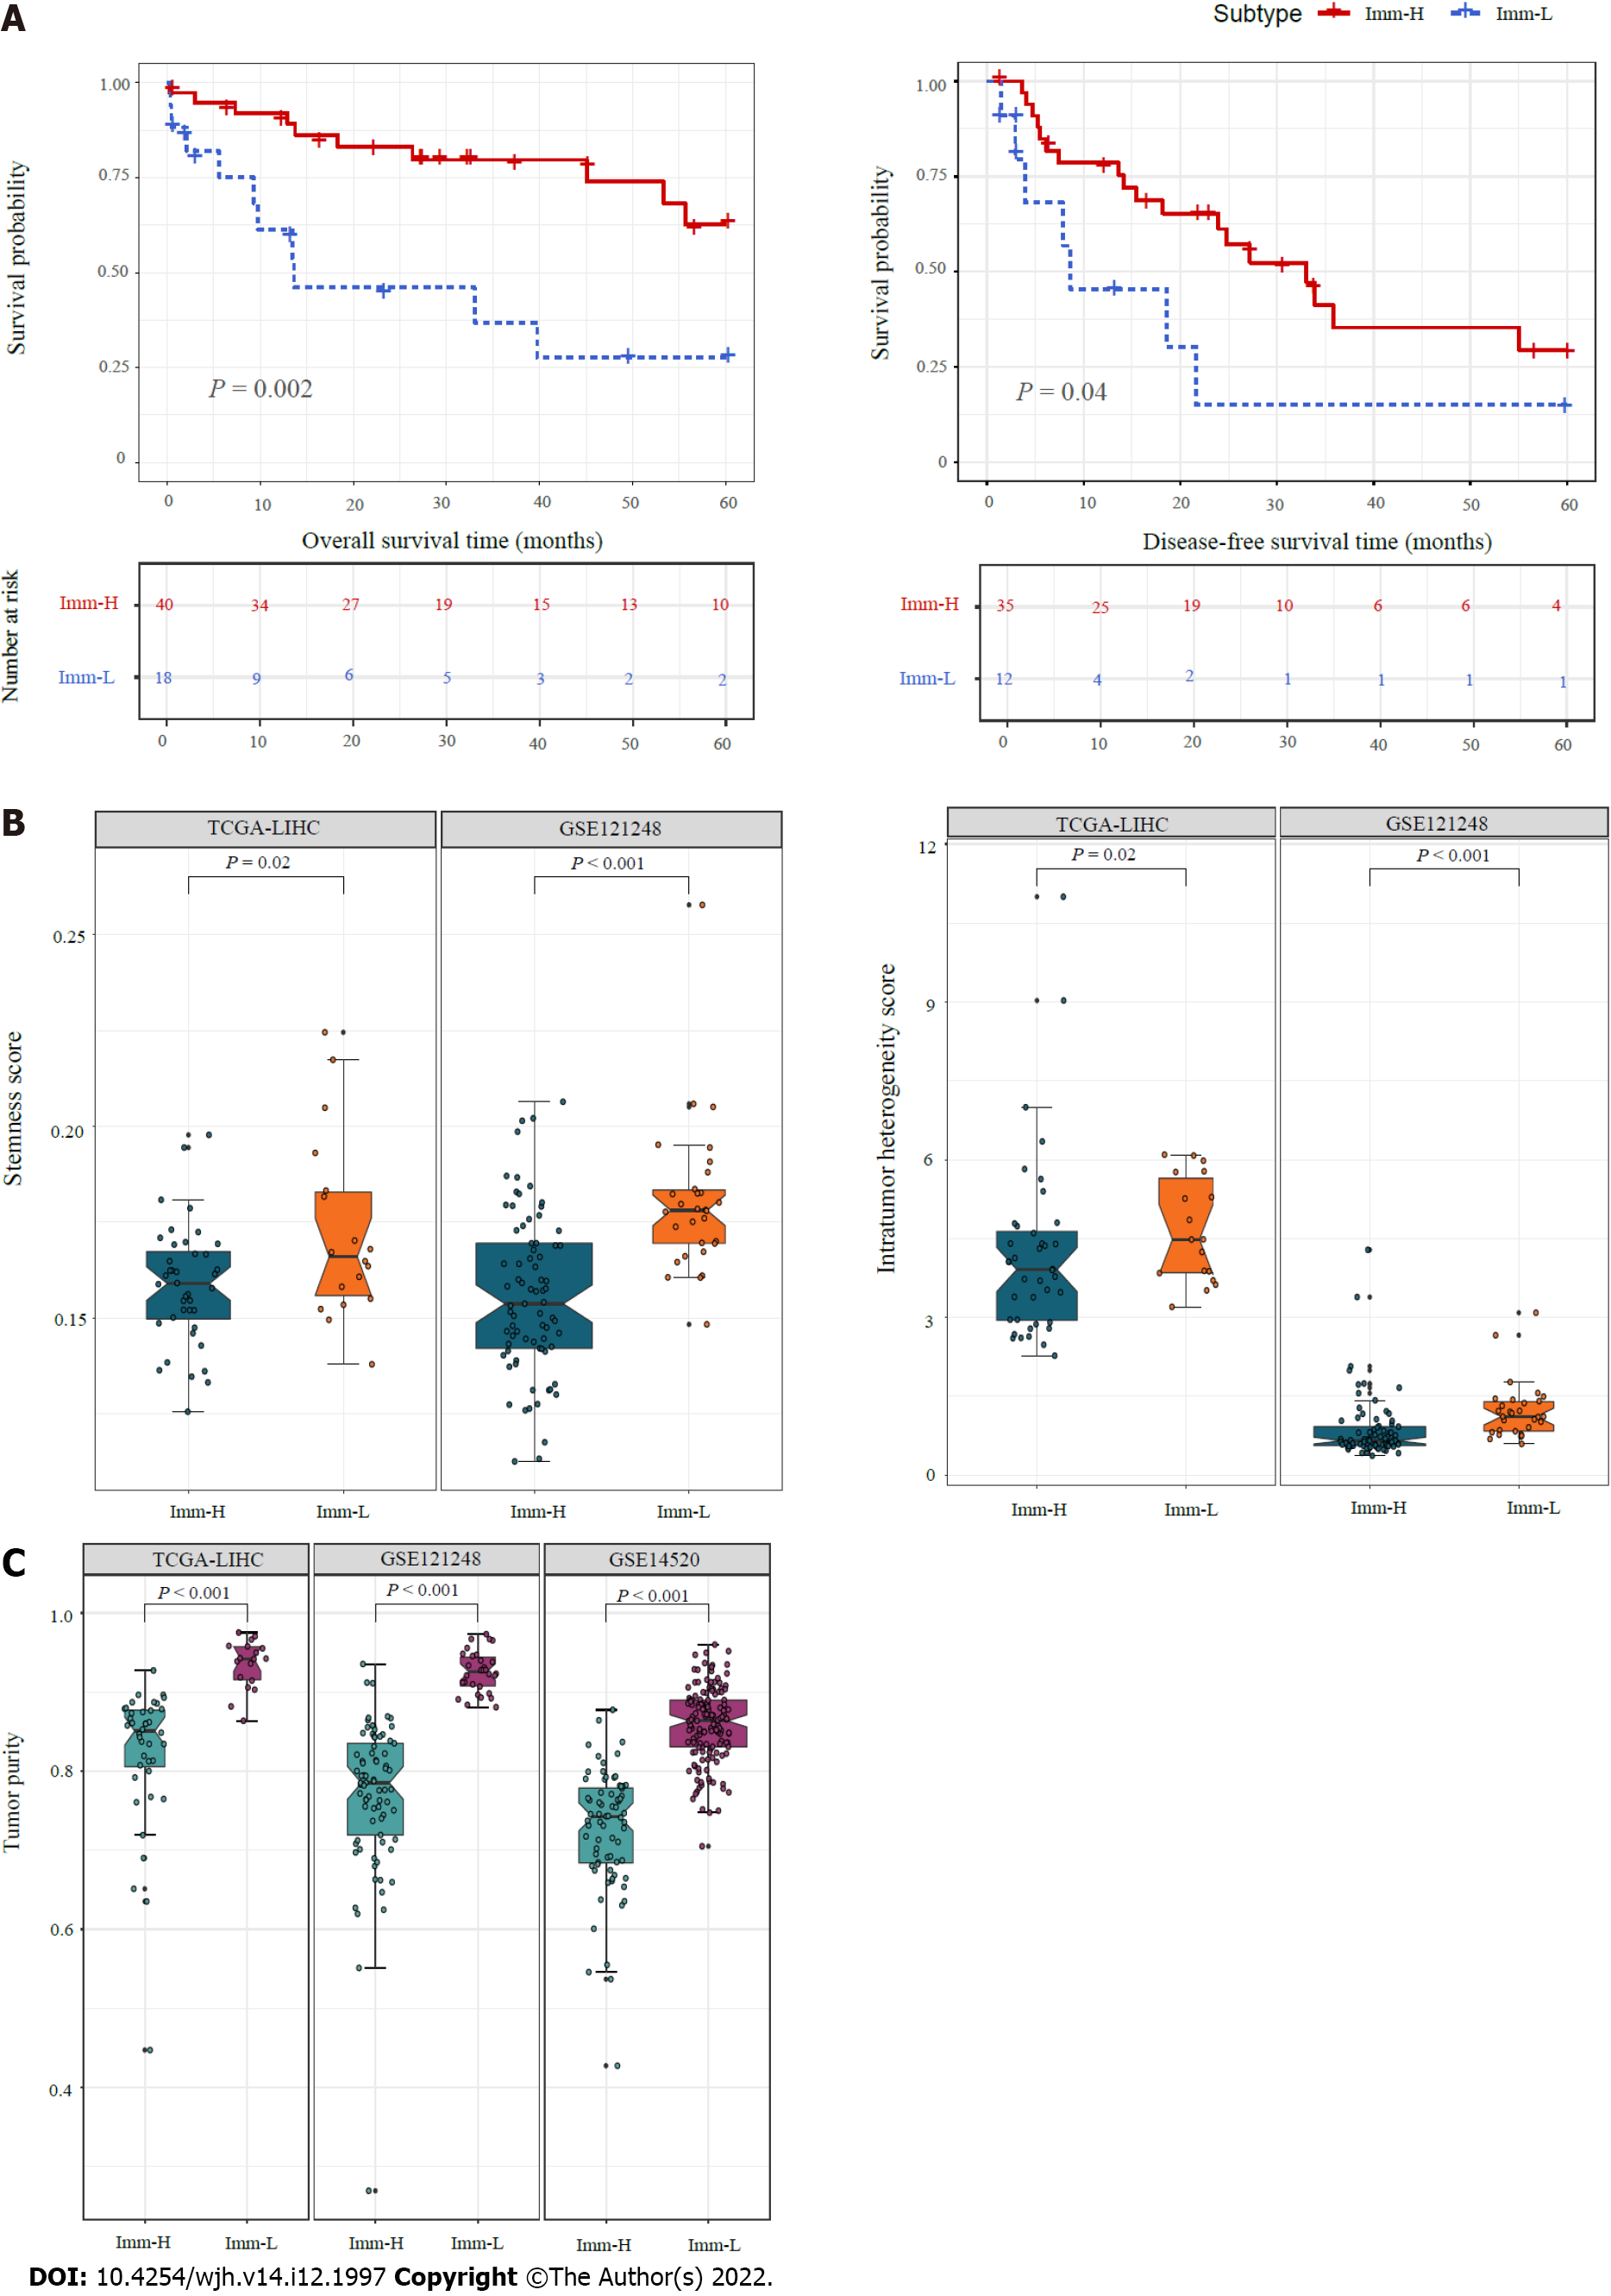
Figure 3 Comparisons of clinical and phenotypic features between the immune-specific subtypes of hepatitis B virus + hepatocellular carcinoma.
A: K–M curves showing that Imm-H has significantly higher 5-year overall survival and disease-free survival rates than Imm-L. The log-rank test P values are shown; B: Imm-H has significantly lower stemness and intratumor heterogeneity than Imm-L; C: Imm-H has significantly lower tumor purity than Imm-L. The one-tailed Mann–Whitney U test P values are shown in (B, C).
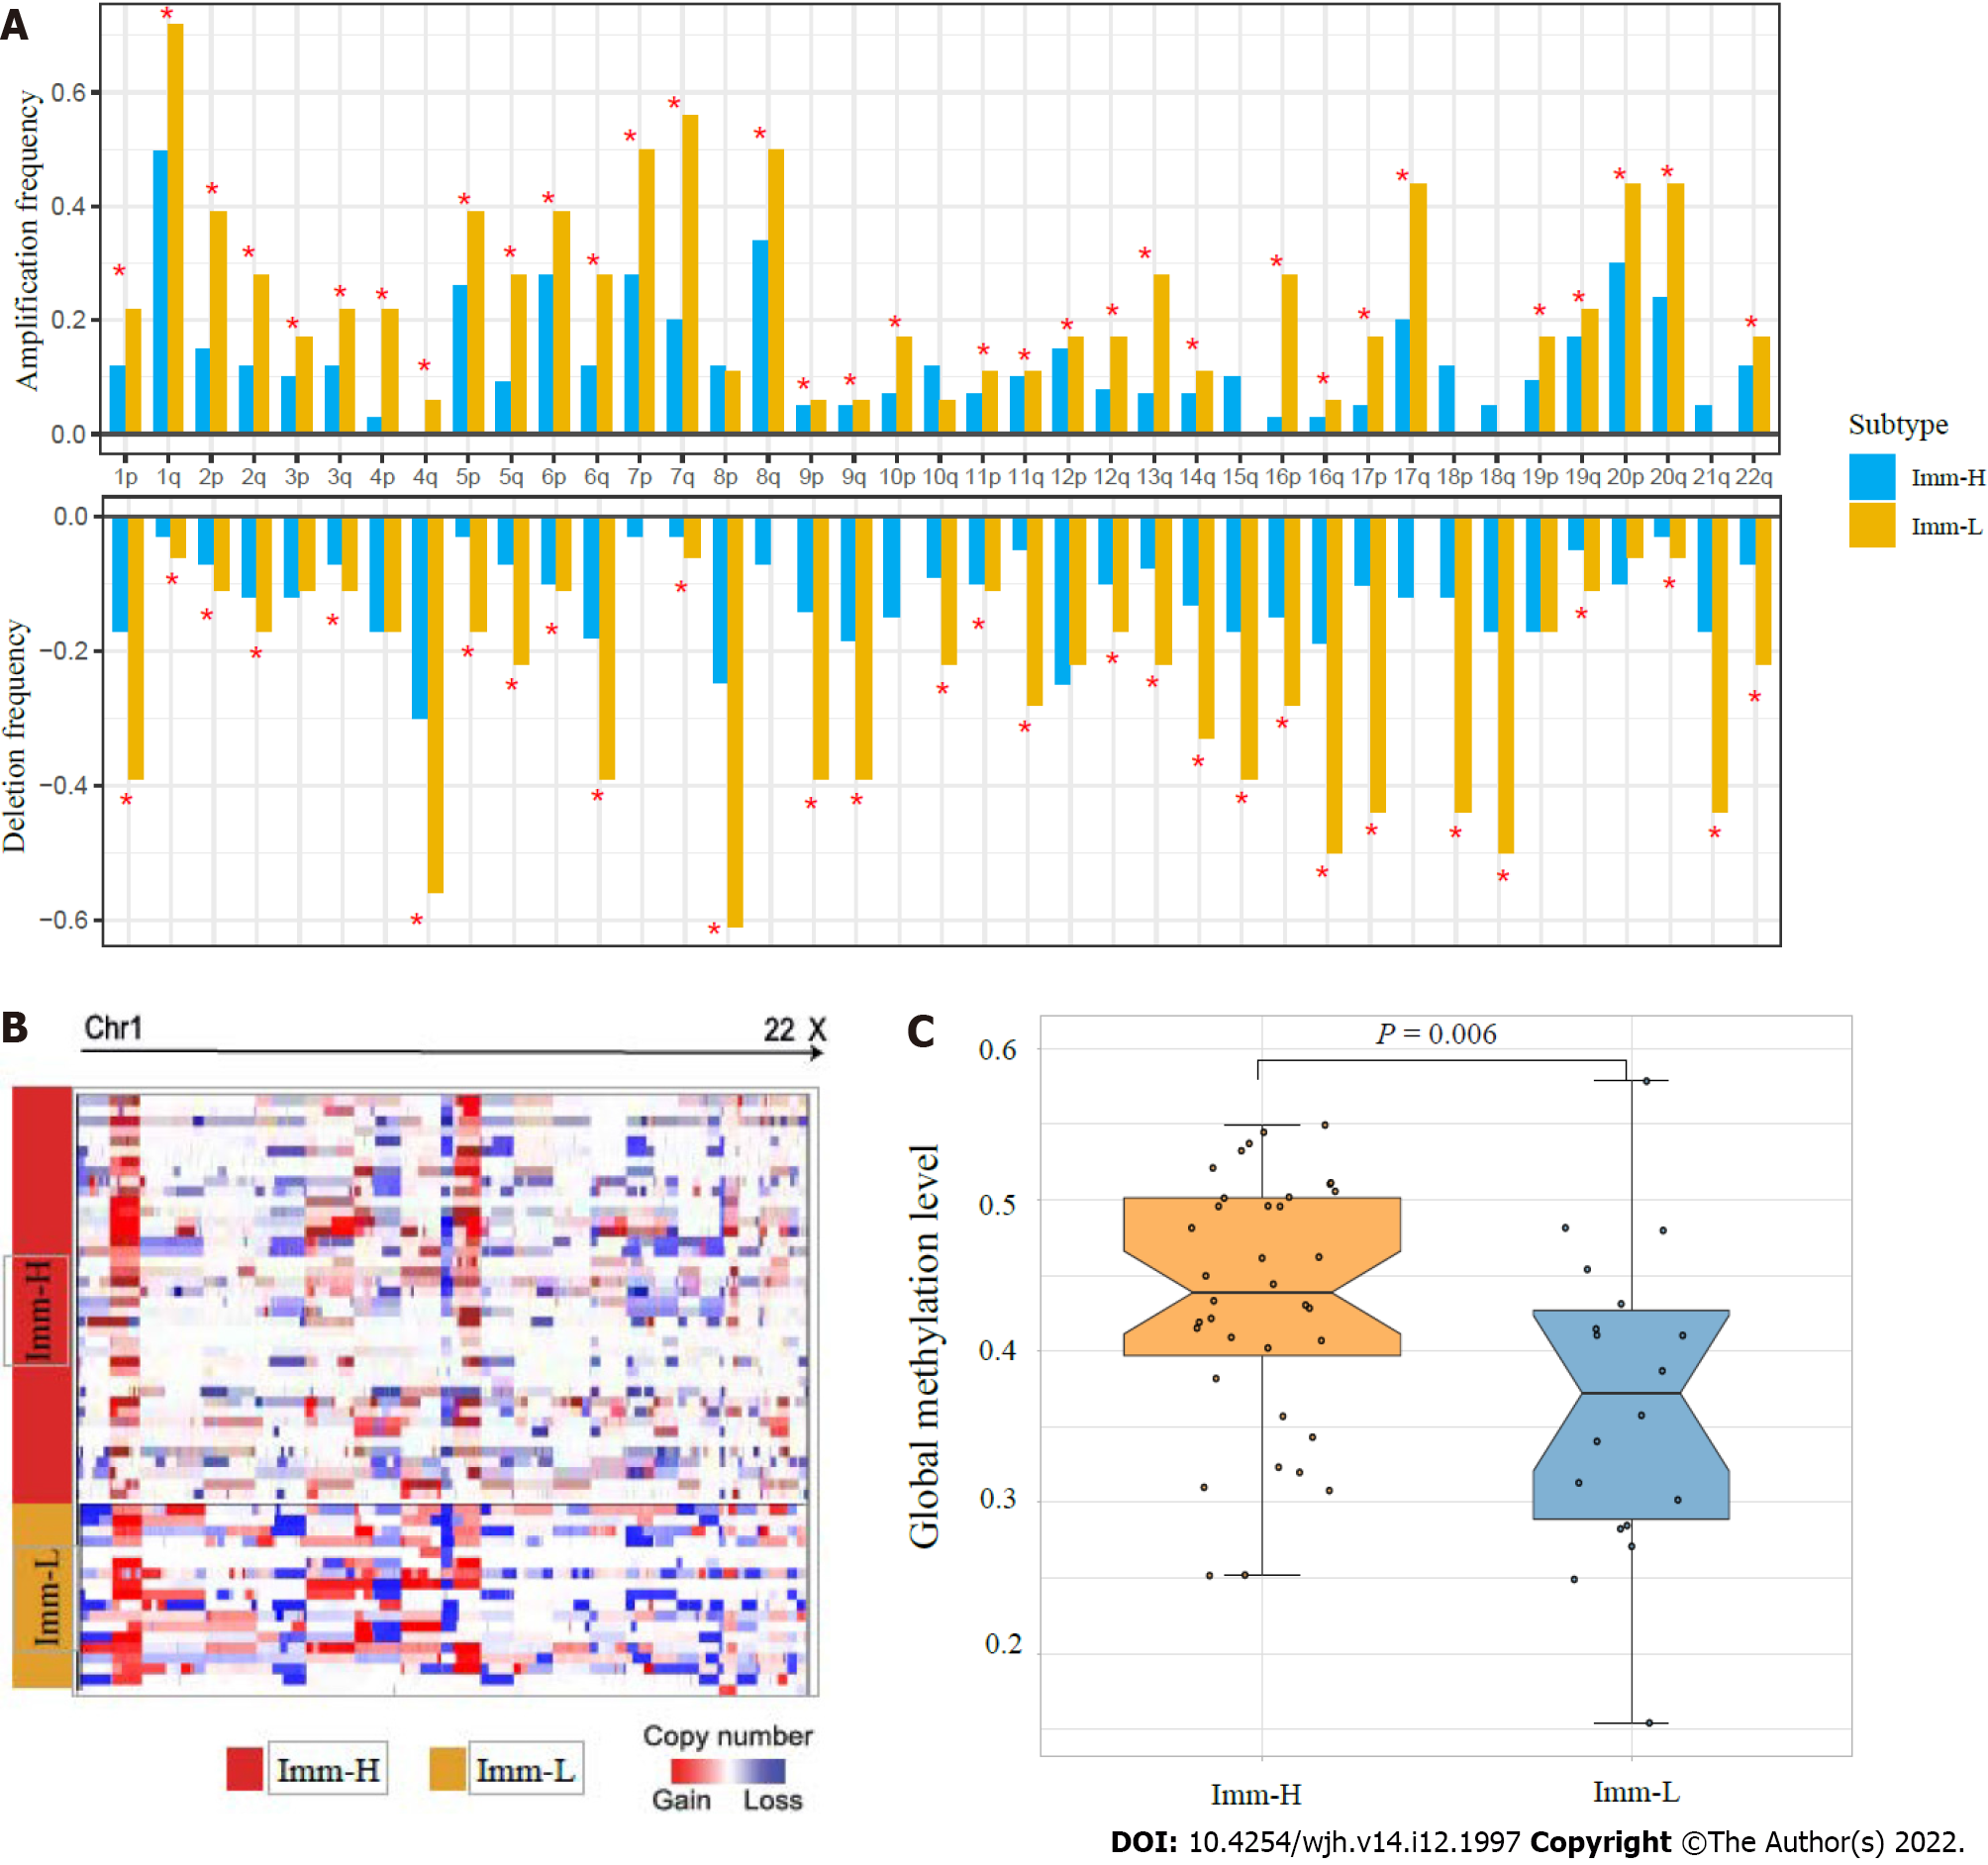
Figure 4 Comparisons of genomic and epigenomic features between the immune-specific subtypes of hepatitis B virus + hepatocellular carcinoma in TCGA-LIHC.
A: Comparison of the arm-level SCNAs between Imm-H and Imm-L. The red asterisks indicate the chromosome arms in which Imm-L has higher amplification or deletion frequency than Imm-H; B: Heatmap showing that Imm-L likely has higher amplitudes of copy number amplification and deletion across chromosomes than Imm-H; C: Imm-H has significantly higher global methylation levels than Imm-L. The one-tailed Mann–Whitney U test P values are shown.
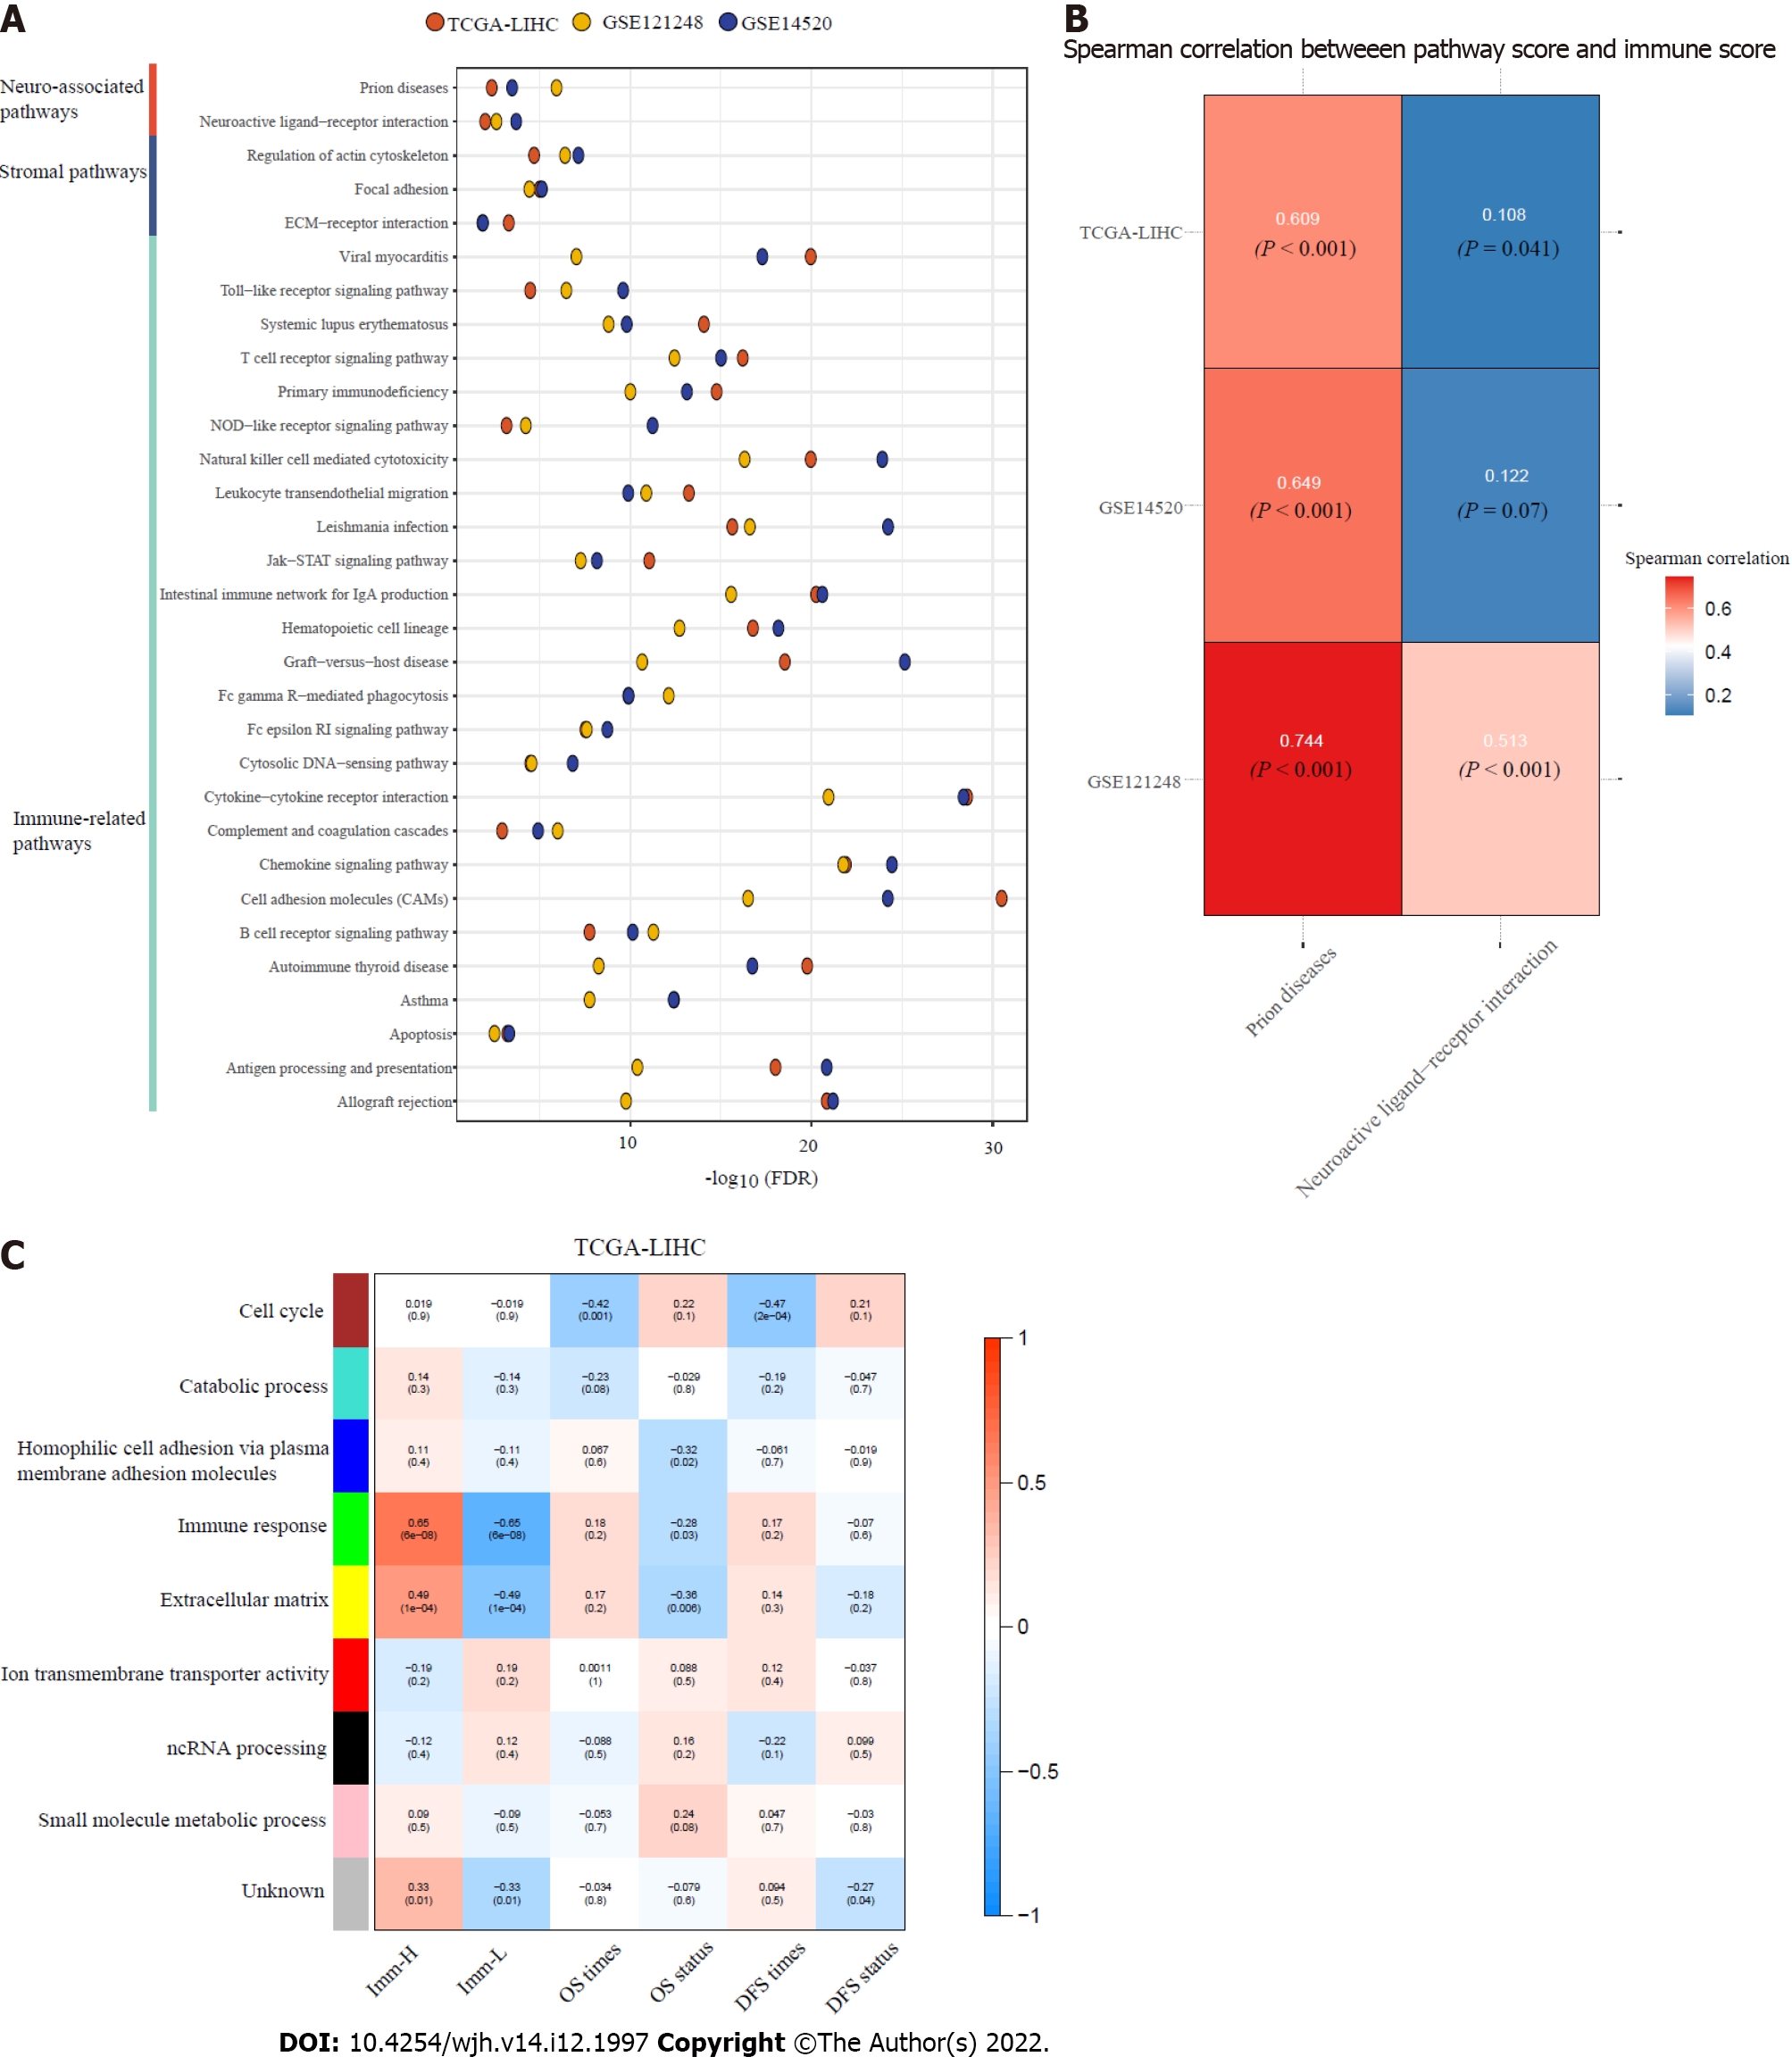
Figure 5 Pathways and gene ontology enriched in the immune-specific subtypes of hepatitis B virus + hepatocellular carcinoma.
A: The immune, stroma, and neuro-associated pathways more highly enriched in Imm-H versus Imm-L (false discovery rate < 0.05); B: Spearman correlations between the enrichment scores of the two neuro-associated pathways upregulated in Imm-H and immune scores in hepatitis B virus (HBV) + hepatocellular carcinoma (HCC); C: The gene modules and their representative gene ontology terms significantly differentiating HBV+ HCC by the immune-specific subtypes, overall survival, and/or disease-free survival. The correlation coefficients and P values (in parenthesis) are shown.
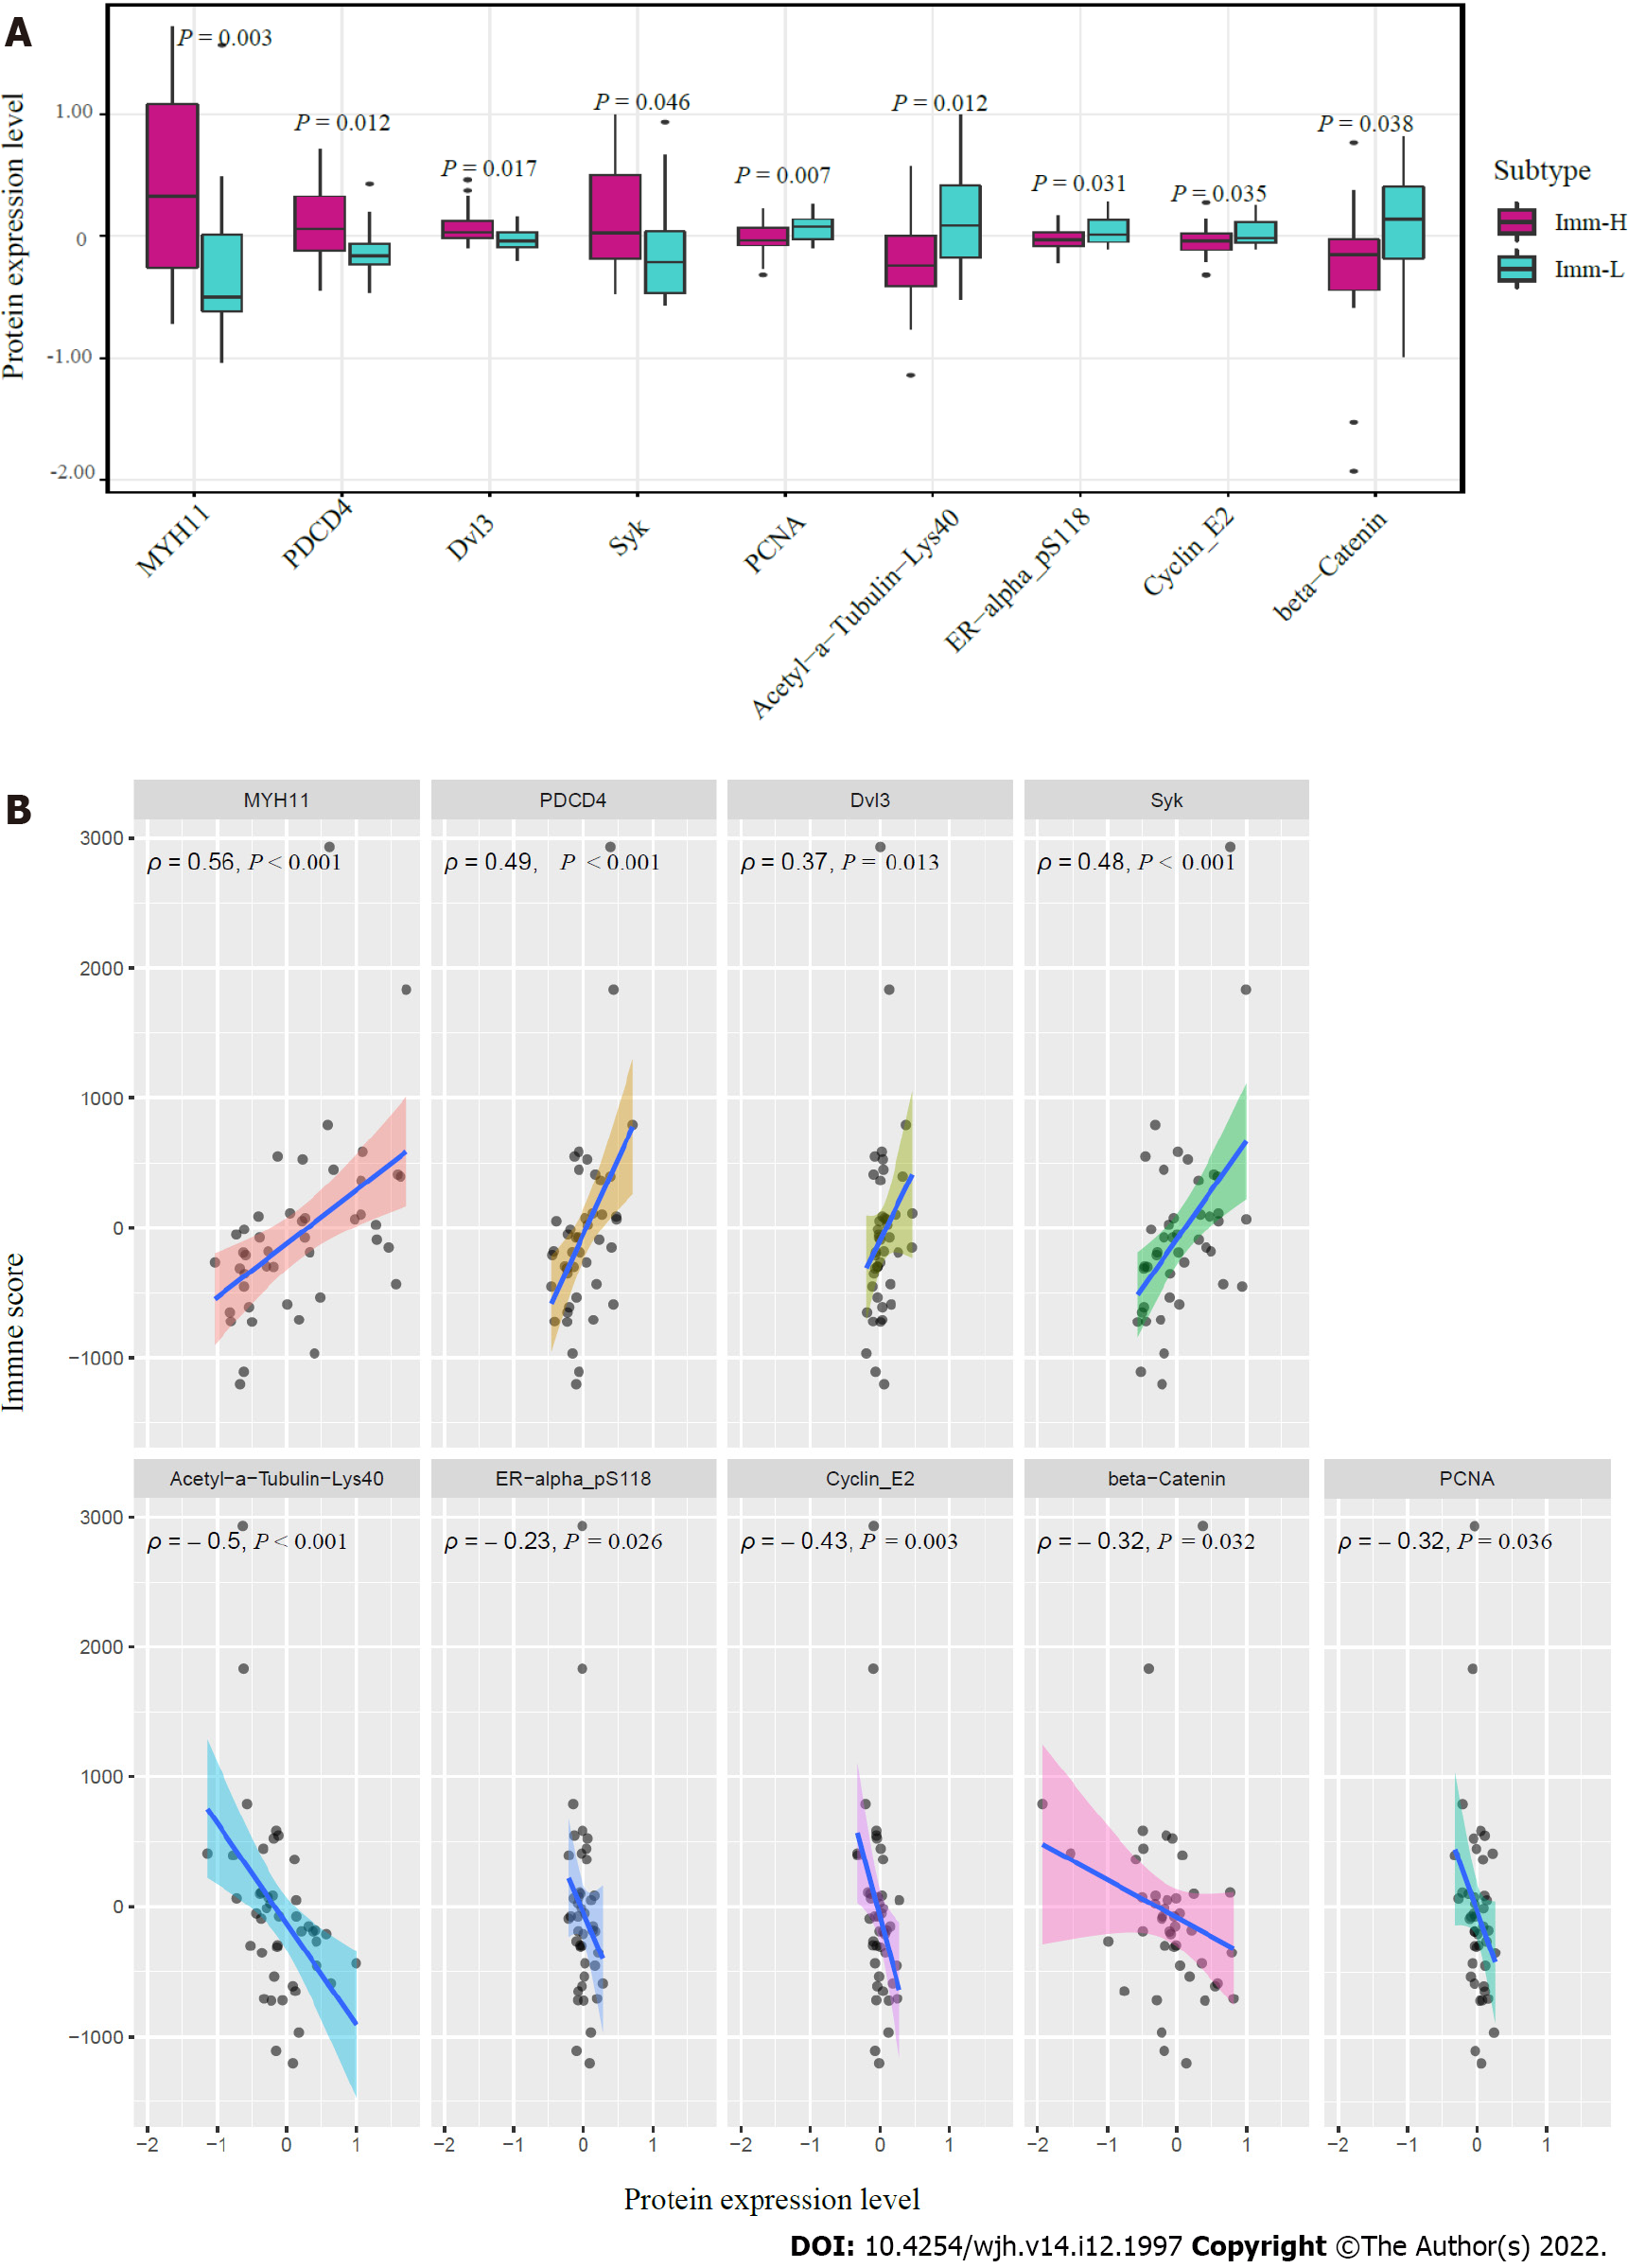
Figure 6 Proteins enriched in the immune-specific subtypes of hepatitis B virus + hepatocellular carcinoma in TCGA-LIHC.
A: Nine proteins having significantly different expression levels between Imm-H and Imm-L. The two-tailed Student’s t test P values are shown; B: Spearman correlations between the expression levels of the nine proteins and immune scores in hepatitis B virus + hepatocellular carcinoma. The Spearman correlation coefficients (ρ) and P values are shown.
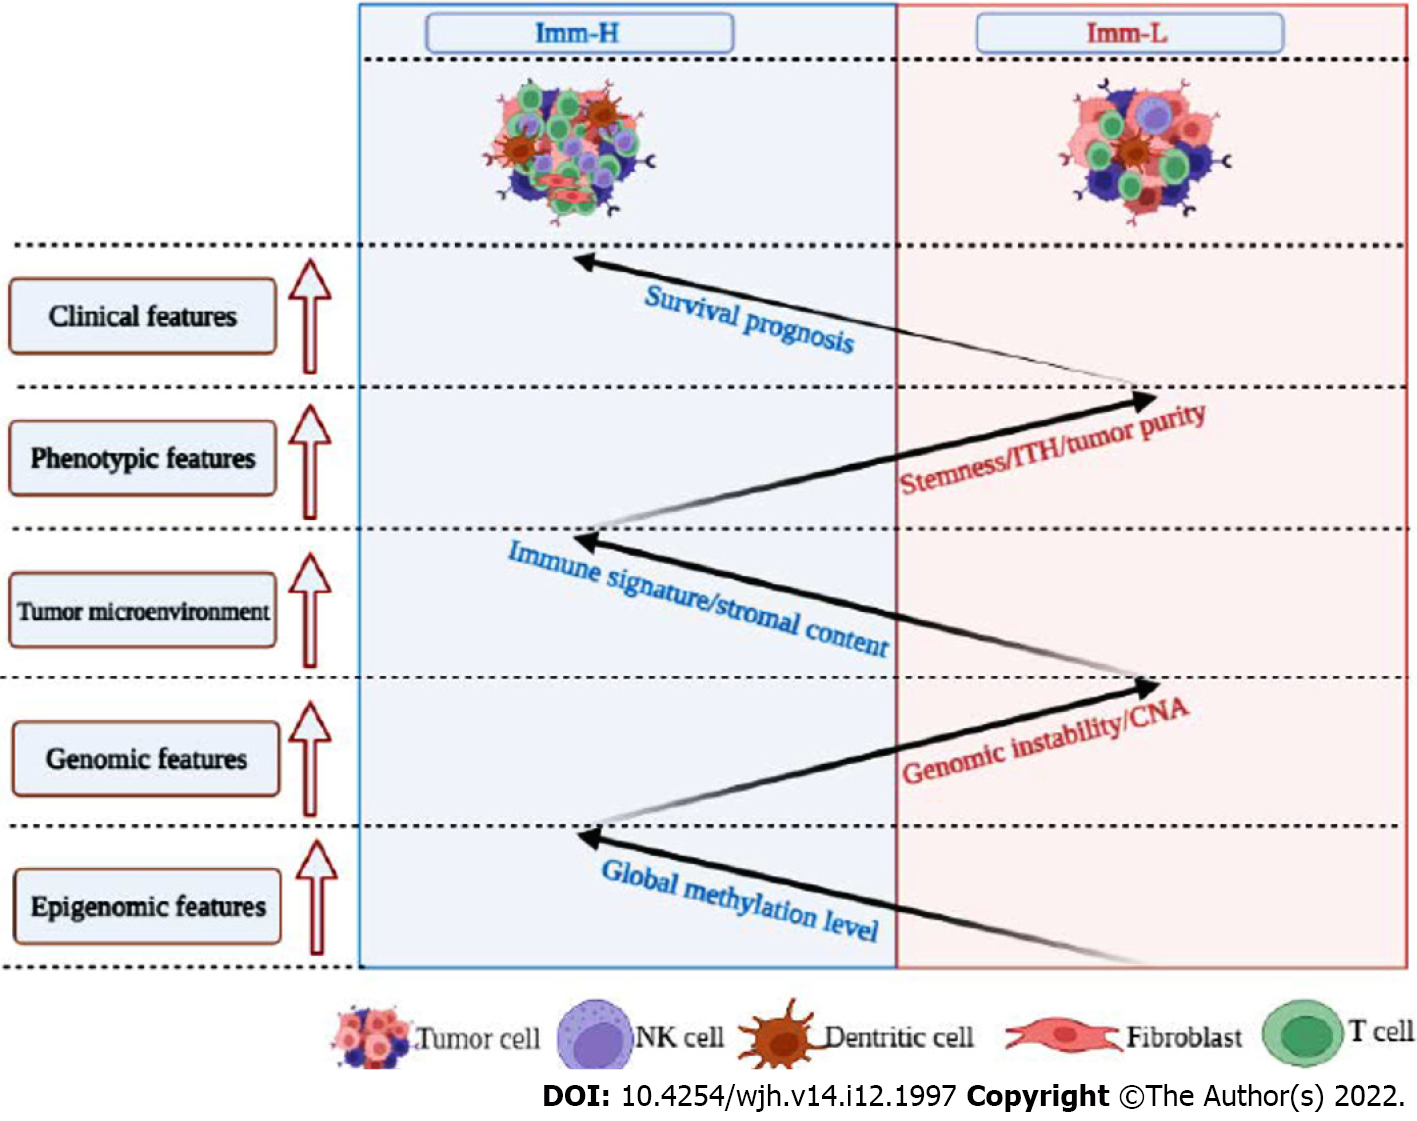
Figure 7 Schematic comparisons of clinical and molecular features between the immune-specific subtypes of hepatitis B virus + hepatocellular carcinoma.
The figure was created with BioRender.com.
- Citation: Li SW, Han LF, He Y, Wang XS. Immunological classification of hepatitis B virus-positive hepatocellular carcinoma by transcriptome analysis. World J Hepatol 2022; 14(12): 1997-2011
- URL: https://www.wjgnet.com/1948-5182/full/v14/i12/1997.htm
- DOI: https://dx.doi.org/10.4254/wjh.v14.i12.1997


