Copyright
©The Author(s) 2021.
World J Hepatol. Feb 27, 2021; 13(2): 187-217
Published online Feb 27, 2021. doi: 10.4254/wjh.v13.i2.187
Published online Feb 27, 2021. doi: 10.4254/wjh.v13.i2.187
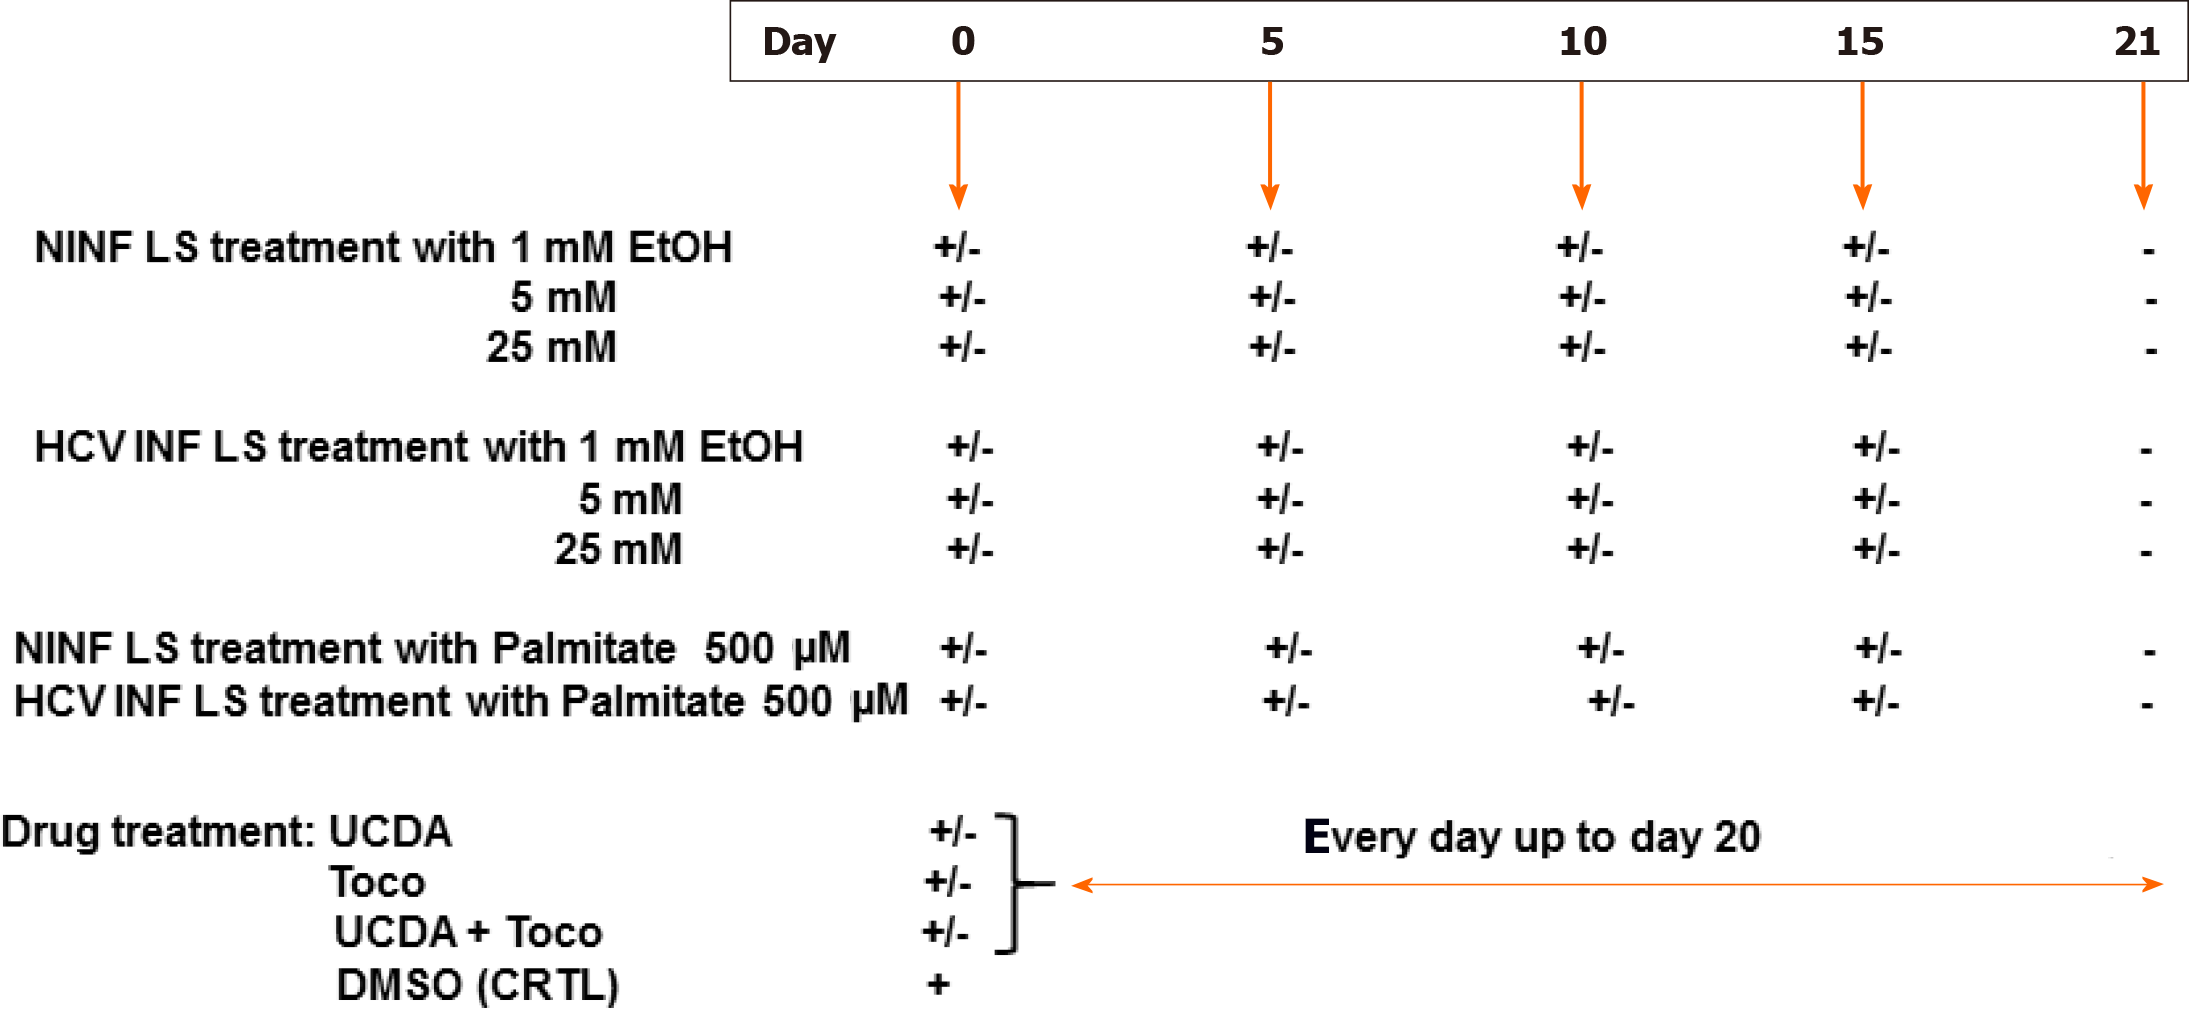
Figure 1 Experimental set up of the different liver slice treatments during the cultures.
NINFLS: Non-infected liver slices; EtOH: Ethanol; LS: Liver slices; Toco: Tocopherol; UCDA: Ursodeoxycholic acid; HCV: Hepatitis C virus.
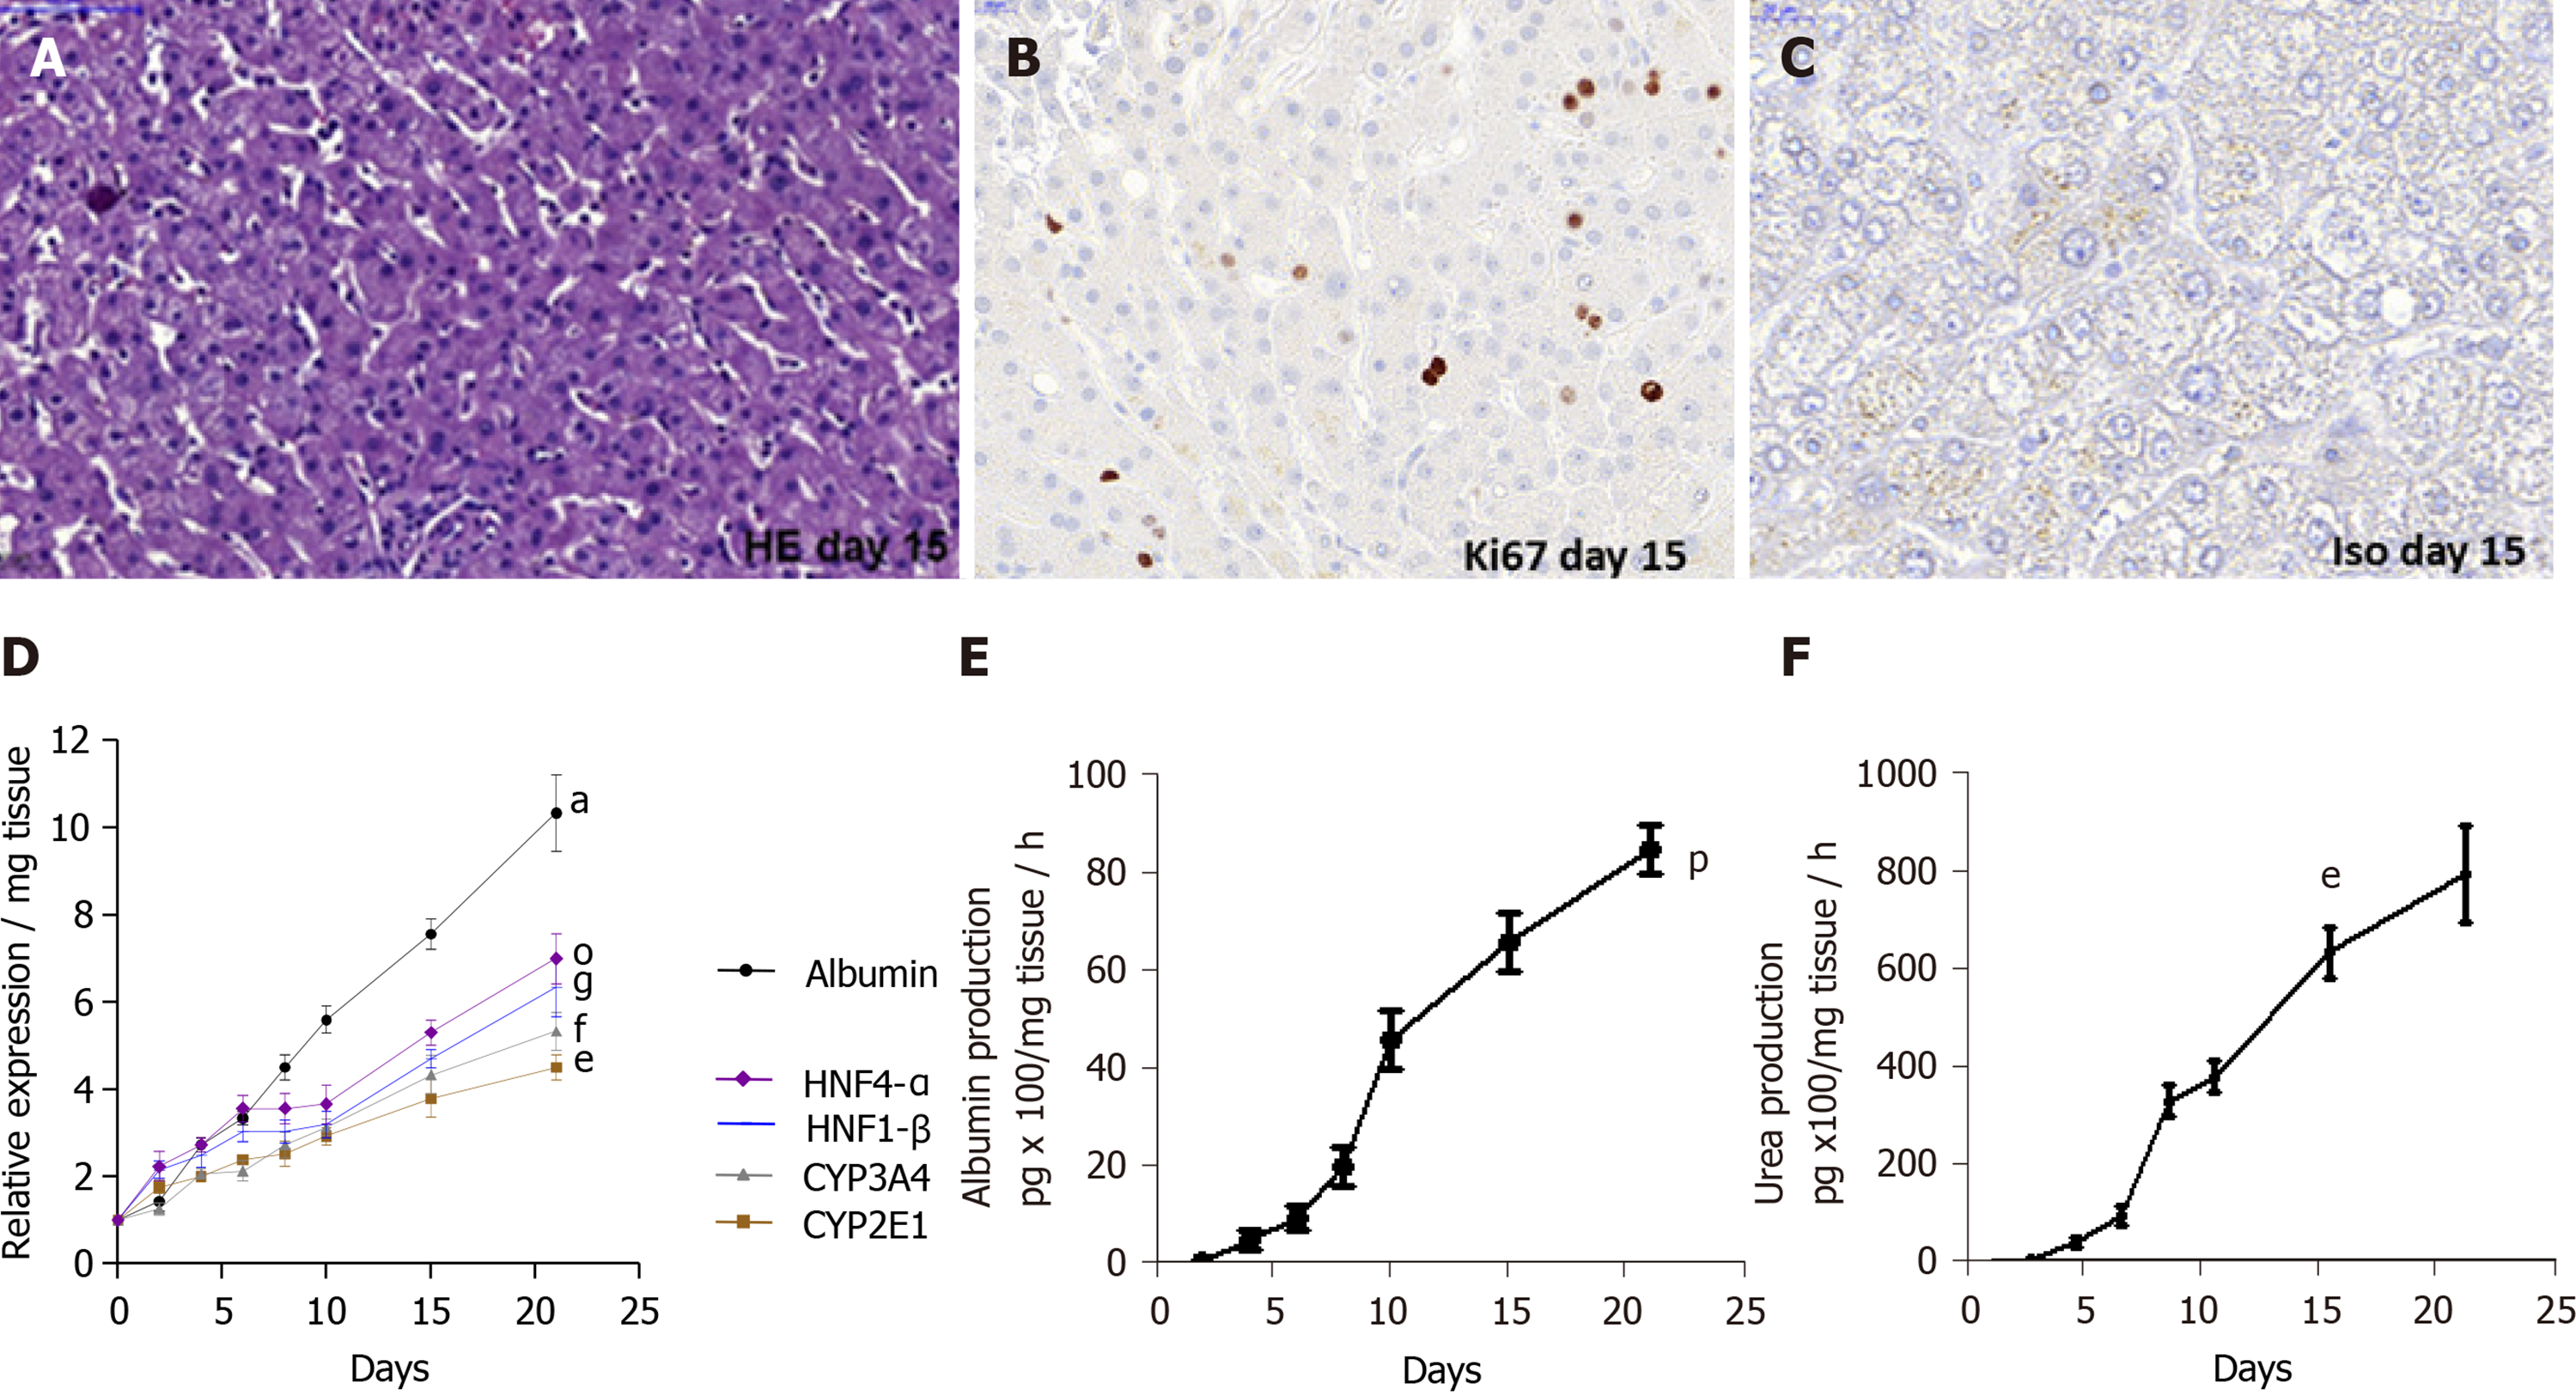
Figure 2 Maintenance of phenotypic characteristics of human non-fibrotic (F0-F1), and fibrotic (F2-F3, F4) liver slices during the culture, demonstrated by histochemistry, real-time reverse transcription-quantitative polymerase chain reaction and biochemical assays.
A: Light microscopy of human liver tissue 7 µm-thick section stained with hematoxylin and eosin showing non-fibrotic (F2-F3) liver lobular architecture on day 15, magnification × 20. Scale bars 100 µm; B: Representative human liver tissue 7 µm-thick sections from fibrotic (F2-F3) liver patient showing immunostaining for Ki67, a proliferation marker, on day 15, magnification × 40, Scale bars, 20 µm; C: Representative human liver tissue 7 µm-thick sections from fibrotic (F2-F3) liver patient showing immunostaining with isotype as negative control, on day 15, magnification × 40, Scale bars, 20 µm; D: Hepatocyte-specific gene mRNA expression (relative expression/mg tissue) during the 21 days follow up studies. Maintenance of hepatocyte-specific gene expression patterns in human non-fibrotic (F0-F1) non-infected liver slices during culture. The real-time reverse transcription-quantitative polymerase chain reaction analyses were performed from five independent human non-fibrotic (F0-F1) livers using slices in triplicate from each liver. All liver-specific gene expression values were normalized to 18S RNA as an internal standard and expressed relative to the zero-time point. Values are expressed as mean ± standard errors. The results were compared using the two-paired Student’s t-test: Albumin: aP < 0.0001; CYP2E1: eP < 0.001; CYP3A4: fP < 0.0003; HNF1-β: gP < 0.01; HNF4-α: oP < 0.008; E and F: Biochemical functional assays; E: Albumin production (pg x 100/mg tissue/hour) during the 21 days follow up studies; and F: Urea production (pg/mg tissue/hour) during the 21 days follow up studies. Studies were done in triplicate and repeated twice for each liver sample. Values are expressed as means ± standard errors (n = 5). The results were compared using the two-paired Student’s t-test: albumin production (pP < 0.02), urea production (eP < 0.001).
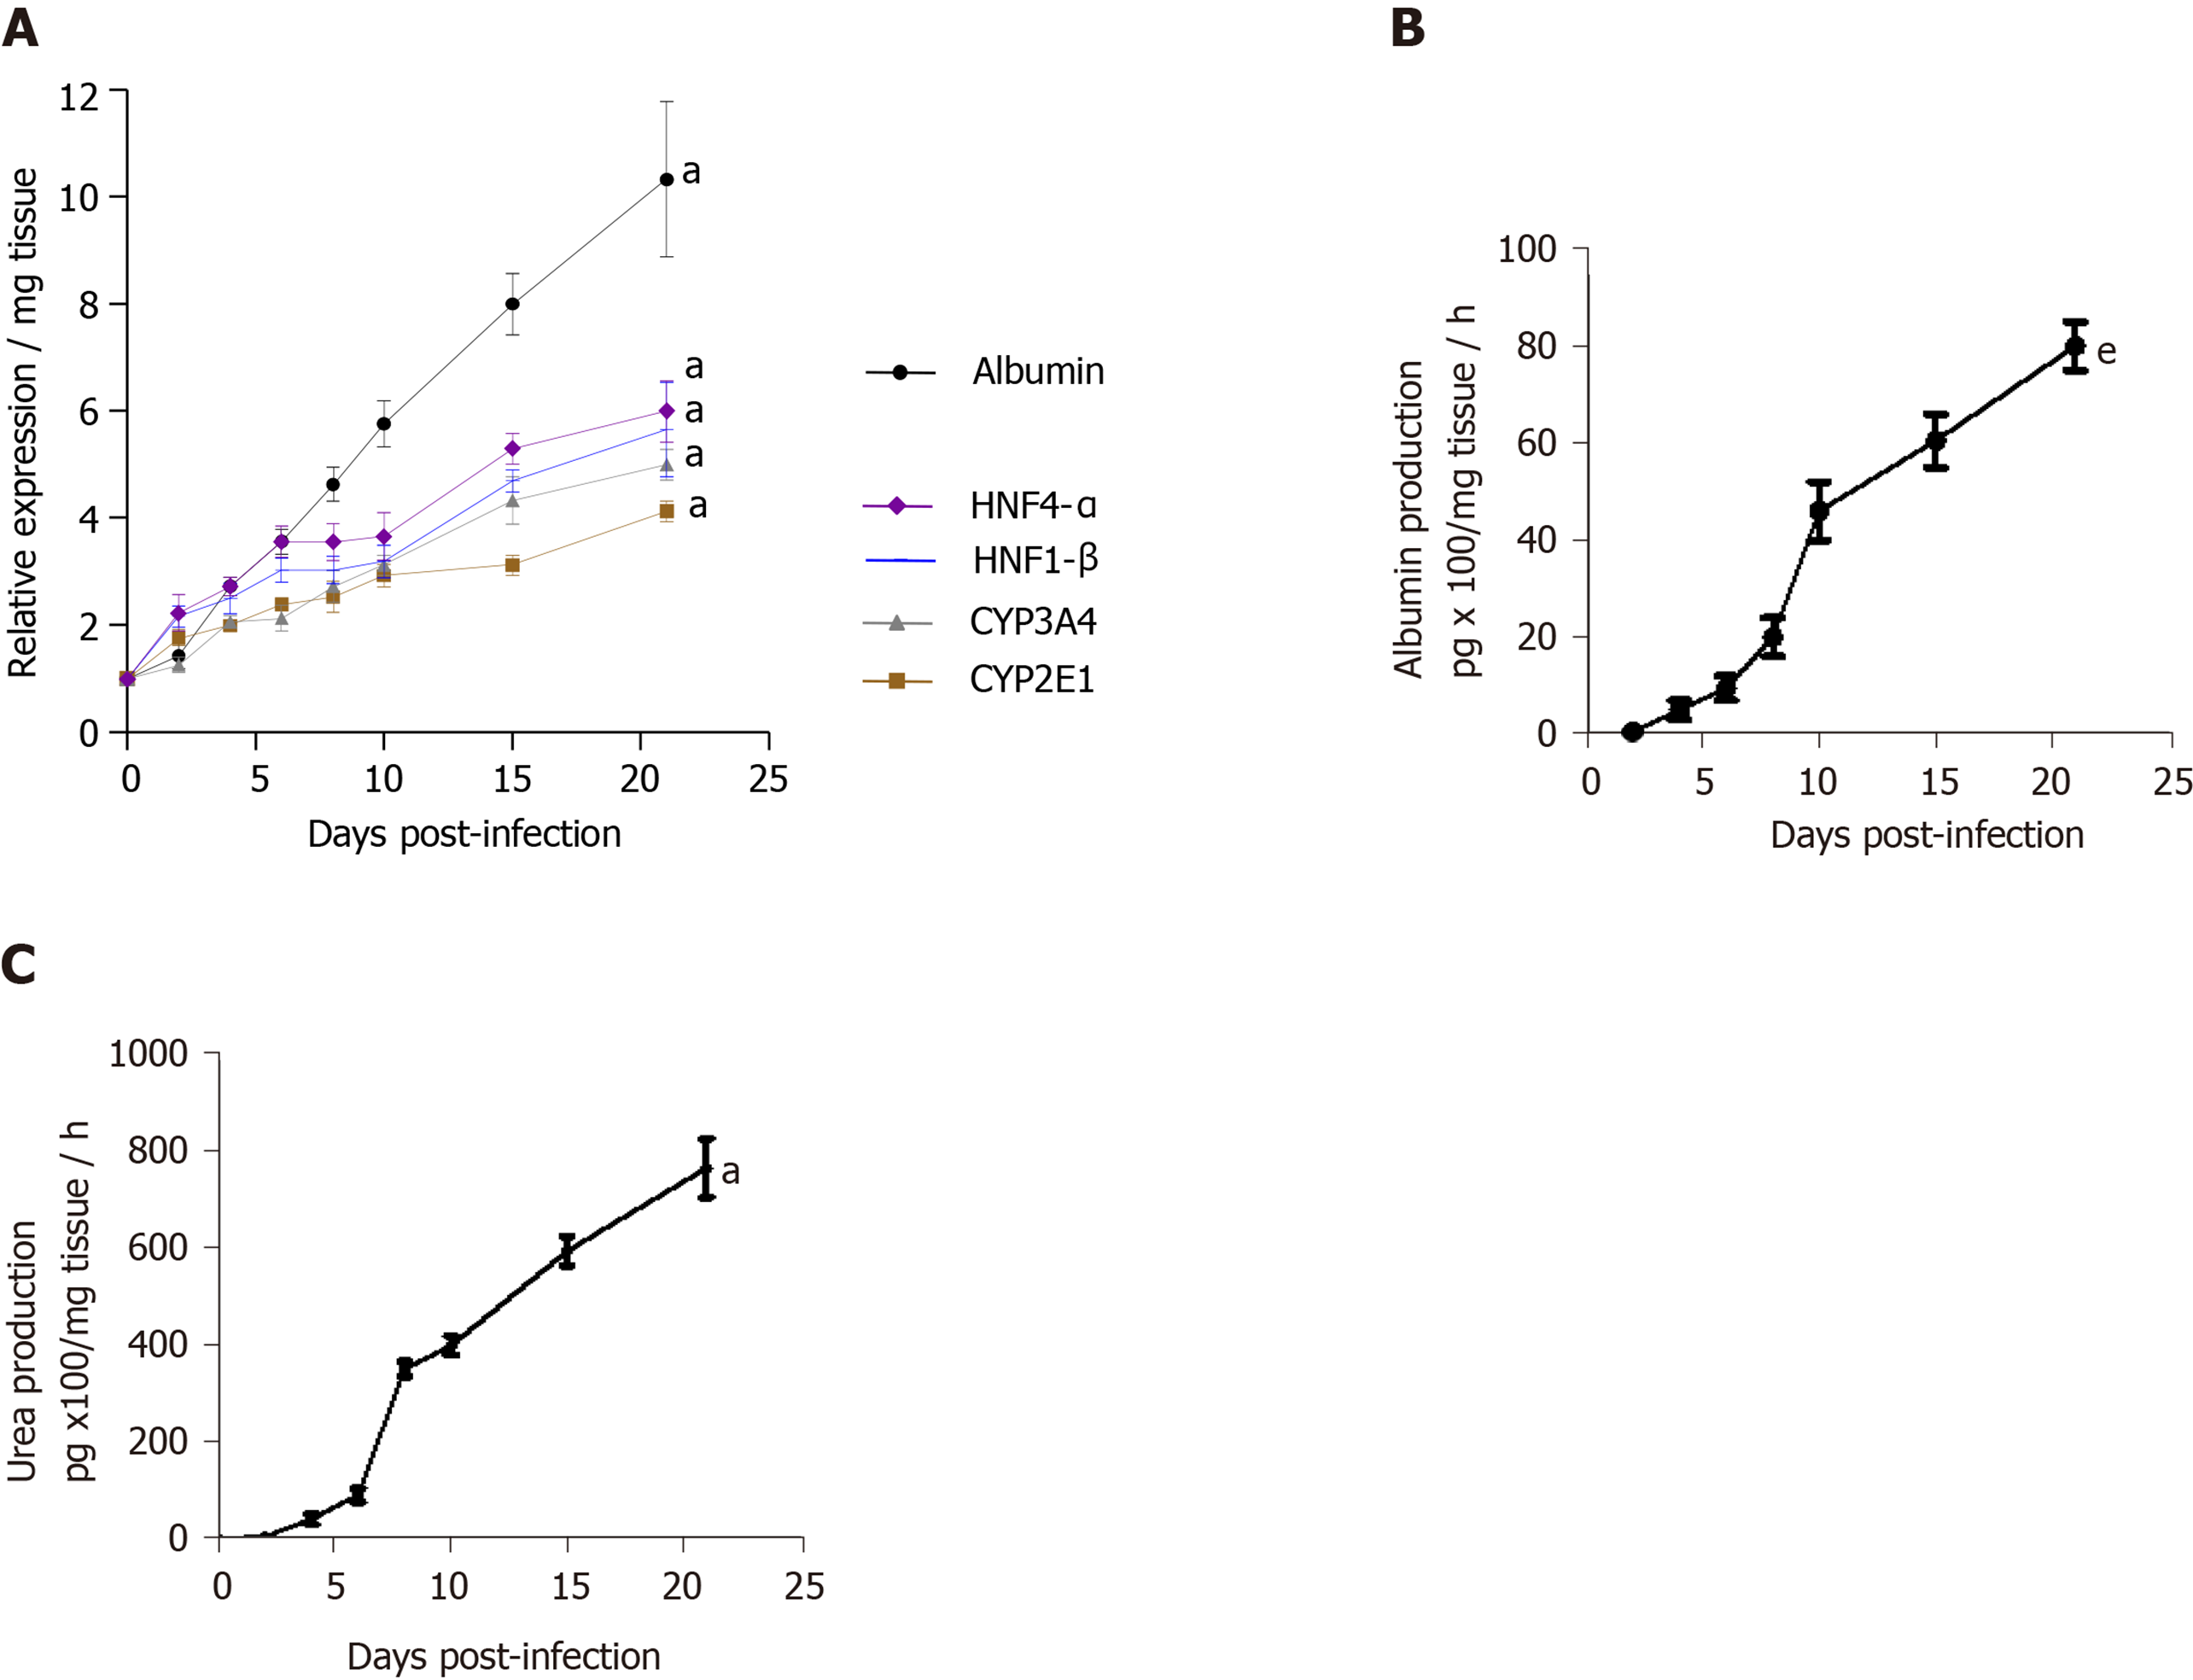
Figure 3 Maintenance of phenotypic characteristics of human non-fibrotic (F0-F1) hepatitis C virus-infected liver slices during the culture, demonstrated by real-time reverse transcription-quantitative polymerase chain reaction and biochemical assays.
A: Hepatocyte-specific gene mRNA expression (relative expression/mg tissue) during the 21 days follow up studies. Maintenance of hepatocyte-specific gene expression patterns in human non-fibrotic (F0-F1) hepatitis C virus (HCV) infected liver slices during the culture. The real-time reverse transcription-quantitative polymerase chain reaction analyses were performed from five independent human non-fibrotic (F0-F1) liver samples, using HCV- infected slices in triplicate from each liver. Liver slices were infected with HCVcc, on day 0, at MOI = 0.1. All liver–specific gene expression values were normalized to 18S RNA as an internal standard and expressed in relation to the zero-time point. Values are expressed as mean ± standard errors. The results were compared using the two-paired Student’s t-test: Albumin, aP < 0.0001; CYP2E1: aP < 0.0001; CYP3A4: aP < 0.0001; HNF1-β: aP < 0.0001; HNF4-α: aP < 0.0001); B and C: Biochemical functional assays: B: Albumin production (pg x 100/mg tissue/ hour) during the 21d- follow up studies (days). C: Urea production (pg/mg tissue/hour during the 21d- follow up studies (days) by human F0-F1 cultured HCV-infected liver slices (n = 5). The assays were performed as previously described[11,12]. Studies were performed in triplicate and repeated twice for each liver sample. Values are expressed as means ± standard errors (n = 5). The results were compared using the two-paired Student’s t-test: Albumin production: eP < 0.001; urea production: aP < 0.0001.
Figure 4 Viability of human non-fibrotic (F0-F1), and fibrotic (F2-F3, F4) non-infected or hepatitis C virus-infected liver slices during the different kinetic studies, with no treatment cytotoxicity as shown by ATP and LDH dosages.
A: Percentage of ATP synthesis/total protein in non-infected (NINF) liver slice (LS) with F0-F1 to F4 stage fibrosis during the 21 days-follow up kinetics; B: The percentage of LDH release/control in NINF LS with a F0-F1 to F4 stage fibrosis during the 21d-follow up kinetics (d: days); C and D: The percentage of ATP synthesis /total protein in F0-F1 NINF and hepatitis C virus (HCV)-infected (INF) LS treated with 1 mmol/L, 5 mmol/L and 25 mmol/L of EtOH during the 21d-follow up kinetics; E: The percentage of ATP synthesis / total protein in the presence of 25 mmol/L of EtOH on F0-F1 NINF and INF LS during the 21d-follow up kinetics; F: LDH release (% of control) in F0-F1 non-infected LS cultures treated or non-treated with 25 mmol/L of EtOH compared to F4 non-infected treated or non-treated with 25 mmol/L of EtOH during the 21d-follow up kinetics. Values are expressed as means ± standard errors (SEMs), (n = 5). aP < 0.0001 time factor; bP < 0.01 fibrosis stage; cP < 0.05 fibrosis stage; dP < 0.05 alcohol factor; iP < 0.01 subject vs control (non-treated) (two-way ANOVA test).There is no significant toxic effect of EtOH (25 mmol/L) on F0-F1 NINF and INF LS and F2-F3, F4 NINF LS; G: The percentage of ATP synthesis/total protein during the 21-follow up kinetics showing the viability of F0-F1 NINF or INF LS cultures with or without the presence of palmitate (500 µmol/L); H and I: Absence of drug cytotoxicity (LDH release, (% of control) ) on the viability of human F0-F4 LS NINF or infected (INF) by HCVcc Con1/C3 during the treatment with either UCDA (UA) or Toco or both for 21 days. It is important to note that under 150%, there is no cytotoxic effect of the drugs on LS viability. Values are expressed as means ± SEMs, (n = 5); J and K: The percentage of ATP synthesis / total protein during the 21 days follow up kinetics, in F0-F1 to F4 NINF or infected (INF) LS with combined treatment [Toco + UCDA (UA)]. Values are expressed as means ± SEMs, (n = 5); Levels of significance are as follows between: Subject vs control, kP < 0.0001; jP < 0.001; iP < 0.01; hP < 0.05) (two-way ANOVA test).
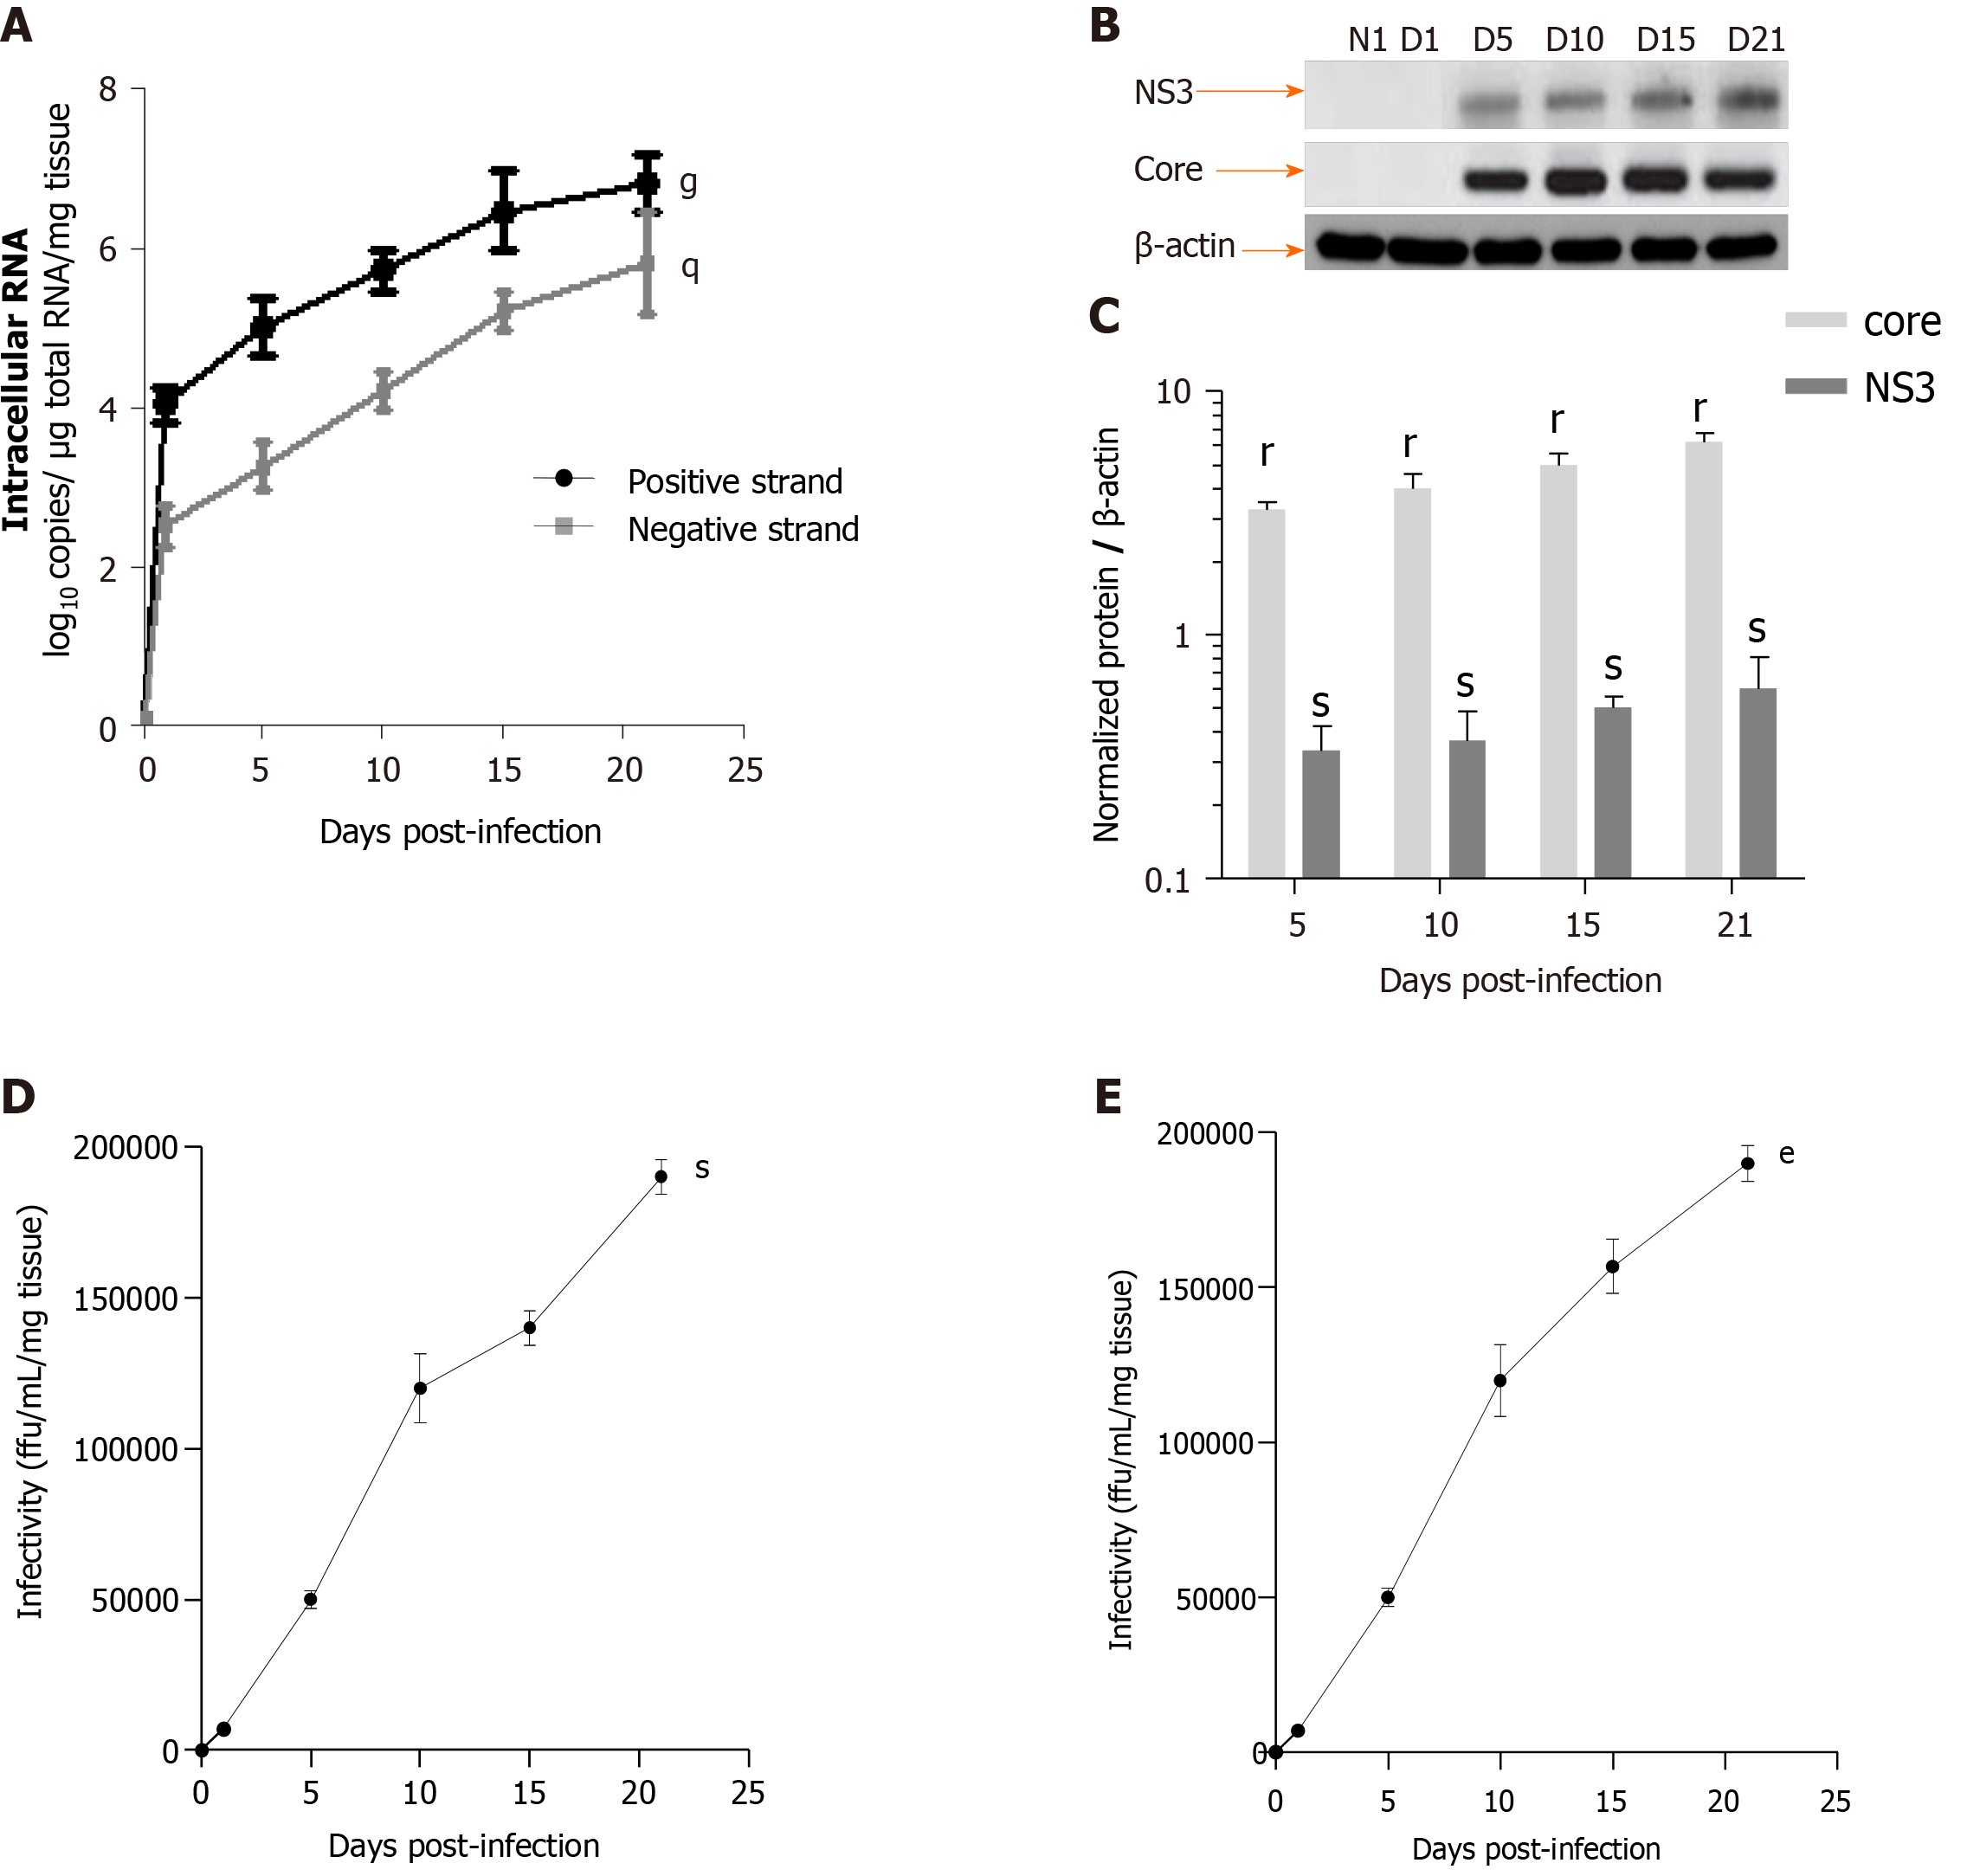
Figure 5 Efficient replication of hepatitis C virus RNA, and hepatitis C virus core and NS3 proteins expression in human F0-F1 liver slice culture as shown by real-time reverse transcription-quantitative polymerase chain reaction and western blotting analysis.
A: Quantification of intracellular levels of positive- and negative-strand hepatitis C virus (HCV) RNA (log10 copies/µg total RNA/mg tissue) in primary human F0-F1 HCVcc Con1/C3 -infected liver slice (LS) by specific- strand real-time reverse transcription-quantitative polymerase chain reaction on day 5, day 10, day 15 and day 21 post-infection. Values are expressed as mean ± SEMs. All results were compared using the two-paired Student t-test, time factor: Positive strand: gP < 0.01; negative strand: qP < 0.04, (n = 3). Detection of the negative strand of HCV RNA evidences active replication as well as an increase over time of both positive and negative strands of HCV RNA; B: Western blotting analysis of human F0-F1 HCVcc Con-1/C3 -infected LS lysates with mAbs against HCV NS3 or core proteins on day 5, day 10, day 15, and day 21, post-infection (MOI = 0.1) was performed and analyzed (n = 3). Lysates of naïve human F0-F1 LS lysates were run in parallel to serve as a negative controls (NI). β-actin was used as a loading control; C: Normalization of Core and NS3 protein expression compared to b-actin expression (Normalized protein / β-actin) during the 21 days follow-up kinetics using the image quantification standard software, ImageJ2[21]. The position of molecular-weight markers is indicated in kDa. Values are expressed as means ± SEMs (n = 3): Core rP < 0.002; NS3 sP < 0.02 (two-paired Student t-test); D: Production of HCV infectious particles (genotype 1b) in primary adult human F0-F1 LS: Infectivity titers [i.e., infectivity (ffu/mL/mg tissue)] of culture supernatants from human F0-F1 LS infected by the Con1/C3 virus during the 21 days follow up kinetics. The curve represents the average of three independent infections from 3 different donors. Each kinetic study was performed in triplicate. Values are expressed as means ± SEMs. Results were compared using the two-paired Student t-test: sP < 0.02; and E: Infectivity titers [i.e., infectivity (ffu/mL/mg tissue)] of culture supernatants of naive F0-F1 LS infected with supernatants from human F0- F1 HCV-infected LS culture (HCVpc) during the 21 days follow up kinetics. The infection of naive F0-F1 LS with supernatants from human F0-F1 HCV-infected LS culture (HCVpc) clearly indicates the infectivity of extracellular viral particles, which are produced by HVCcc Con1/ C3 (genotype 1b) infection. Values are expressed as means ± SEMs (n = 3). Levels of significance: eP < 0.001 (two-paired Student t-test).
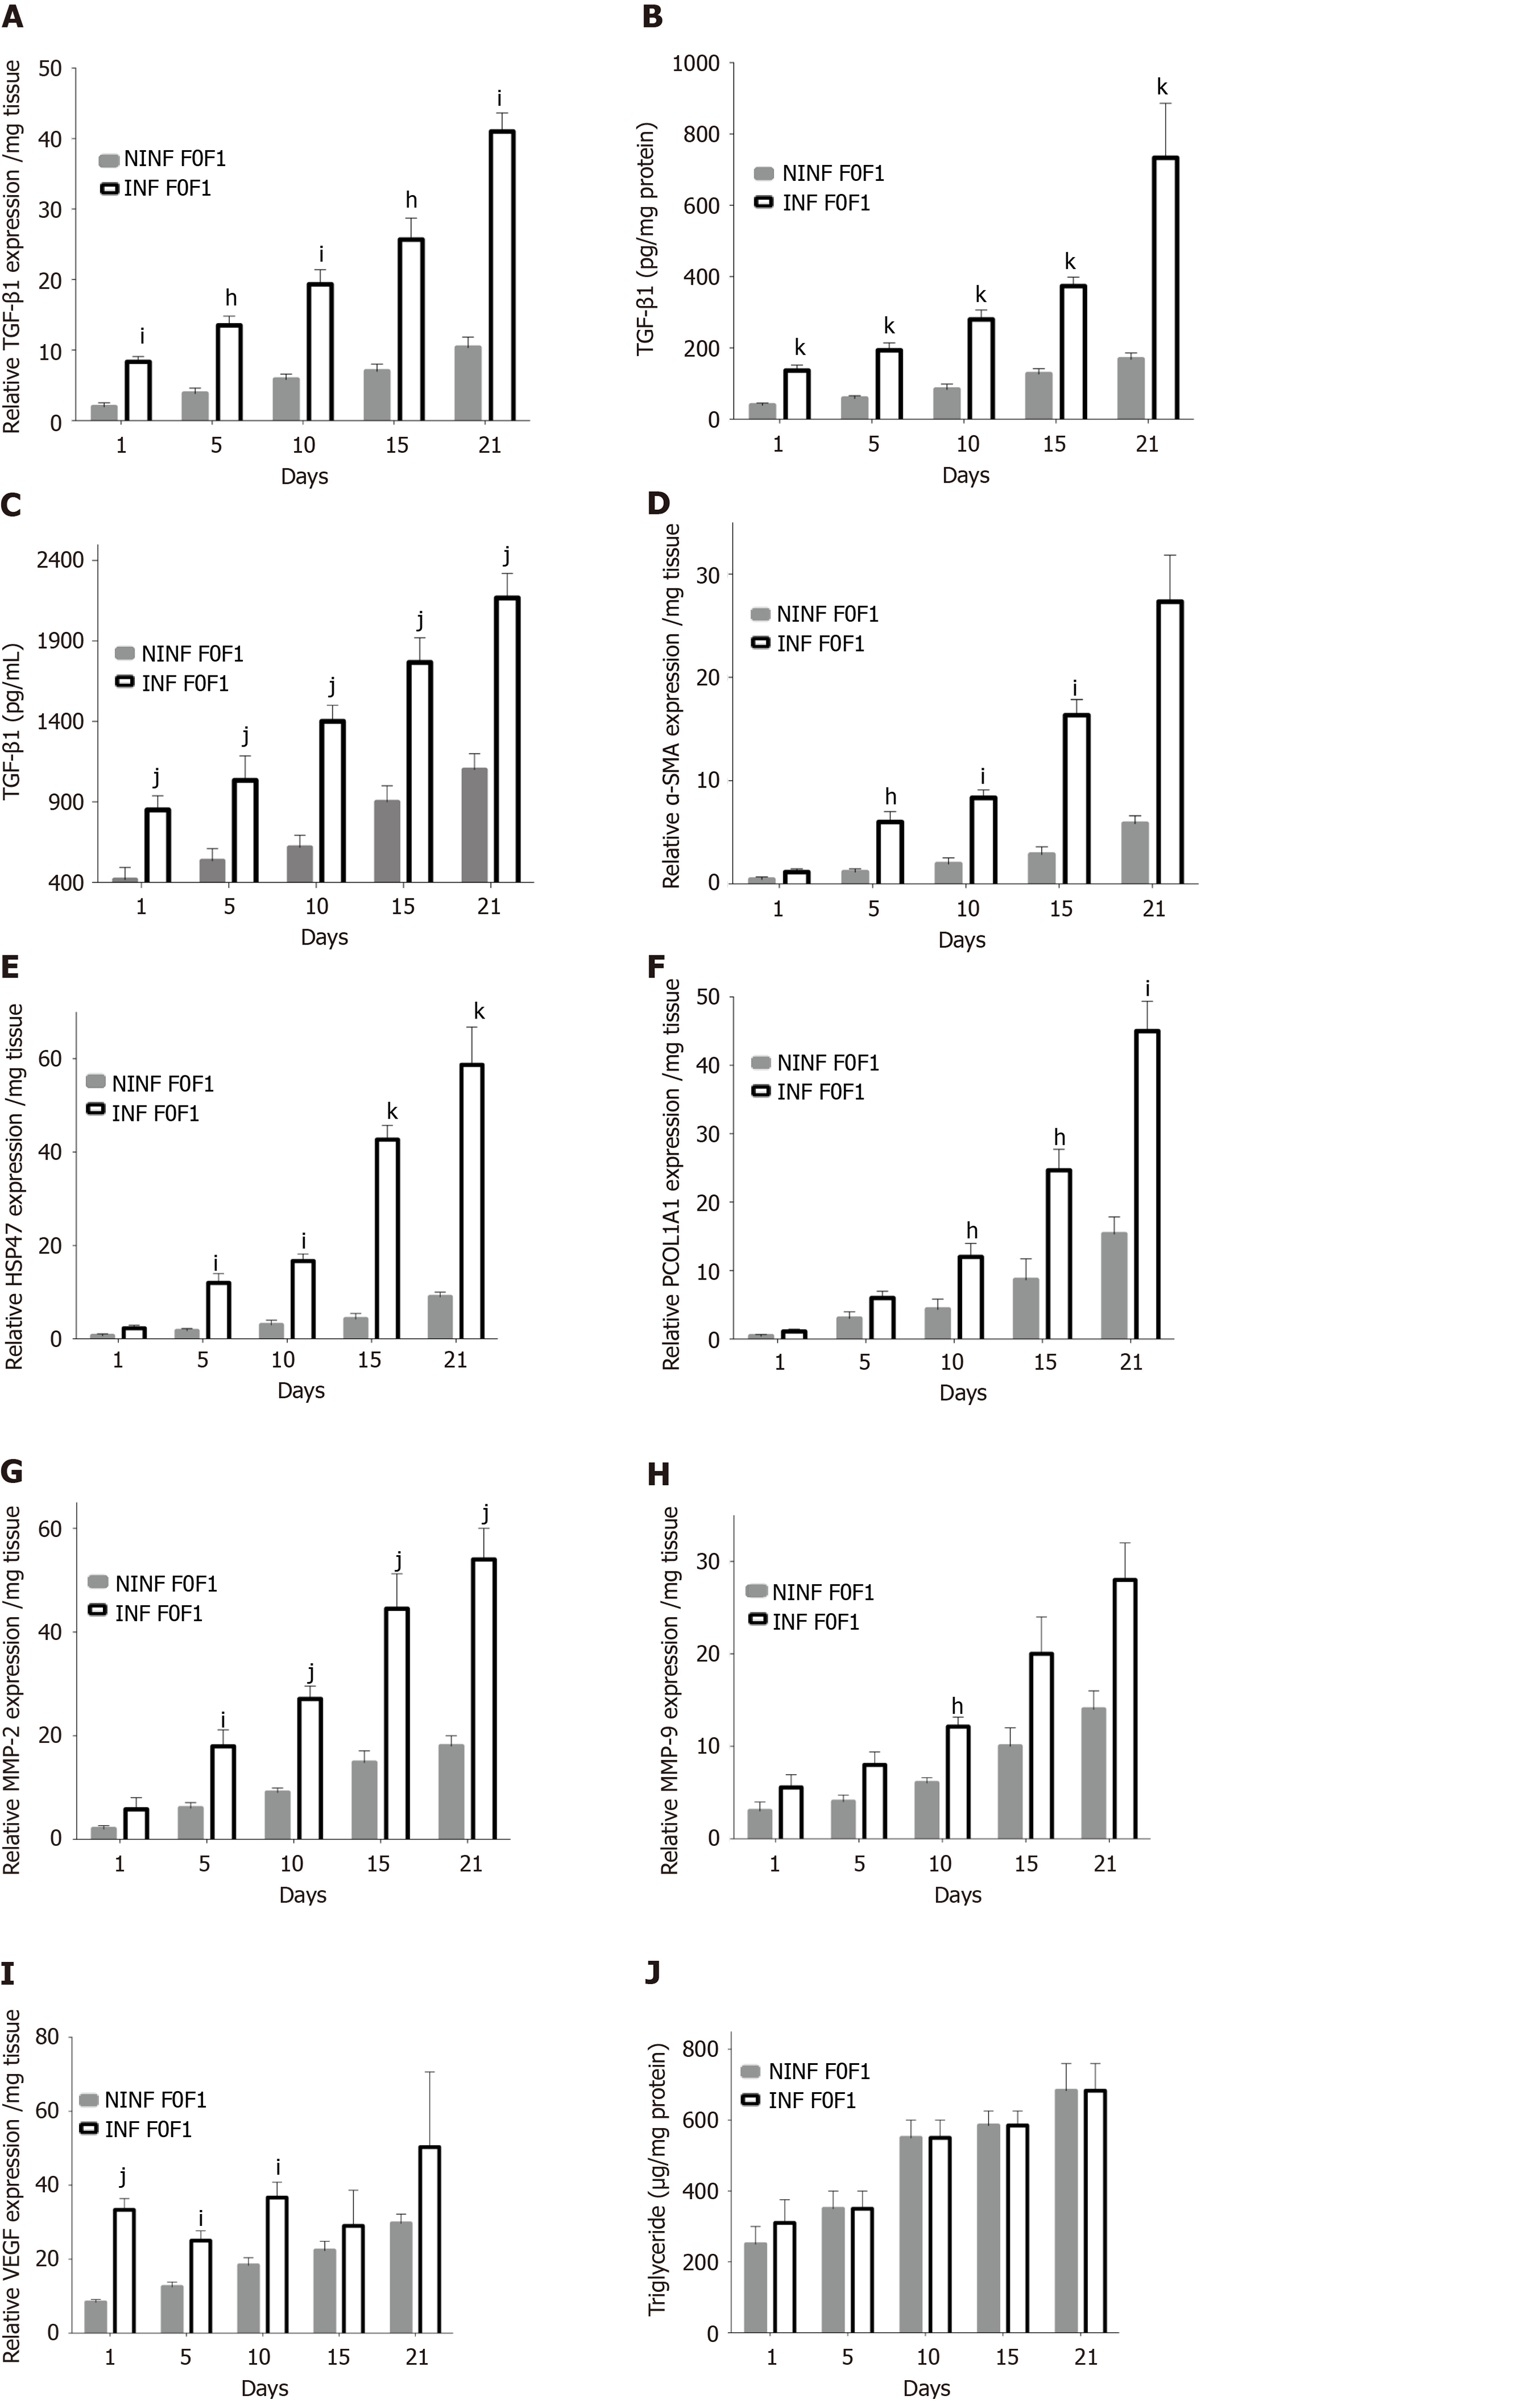
Figure 6 Real-time reverse transcription-quantitative polymerase chain reaction analysis evidencing the significant increase of fibrosis markers expression at the transcriptional level in human F0-F1 non-infected or hepatitis C virus infected liver slice during the kinetics.
A: TGF-β1 expression at mRNA level (relative RNA expression / mg tissue) during 21 days follow up kinetics; B: TGF-β1 expression at intracellular protein level (pg/mg protein) during 21 days follow up kinetics; C: TGF-β1 expression at extracellular secretion level (pg/mL) during 21 days follow up kinetics; D-F: mRNA expression (relative RNA expression / mg tissue) of (D) α-SMA, HSP47 (E) and ProCOL1A1 (F) during 21 days follow up kinetics; G and H: MMP-2 and MMP-9 mRNA expression (relative RNA expression / mg tissue) during 21 days follow up kinetics; I: VEGF mRNA expression (relative RNA expression/mg tissue) during 21 days follow up kinetics; J: Triglyceride production (µg/mg protein) raised during the during the 21 days follow up kinetics. All data are presented considering the percentage of viable liver slices in culture. Data are expressed as means ± SD (n = 5), subject vs control, hP < 0.05; iP < 0.01; jP < 0.001; kP < 0.0001, (two-way ANOVA test).
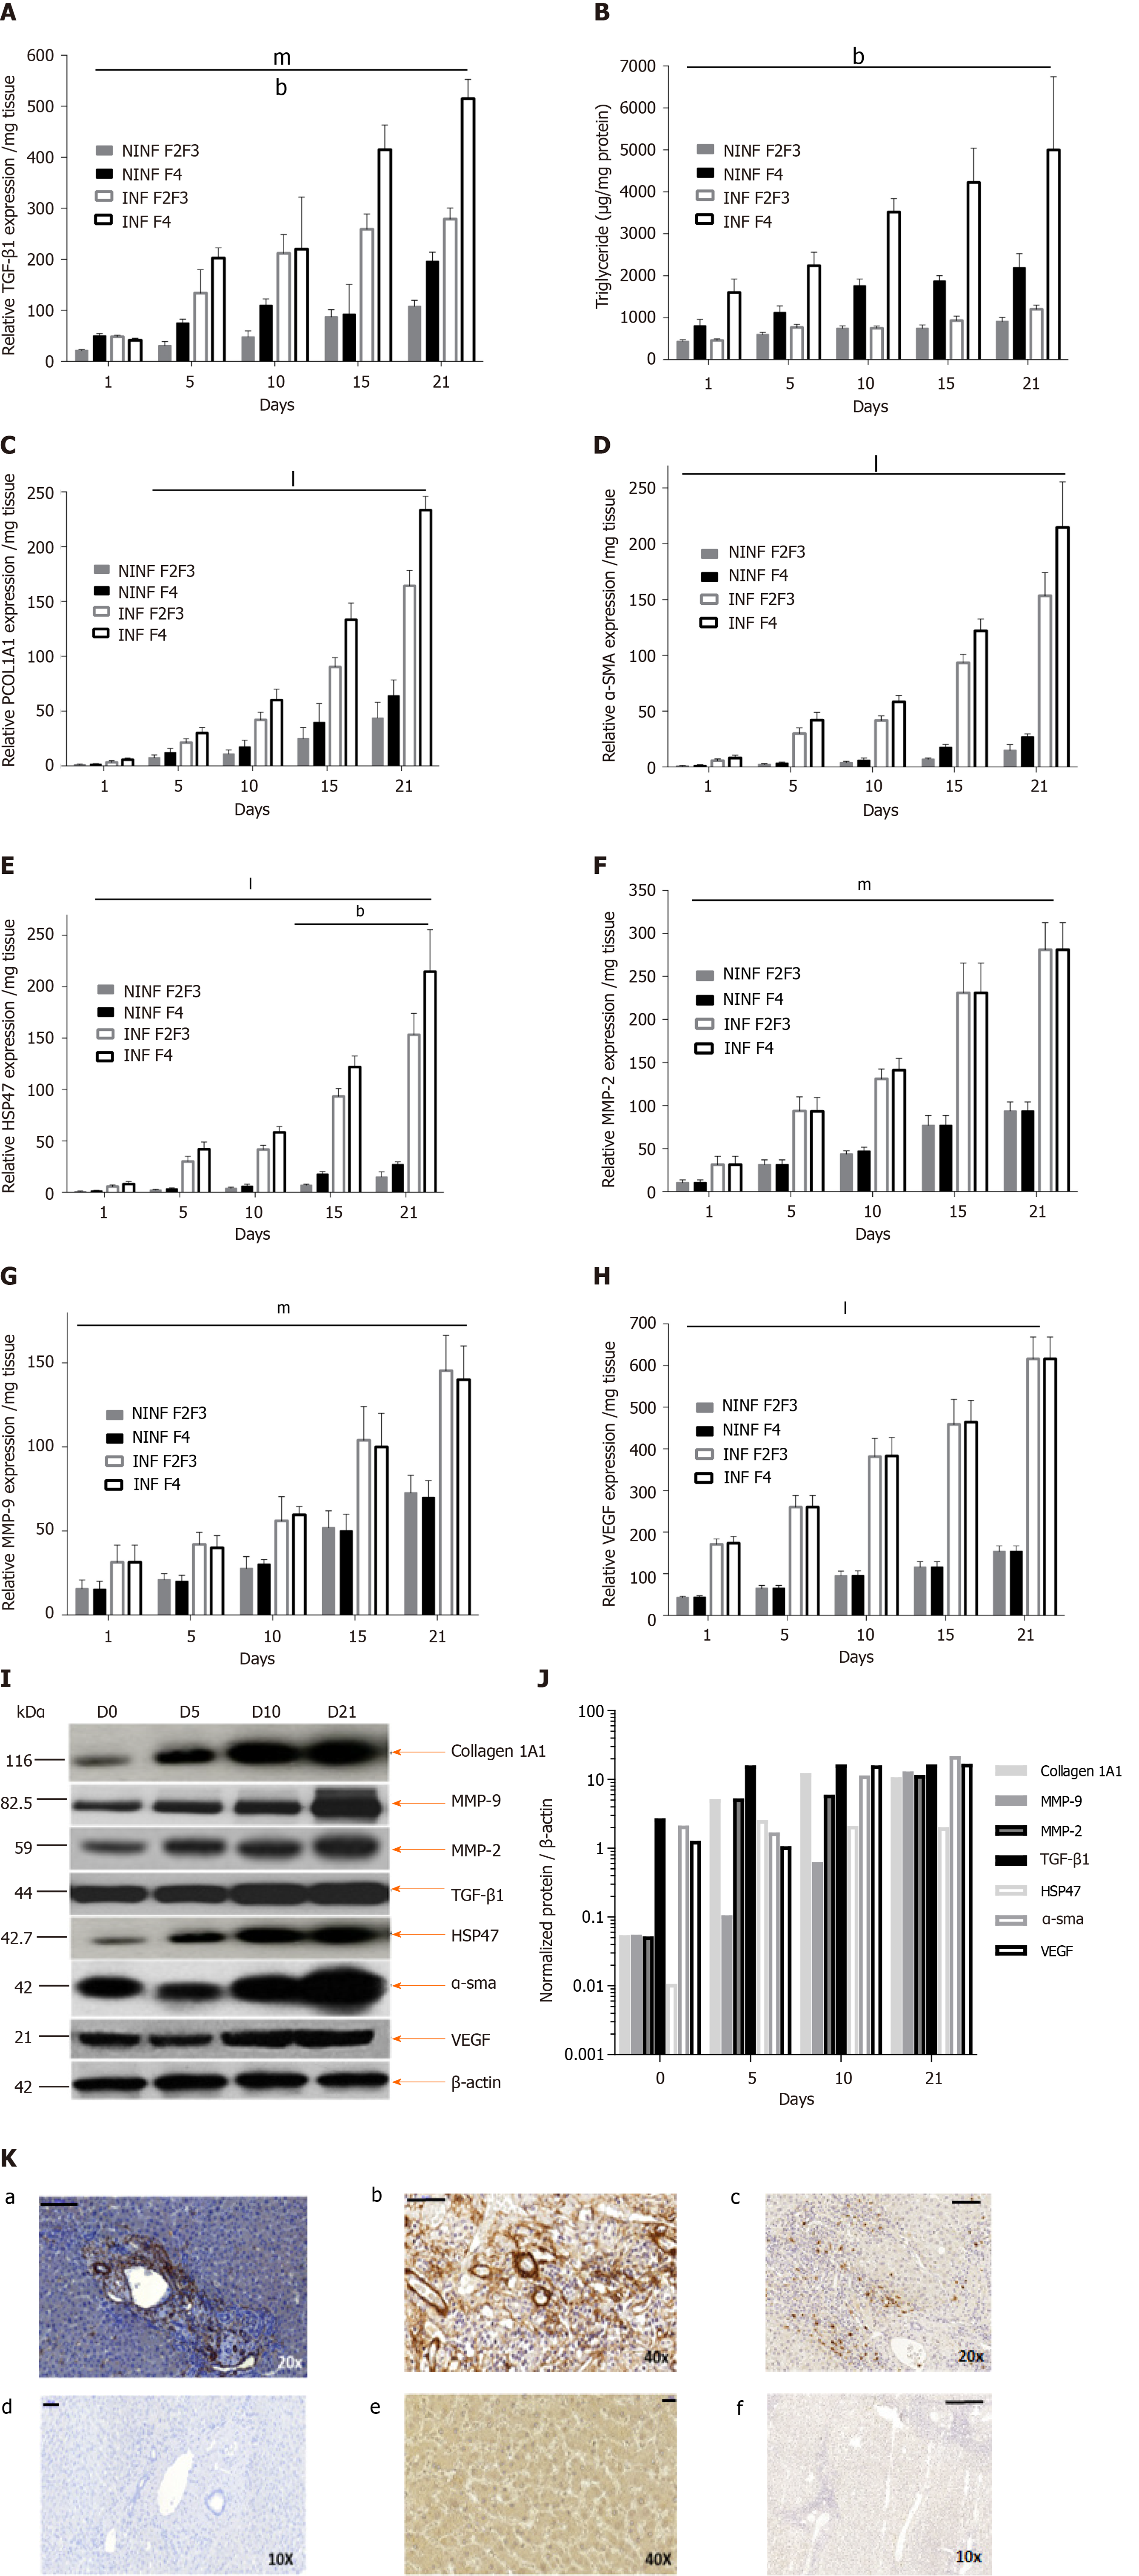
Figure 7 Real-time reverse transcription-quantitative polymerase chain reaction analyses of RNA expression of liver fibrosis markers (TGF-β1, Procol1A1, α-SMA, HSP47, MMP-2, MMP-9, VEGF), and triglyceride production in non-infected or hepatitis C virus infected liver slice cultures from fibrotic liver (F2-F3, F4) showing a significant increase during the kinetics.
A: TGF-β1 mRNA Expression (relative RNA expression/mg tissue) during 21 days follow up kinetics; B: Triglyceride production (µg/mg protein); C–E: Procol1A1, α-SMA, HSP47 mRNA expression (relative RNA expression / mg tissue) during 21 days follow up kinetics; F- H: MMP-2, MMP-9 and VEGF mRNA expression (relative RNA expression/mg tissue) during 21 days follow up kinetics. Data are expressed as mean± SD (F2-F3 liver samples, n = 2, F4 liver samples, n = 2). bP < 0.01 fibrosis stage factor; mP < 0.001 Infection factor; lP < 0.0001 infection factor; (two-way ANOVA test); I: TGF-β1, HSP-47, Collagen I alpha 1, MMP-9, MMP-2, a-SMA, VEGF proteins expression in F2-F3 liver slice performed in western blotting and normalized. Positions of molecular-weight markers are indicated in kDa; J: Normalization of the proteins expression compared to β-actin expression (Normalized protein/b-actin) during the 21 days follow-up kinetics using the image quantification standard software, ImageJ2; and K: Representative human liver tissue 7 µm-thick sections from F2-F3 liver patient showing immunohistochemistry staining for fibrosis markers, TGF-β1 (a), α-SMA (b), MMP-9 (c) on day 10, magnification 20×, Scale bars, 100 µm; 40×, Scale bars 50 µm; 10×, Scale bars 100 µm, respectively. (d-f) isotypes controls staining, magnification 10×, Scale bars, 100 µm; 40×, Scale bars 20 µm; 10×, Scale bars 200 µm, respectively.
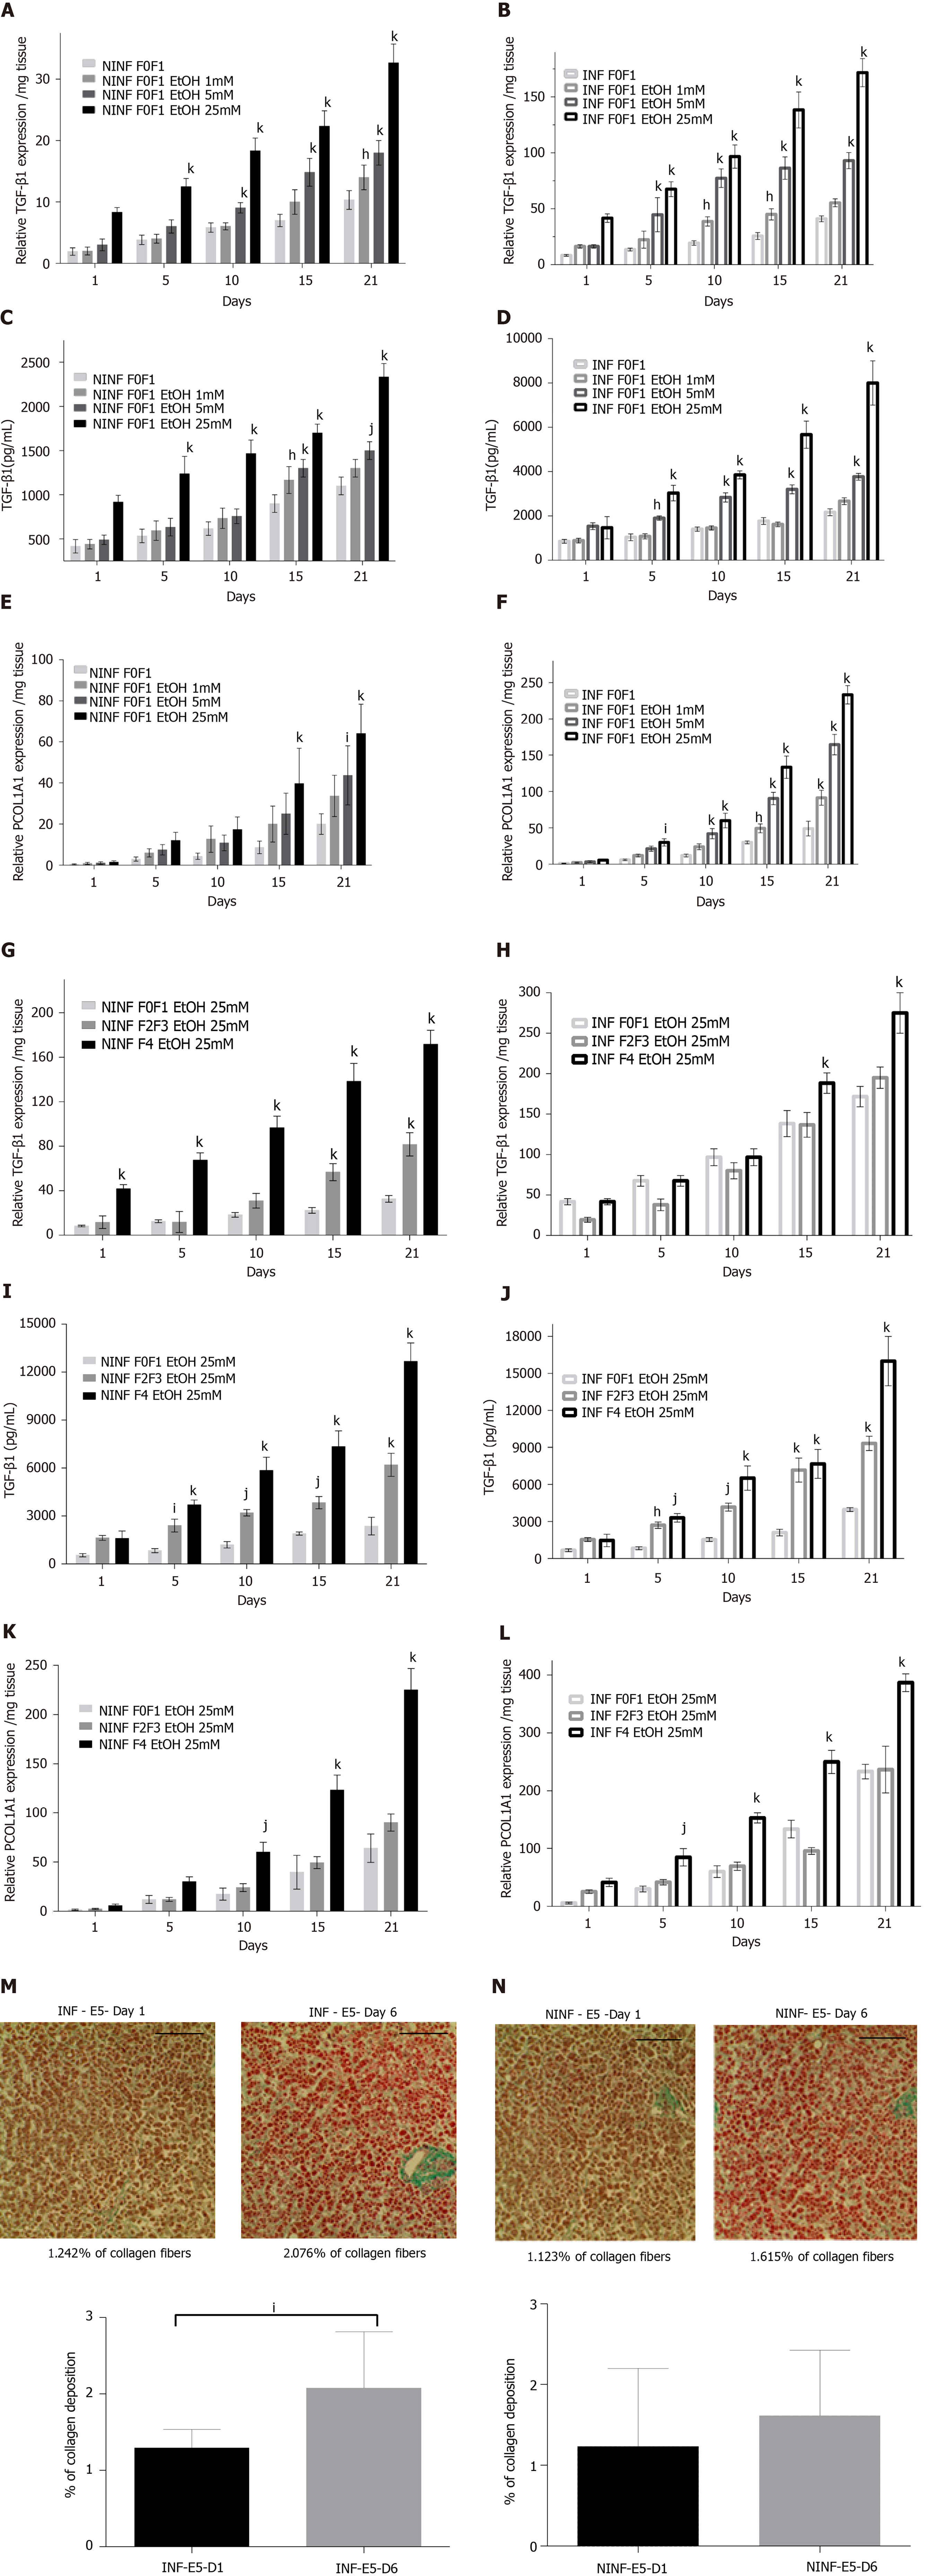
Figure 8 Significant increased expression of TGF-β1 and Procol1A1 mRNA with ethanol (1 mmol/L, 5 mmol/L, 25 mmol/L) treatment of non-infected or hepatitis C virus INF liver slice cultures from non-fibrotic (F0-F1) and ethanol (25 mmol/L) treatment of non-infected or hepatitis C virus infected liver slice cultures from fibrotic (F2-F3, F4) liver samples as shown by real-time reverse transcription-quantitative polymerase chain reaction and ELISA and histochemistry.
A and B: TGF-β1 mRNA expression (relative RNA expression / mg tissue) during 21 days follow up kinetics with ethanol (EtOH) (1 mmol/L, 5 mmol/L, 25 mmol/L) treatment in non-infected (NINF) or hepatitis C virus (HCV) INF liver slice (LS) cultures from non-fibrotic (F0-F1); C and D: Extracellular TGF-β1 protein expression (pg/mL) during 21 days follow up kinetics, with EtOH (1 mmol/L, 5 mmol/L, 25 mmol/L) treatment of NINF or HCV INF LS cultures from non-fibrotic (F0-F1); E and F: Procol1A1 mRNA expression (relative RNA expression/mg tissue) during 21 days follow up kinetic, with EtOH (1 mmol/L, 5 mmol/L, 25 mmol/L) treatment of NINF or HCV INF LS cultures from non-fibrotic (F0-F1); G and H: TGF-β1 mRNA expression (relative RNA expression/mg tissue) during 21 days follow up kinetics, in fibrotic (F2-F3, F4) NINF and HCV INF LS treated with 25 mmol/L of EtOH compared to F0F1 NINF or HCV INF LS cultures in presence of the 25 mmol/L EtOH; I and J: Extracellular TGF-β1 protein expression (pg/mL) during 21 days follow up kinetics, in fibrotic (F2-F3, F4) NINF and HCV INF LS after treatment with 25 mmol/L of EtOH compared to F0F1 NINF or HCV INF LS cultures in presence of 25 mmol/L EtOH; K and L: Relative Procol1A1 mRNA expression (relative RNA expression/mg tissue) during 21 days follow up kinetics, in fibrotic (F2-F3, F4) NINF and HCV INF LS treated with 25 mmol/L of EtOH compared to F0F1 NINF or HCV INF LS cultures in presence of 25 mmol/L EtOH. Data are expressed as means ± SEM (F0-F1, n = 5; F2-F3, n = 2; F4, n = 2). kP < 0.0001 subject vs control (non-treated); jP < 0.001 subject vs control (non-treated); iP < 0.01 subject vs control (non-treated), hP < 0.05 subject vs control (non-treated) (two-way ANOVA test); M: Significant increase of collagen deposition (% of collagen deposition) in F0-F1 HCV INF LS treated with 5 mmol/L of EtOH (E5) on day 6 (D6) compared to day 1 (D1); N: No significant change of collagen deposition (% of collagen deposition) in F0-F1 non-infected (NINF) LS treated with 5 mmol/L of EtOH (E5) on day 6 (D6) compared to day 1 (D1). Data are expressed as means ± SEM (n = 8). iP < 0.01 subject vs control (non-treated), (unpaired two-tailed Student’s t-test). Magnification 20X, Scale bars 100 µm.
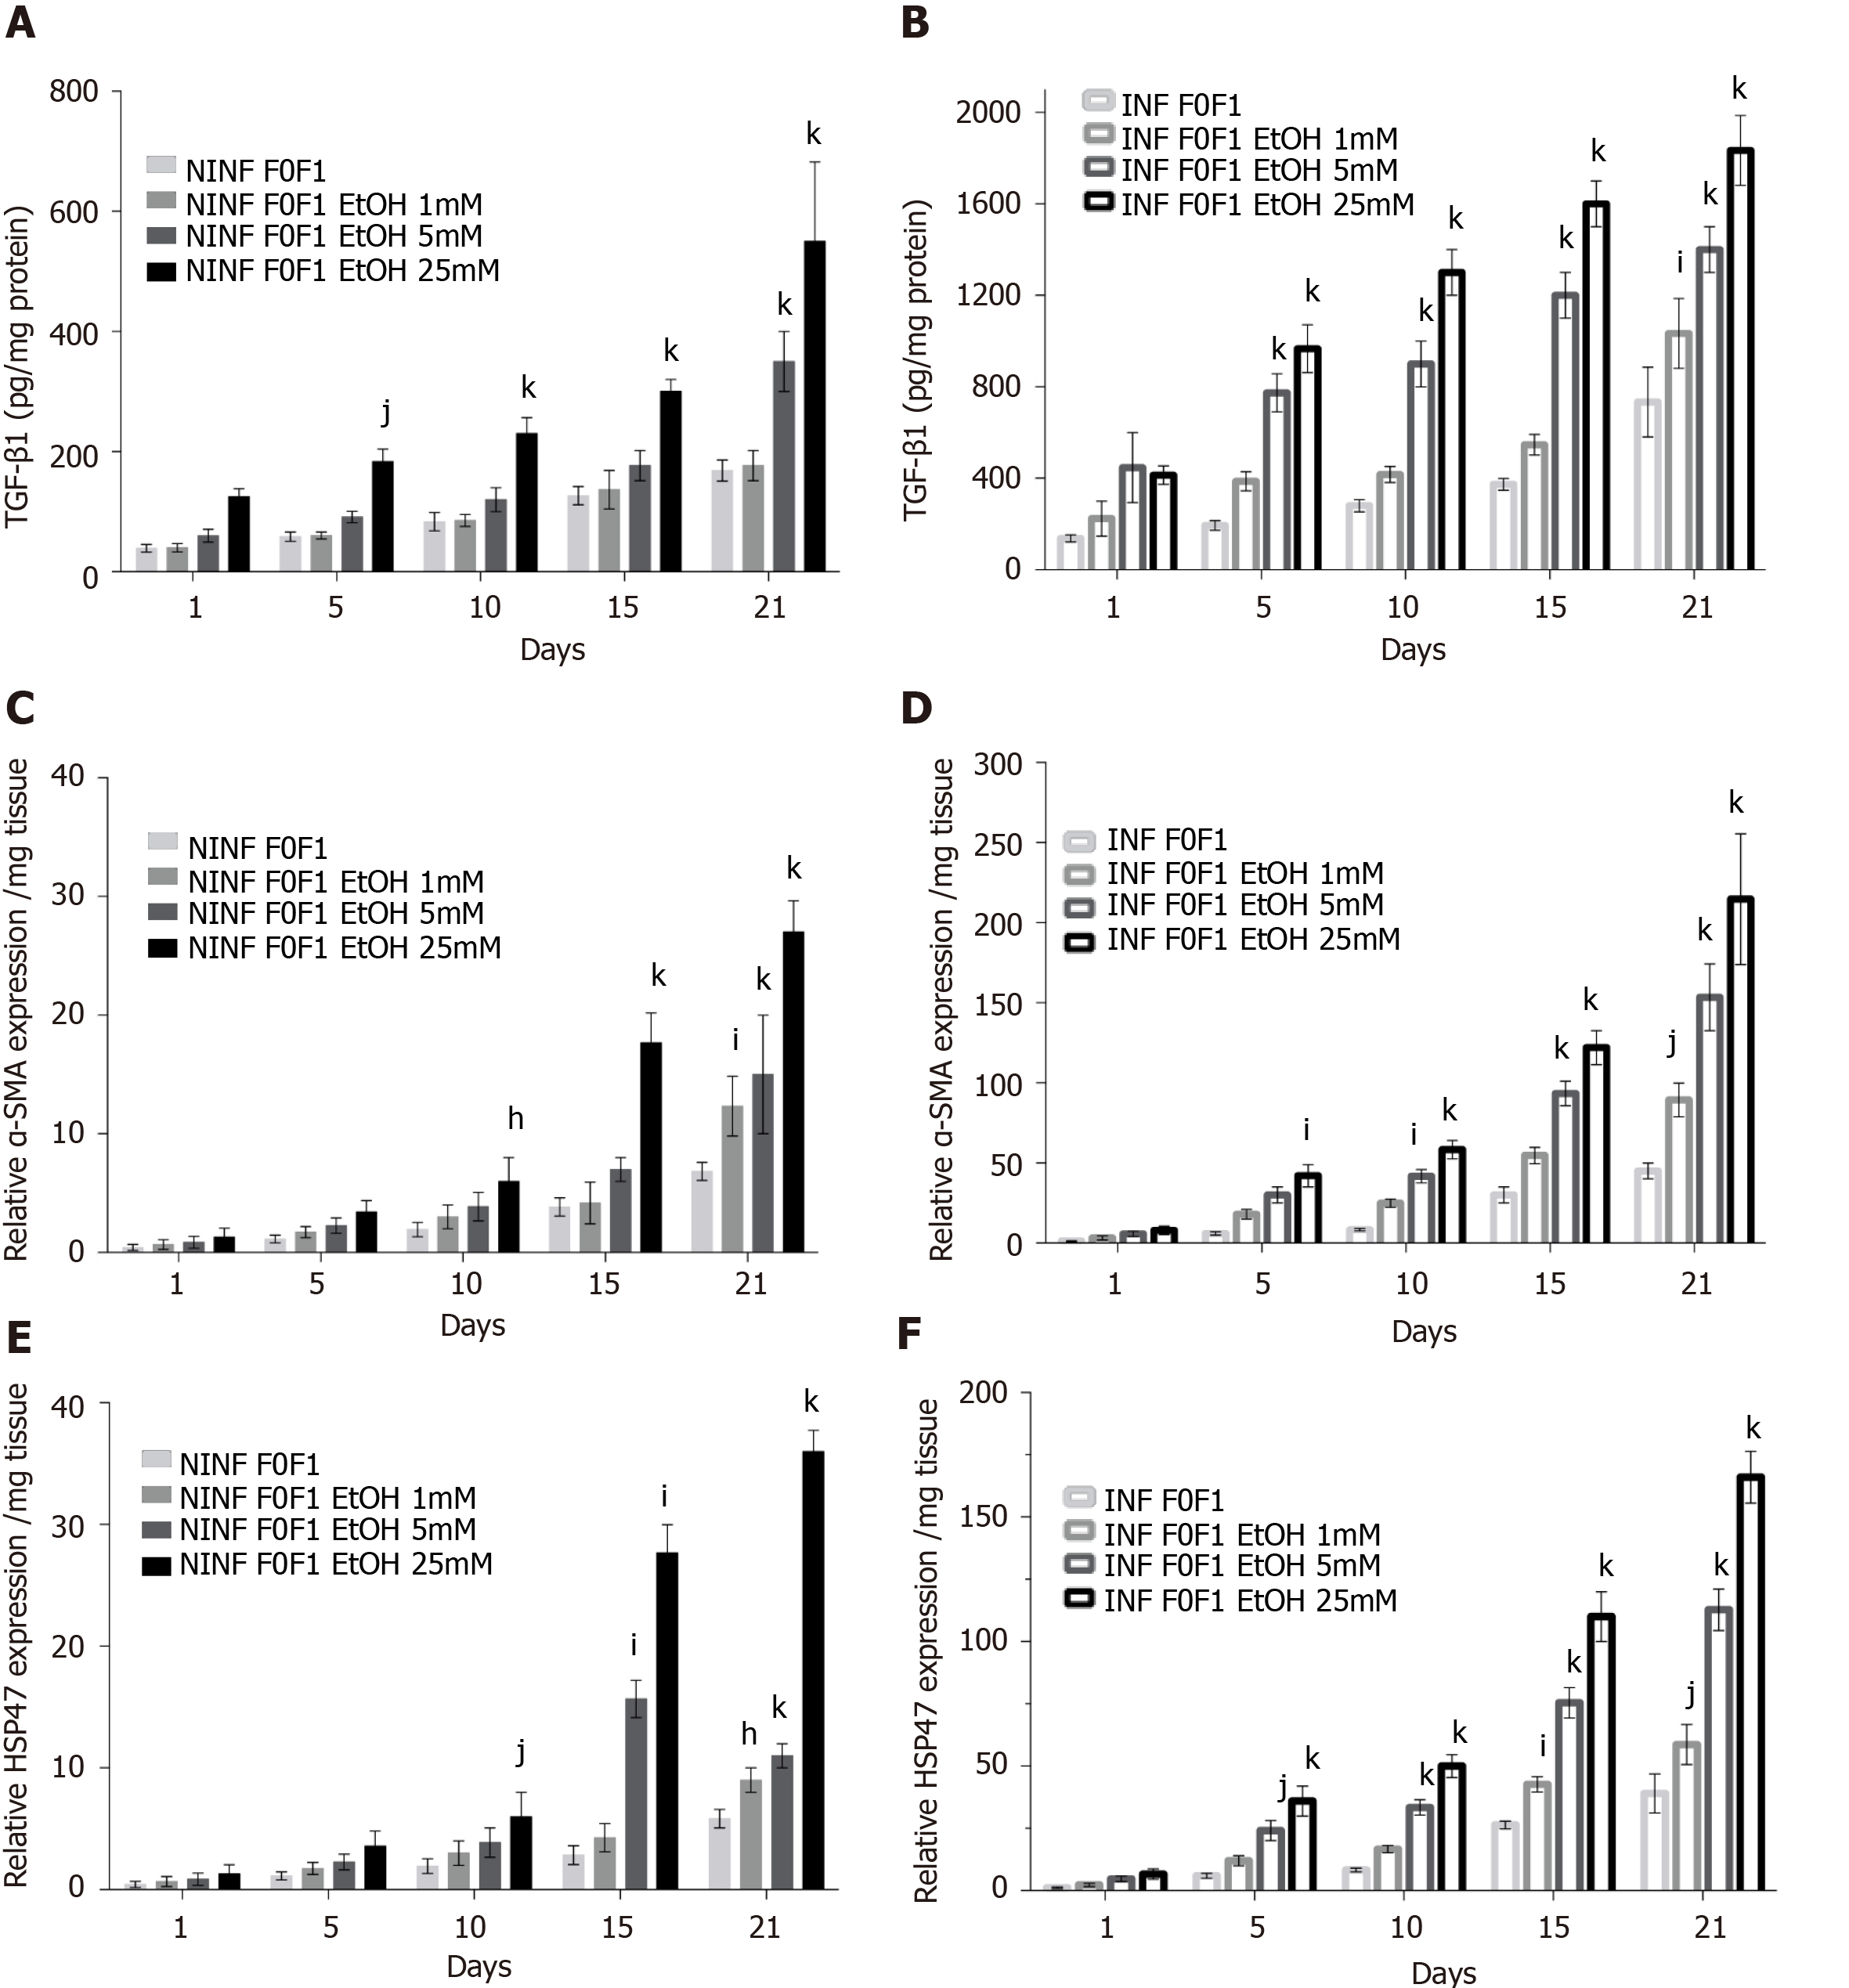
Figure 9 Significantly increase in TGF-β1 protein and RNA expression of α-SMA, and HSP47 in non-infected or hepatitis C virus-infected non-fibrotic (F0-F1) liver slice cultures treated with 1 mmol/L, 5 mmol/L and 25 mmol/L of ethanol was shown by enzyme-linked immunosorbent assay and real-time reverse transcription-quantitative polymerase chain reaction analyses.
A and B: TGF-β1 intracellular protein expression (pg/mg protein) during 21 days follow up kinetics, in non-infected (A) and hepatitis C virus (HCV)-infected (B) F0-F1 liver slice (LS) cultures, treated with 1 mmol/L, 5 mmol/L, 25 mmol/L of ethanol (EtOH); C and D: Relative α-SMA RNA expression level (relative RNA expression/mg tissue) during 21 days follow up kinetics, in non-infected (C) and HCV-infected (D) F0-F1 LS cultures treated with 1 mmol/L, 5 mmol/L, 25 mmol/L of EtOH; E and F: Relative HSP47 RNA expression level expression (relative RNA expression / mg tissue) during 21 days follow up kinetics, in non-infected (E) and HCV-infected (F) F0-F1 LS cultures treated with 1 mmol/L, 5 mmol/L, 25 mmol/L of EtOH. All presented data take into account the viability of the liver slice cultures. Values are expressed as means ± SEMs (n = 5); Levels of significance: kP < 0.0001 subject vs control (non-treated); jP < 0.001 subject vs control (non-treated); iP < 0.01 subject vs control (non-treated), hP < 0.05 subject vs control (non-treated) (two-way ANOVA test).
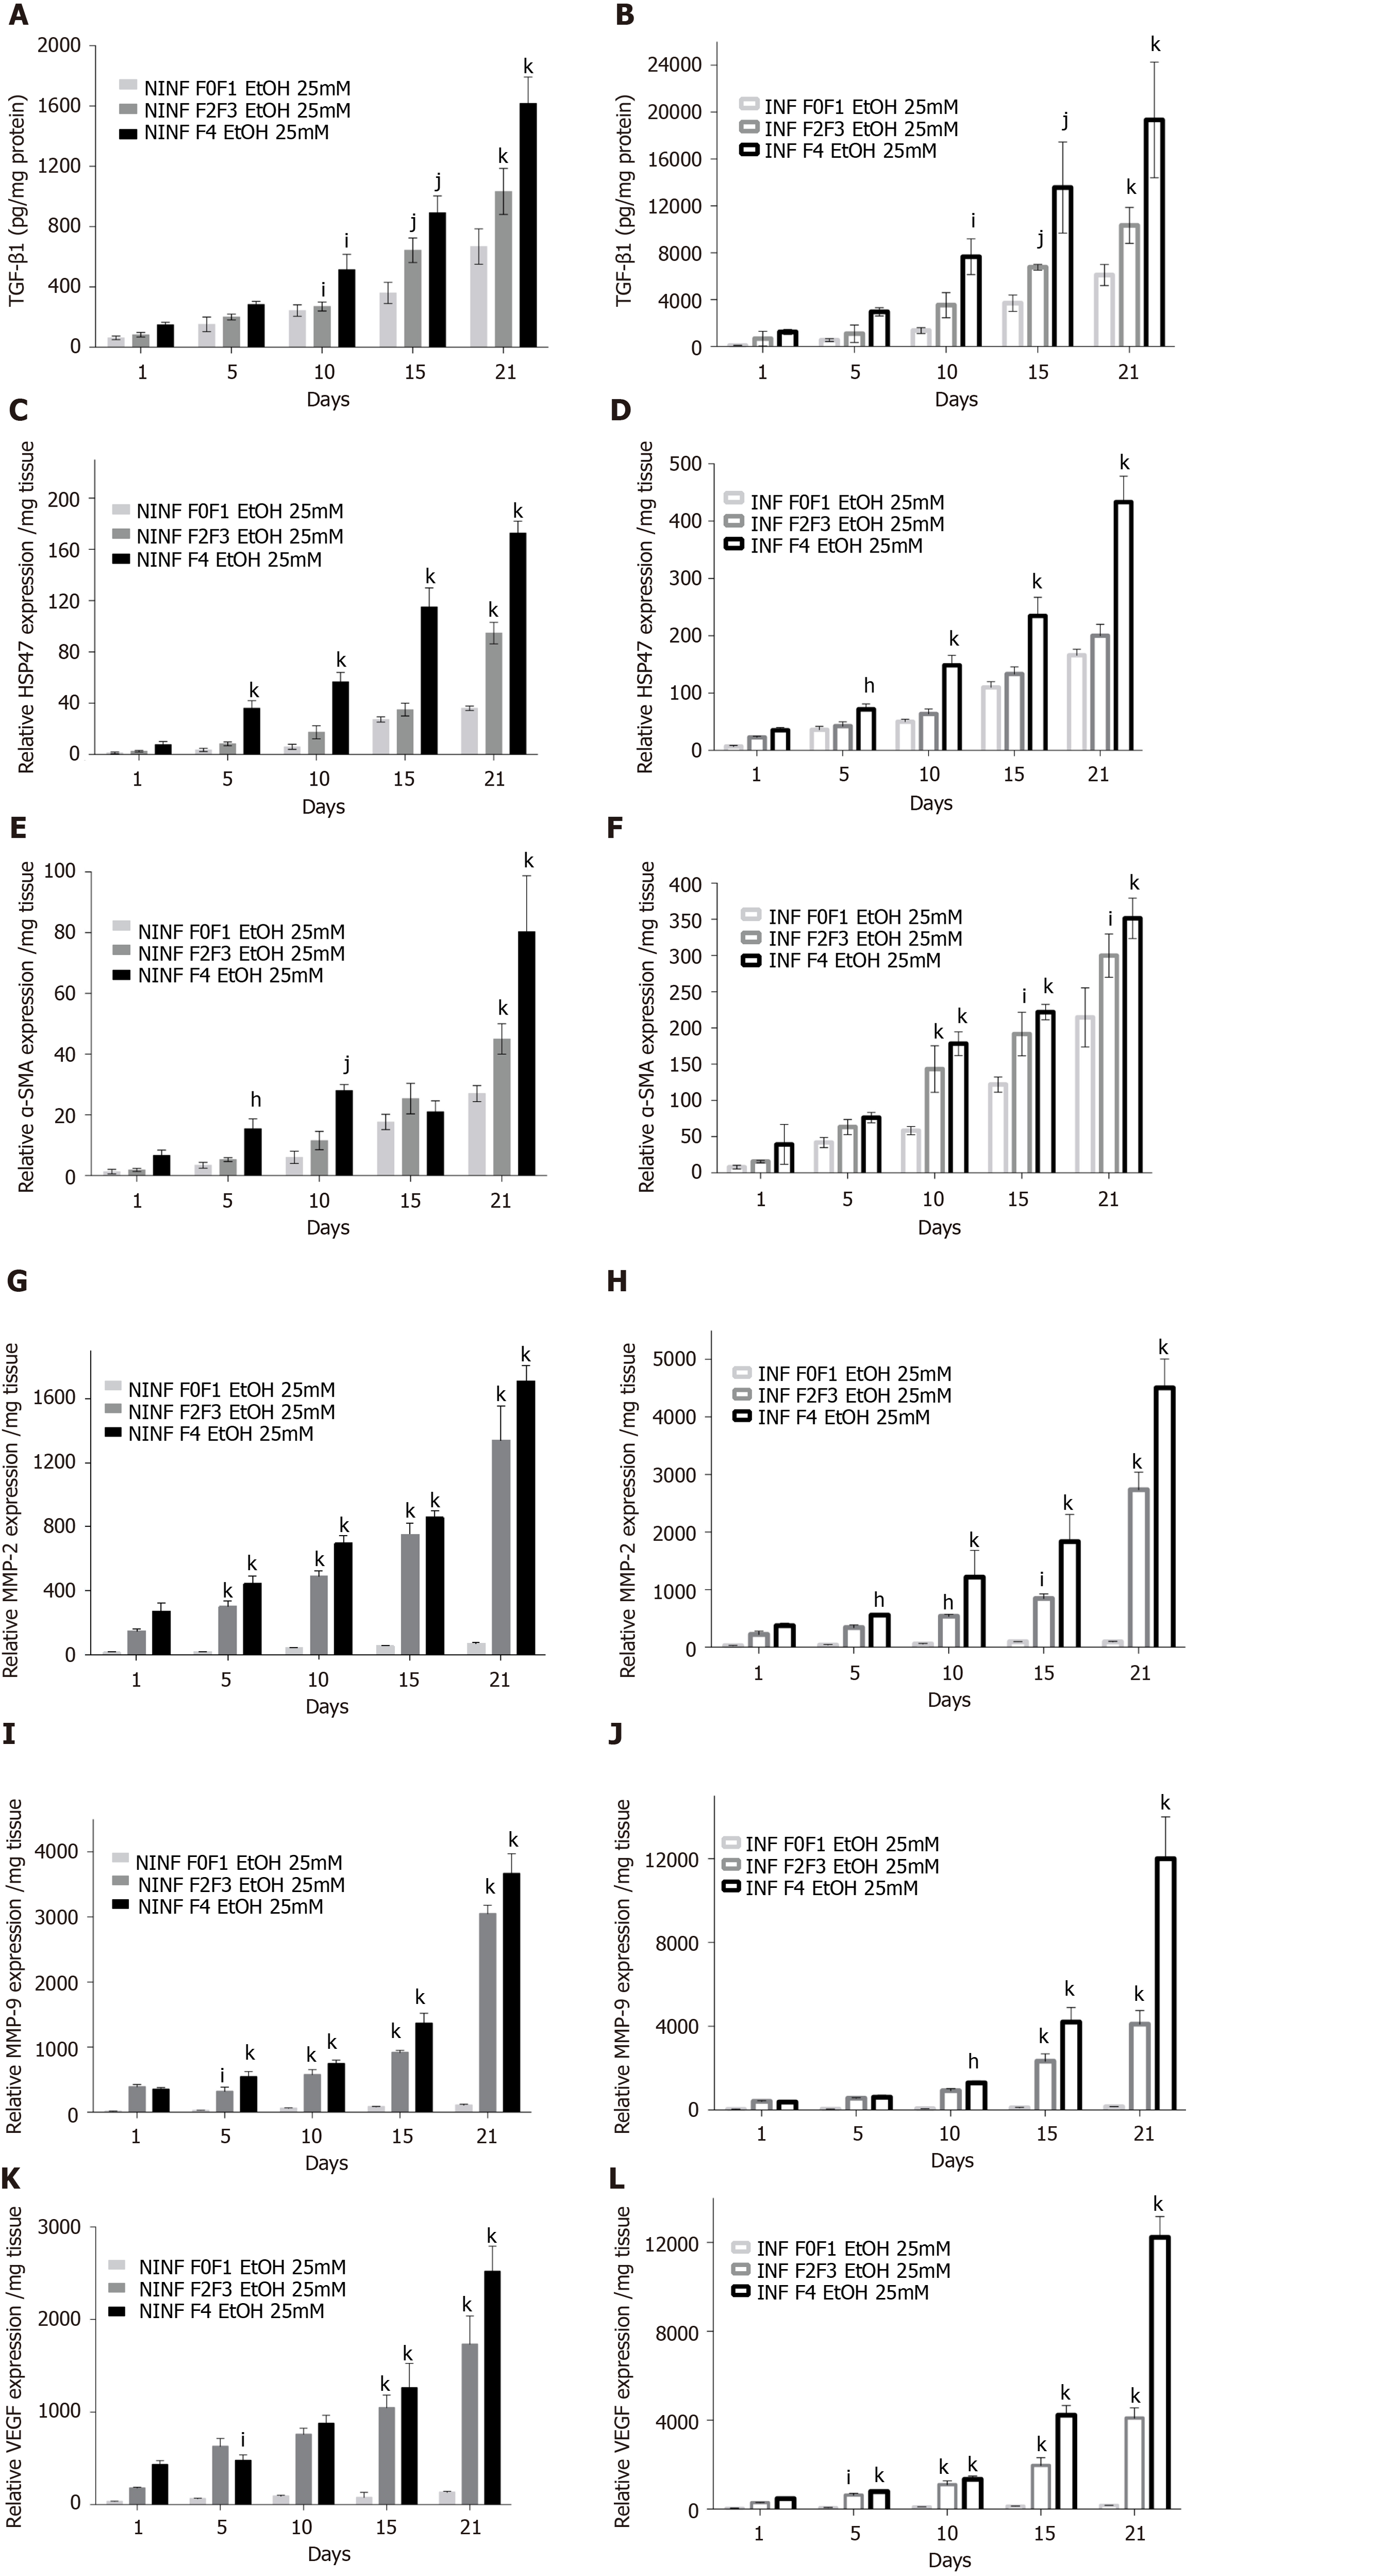
Figure 10 By real-time reverse transcription-quantitative polymerase chain reaction and enzyme-linked immunosorbent assay, significantly increase of TGF-β1 protein and RNA expression of fibrosis biomarkers HSP47, α-SMA, MMP- 2, MMP-9, VEGF increased in non-infected or hepatitis C virus-infected liver slice cultures from stages F0-F1 to stage F4 treated with 25 mmol/L of ethanol.
A and B: TGF-β1 intracellular protein expression (pg/mg protein) during the 21 days follow up kinetics, in F0-F1 to F4 non-infected (A) and hepatitis C virus (HCV)-infected (B) liver slice (LS), treated with 25 mmol/L of ethanol (EtOH); C and D: Relative HSP47 RNA expression (relative RNA expression/mg tissue) during the 21 days follow up kinetics, in F0-F1 to F4 non-infected (C) and HCV infected (D) LS treated with 25 mmol/L of EtOH; E and F: Relative α-SMA RNA expression (relative RNA expression / mg tissue) during the 21 days follow up kinetics, in F0-F1 to F4 non-infected (E) and HCV-infected (F) LS treated with 25 mmol/L of EtOH; G and H: Relative MMP-2 RNA expression (relative RNA expression / mg tissue) during the 21 days follow up kinetics, in F0-F1 to F4 non-infected (G) and HCV-infected (H) LS cultures treated with 25 mmol/L of EtOH; I and J: Relative MMP-9 RNA expression (relative RNA expression / mg tissue) during the 21 days follow up kinetics, in F0-F1 to F4 non-infected (I) and HCV-infected (J) LS treated with 25 mmol/L of EtOH; K and L: Relative VEGF RNA expression (relative RNA expression/mg tissue) during the 21 days follow up kinetics, in F0-F1 to F4 non-infected (K) and HCV-infected (L) LS cultures treated with 25 mmol/L of EtOH. Values are expressed as mean ± SEMs (F0-F1: n = 5; F2-F3, n = 2; F4, n = 2). kP < 0.0001 subject vs control (F0-F1); jP < 0.001 subject vs control (F0-F1); iP < 0.01 subject vs control (F0-F1), hP < 0.05 subject vs control (F0-F1) (two-way ANOVA test).
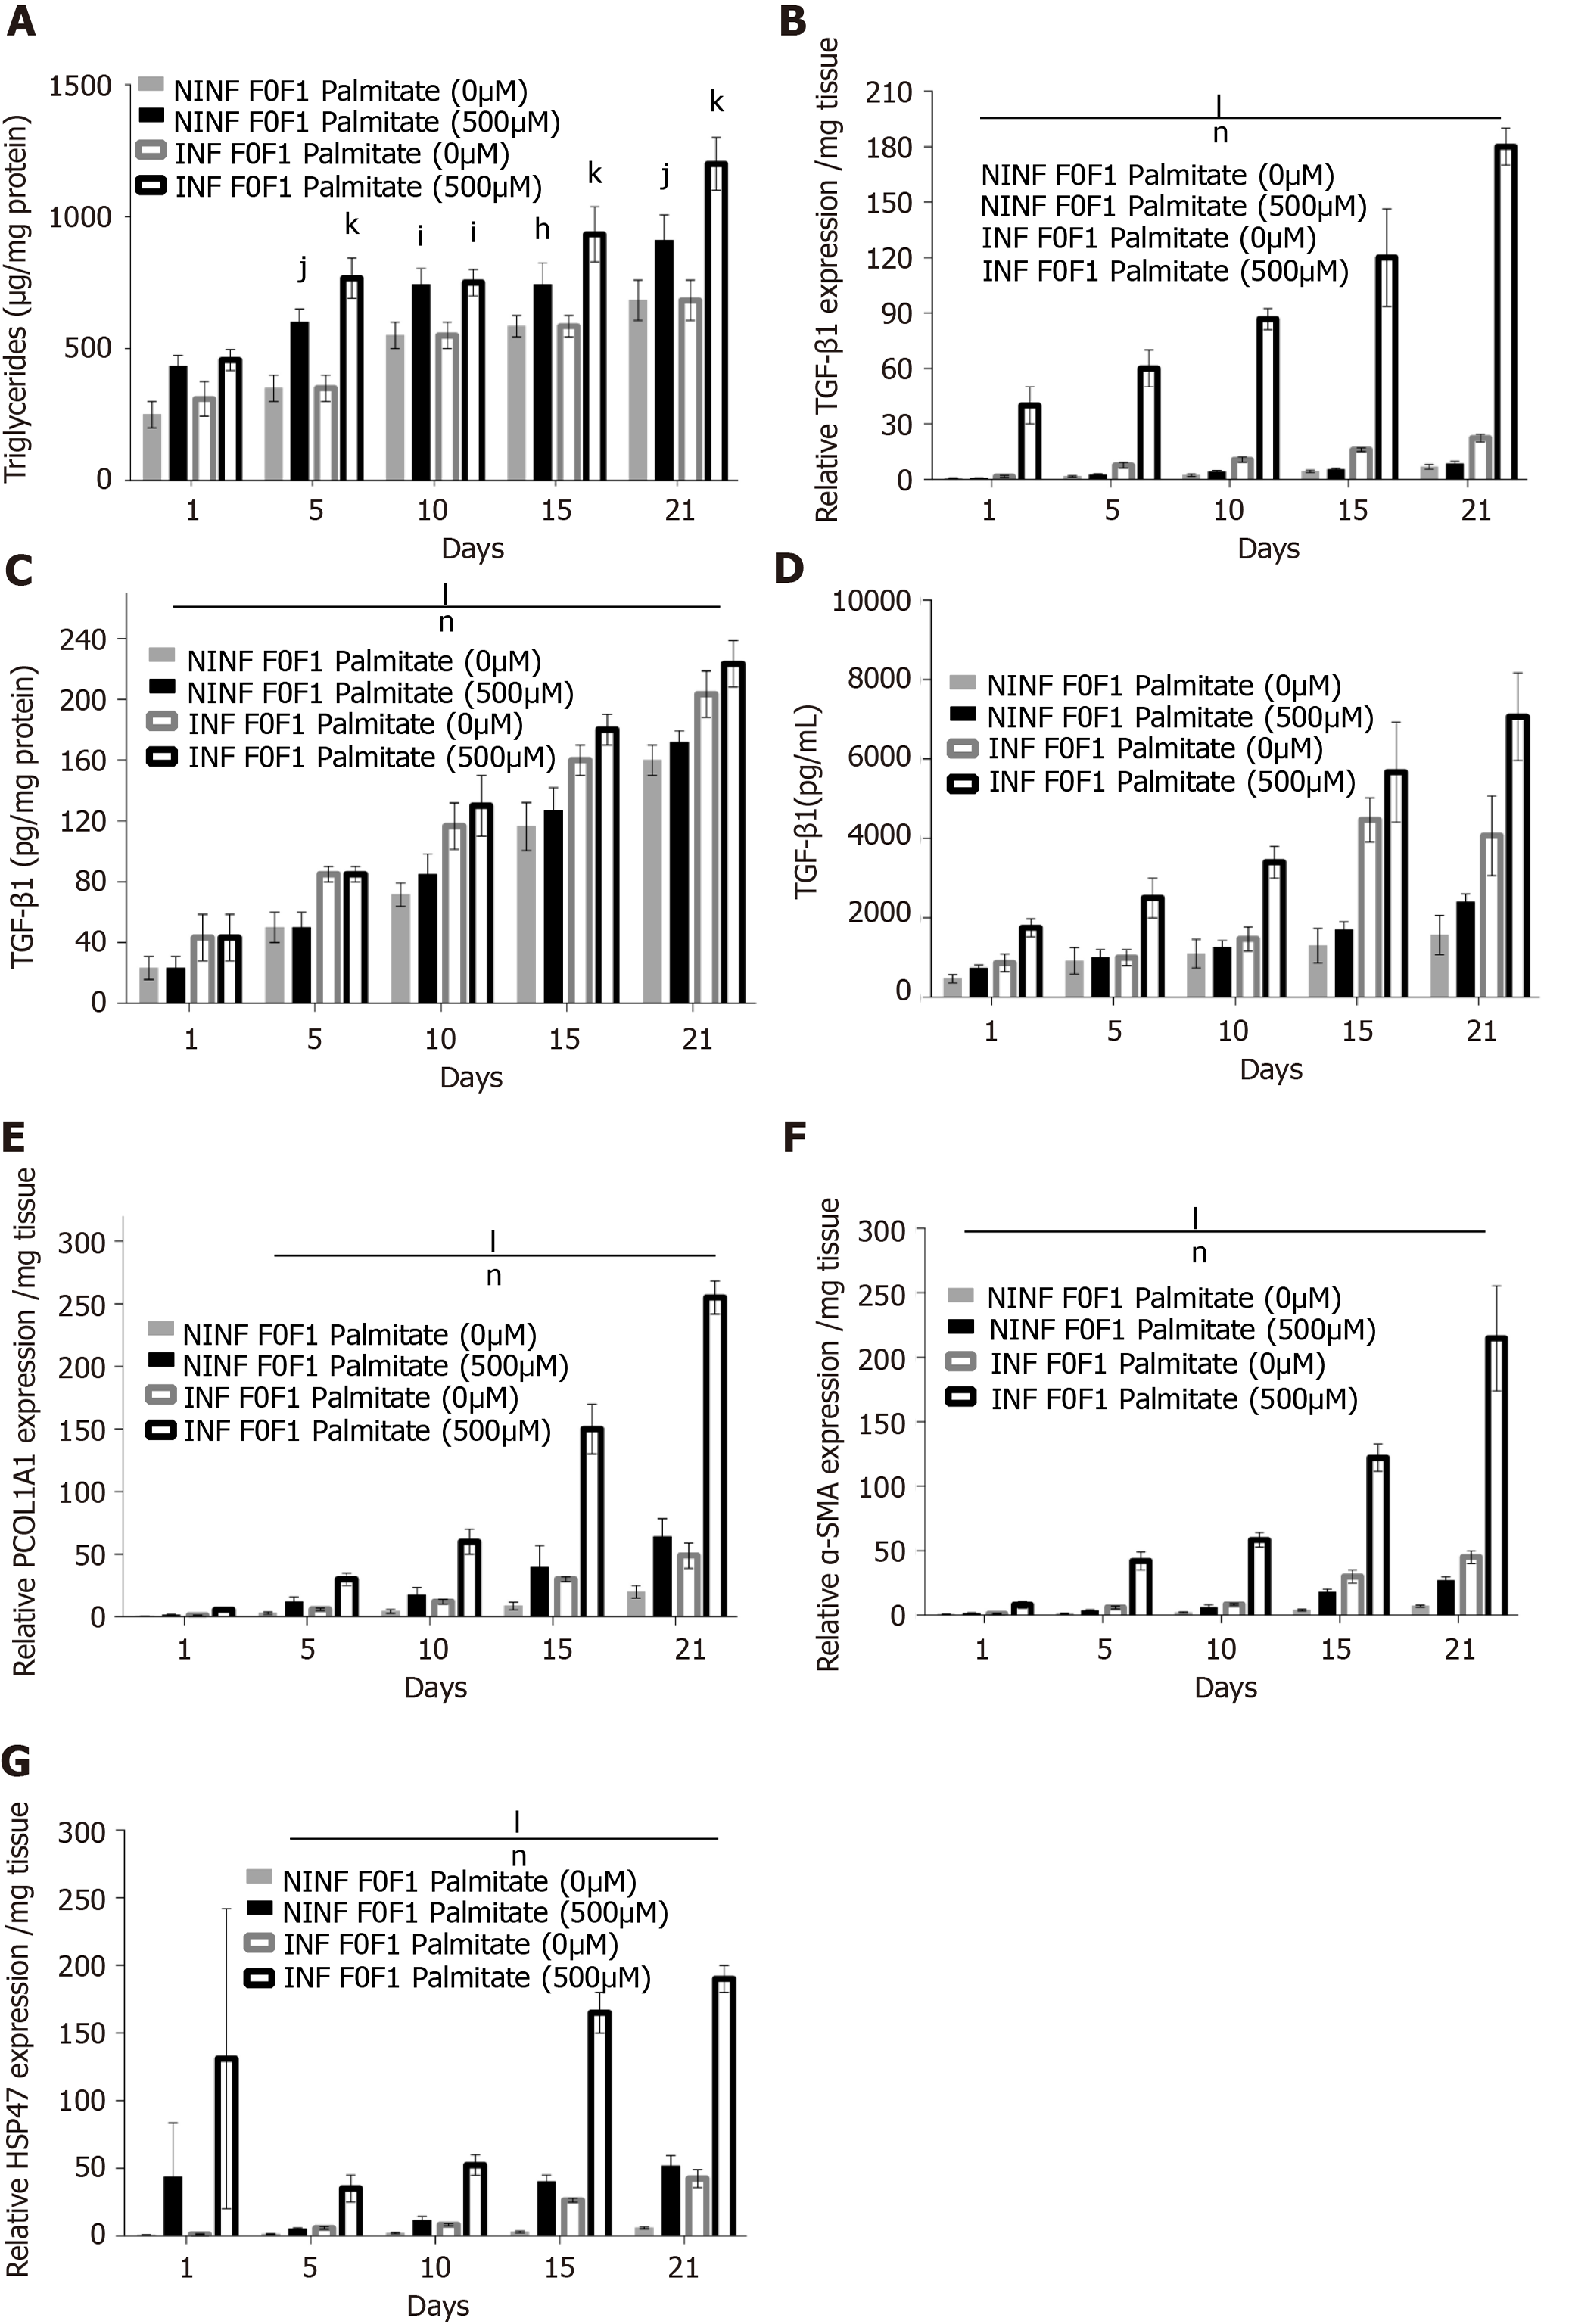
Figure 11 Significant increase of intracellular triglyceride production and RNA expression of fibrosis liver markers in non-fibrotic (F0-F1) hepatitis C virus INF liver slice cultures treated with palmitate (500 µmol/L) compared to non-infected and non-treated liver slice showed by enzyme-linked immunosorbent assay and real-time reverse transcription-quantitative polymerase chain reaction analyses, respectively.
A: Triglyceride production (µg/mg protein) during the 21 days follow up kinetics: Non-significant production in hepatitis C virus (HCV) INF liver slice (LS) compared to non-infected (NINF) LS: (ns NINF vs INF); significant increase in HCV INF LS treated with palmitate compared to NINF; B: Significant increase of TGF-β1 mRNA expression (Relative RNA expression /mg tissue) during the 21 days follow up kinetics, in HCV INF LS compared to NINF LS and in HCV INF LS treated with palmitate compared to NINF; C and D: (C) Intracellular (pg/mg protein) and (D) extracellular (pg/mL) TGF-β1 protein production during the 21 days follow up kinetics, measured by enzyme-linked immunosorbent assay assays, in F0-F1 NINF and HCV INFLS cultures treated or non-treated with palmitate; Significant increase in HCV INF LS compared to NINF LS; Significant increase in HCV INF LS treated with palmitate compared to NINF; E-G: Intracellular mRNA expression (Relative RNA expression /mg tissue) of the Procol1A1 (E), α-SMA (F), HSP47 (G) during the 21 days follow up kinetics: Significant increase in HCV INF LS compared to NINF LS; Significant increase in HCV INF LS treated with palmitate compared to NINF LS. Data are expressed as mean± SEM (F0-F1, n = 5); lP < 0.0001 infection factor; mP < 0.001 infection factor; nP < 0.0001 palmitate factor (two-way ANOVA test).
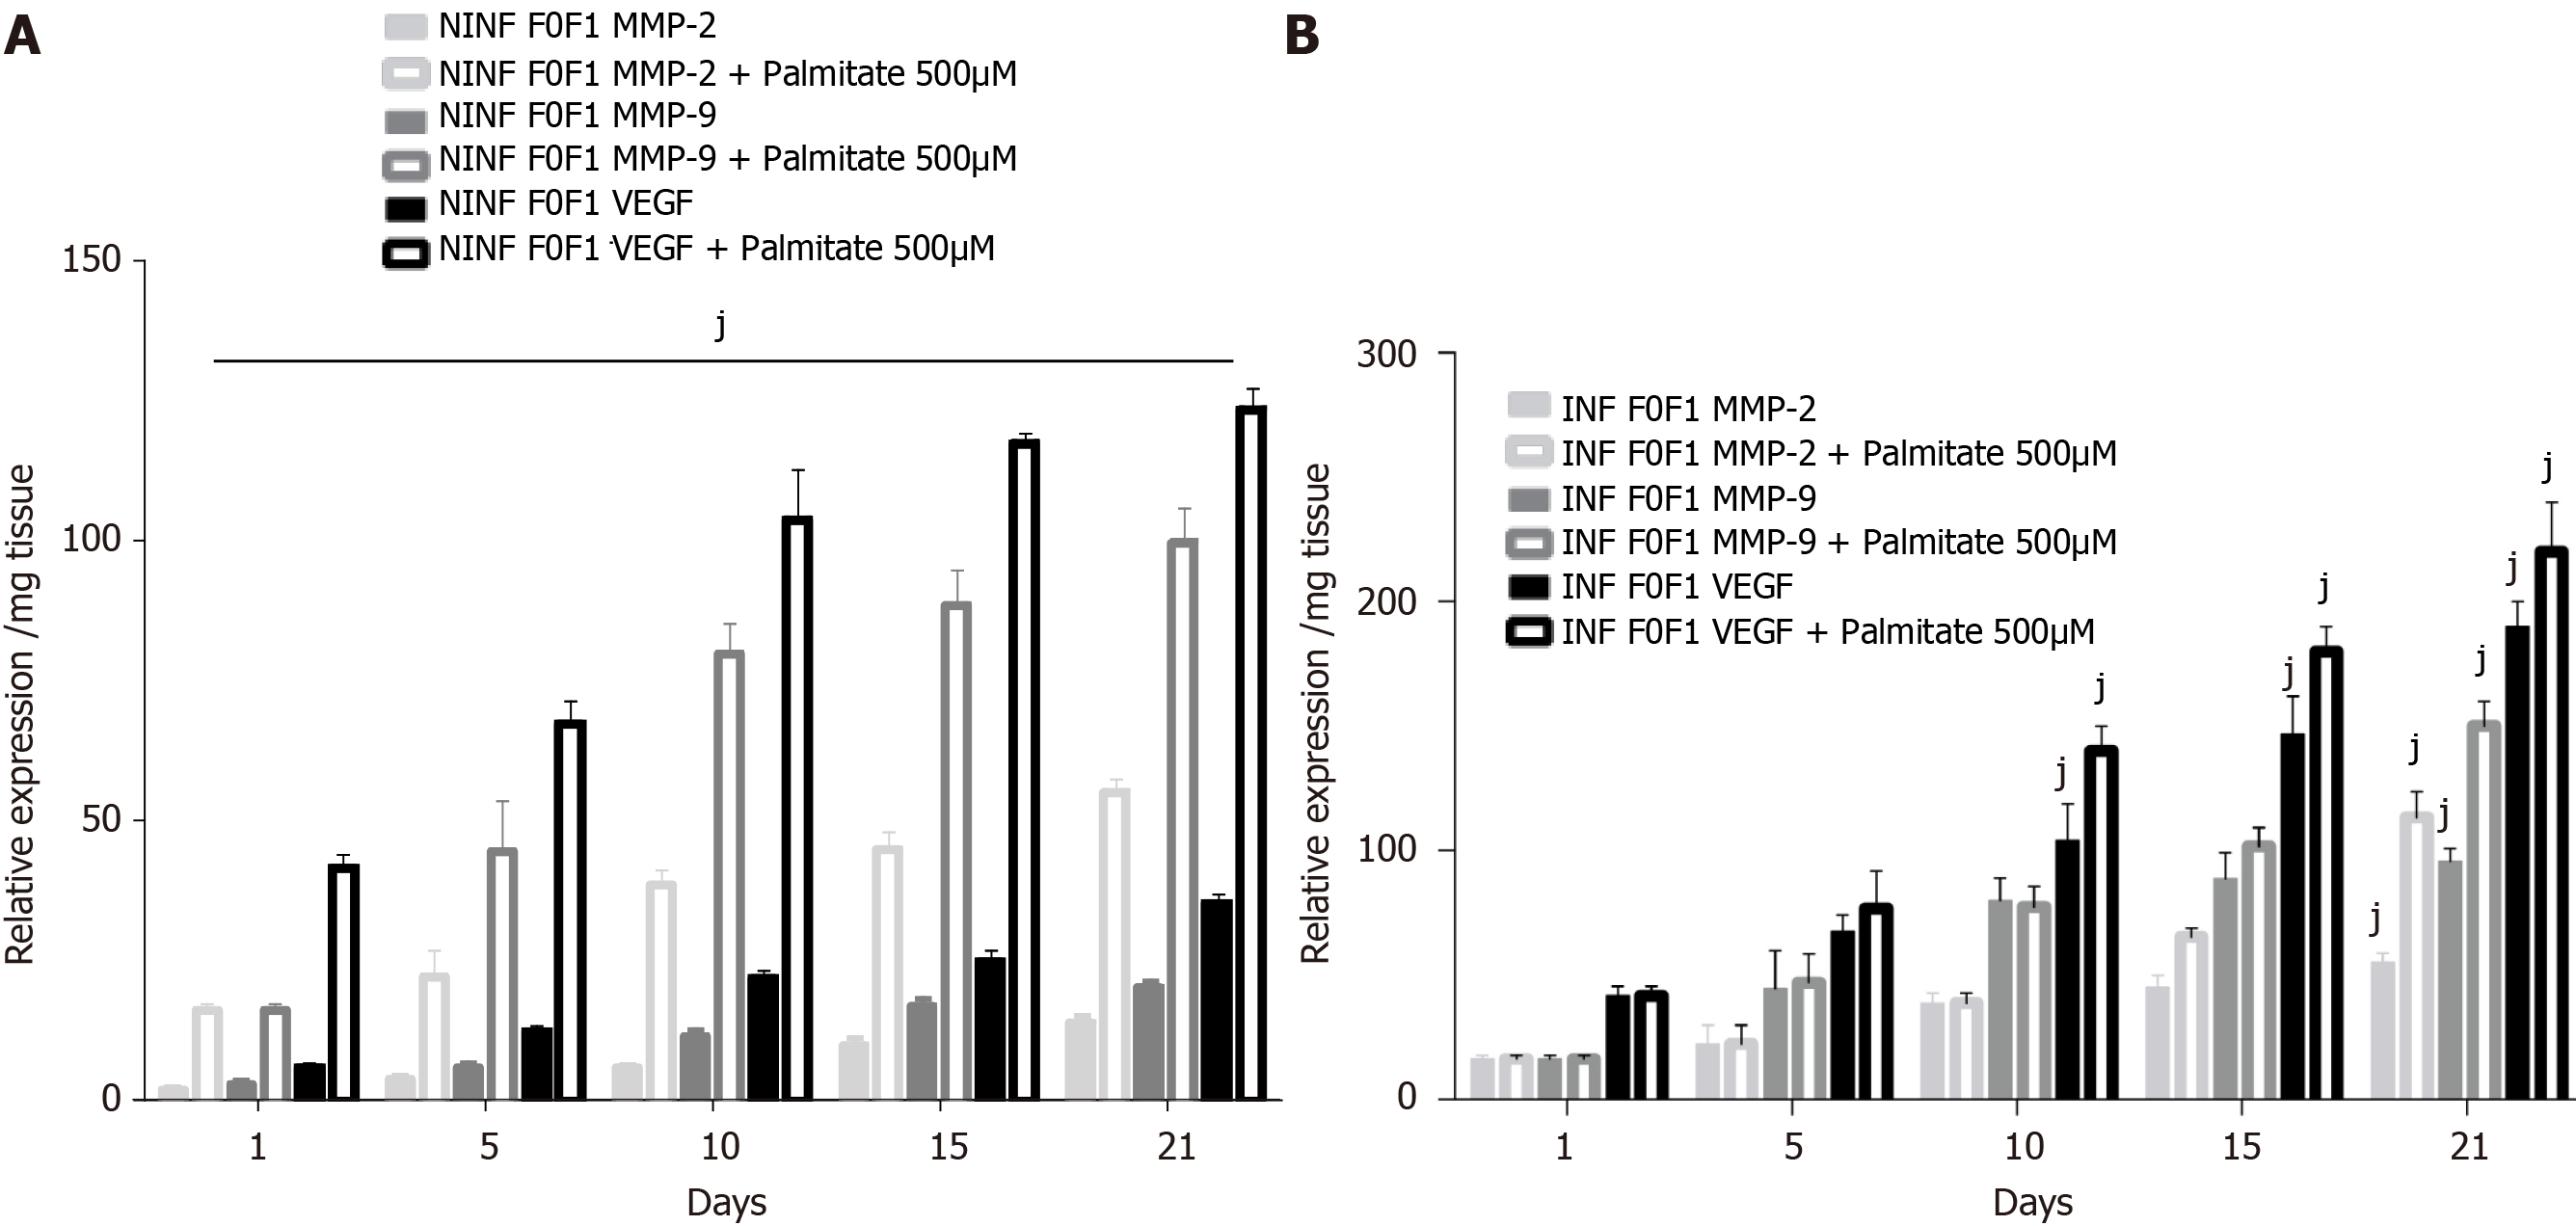
Figure 12 Significant increase of matrix metalloproteinases -2, -9, and vascular endothelial growth factor RNA expression after treatment of F0-F1 non-infected and infected liver slice cultures with palmitate (500 µmol/L).
Biomarker expression estimated by real-time reverse transcription-quantitative polymerase chain reaction. A: Matrix metalloproteinases (MMP)- 2, MMP-9 and vascular endothelial growth factor mRNA expression (relative expression /mg tissue) during the 21 days follow up kinetics, in F0-F1 non-infected liver slice (LS) cultures treated without or with palmitate (500 µmol/L); B: MMP- 2, MMP-9 and vascular endothelial growth factor mRNA expression (relative expression /mg tissue) during the 21 days follow up kinetics, in F0-F1 infected LS cultures treated without or with palmitate (500 µmol/L). Real-time reverse transcription-quantitative polymerase chain reaction experiments were performed with five independent human F0-F1 liver samples (n = 5). LS were obtained in triplicate for each liver sample, at each time point in the kinetic studies. Values are expressed as means ± standard errors (n = 5). Levels of significance were as follows: jP < 0.001 subject vs control (non-treated palmitate), (two-way ANOVA test).
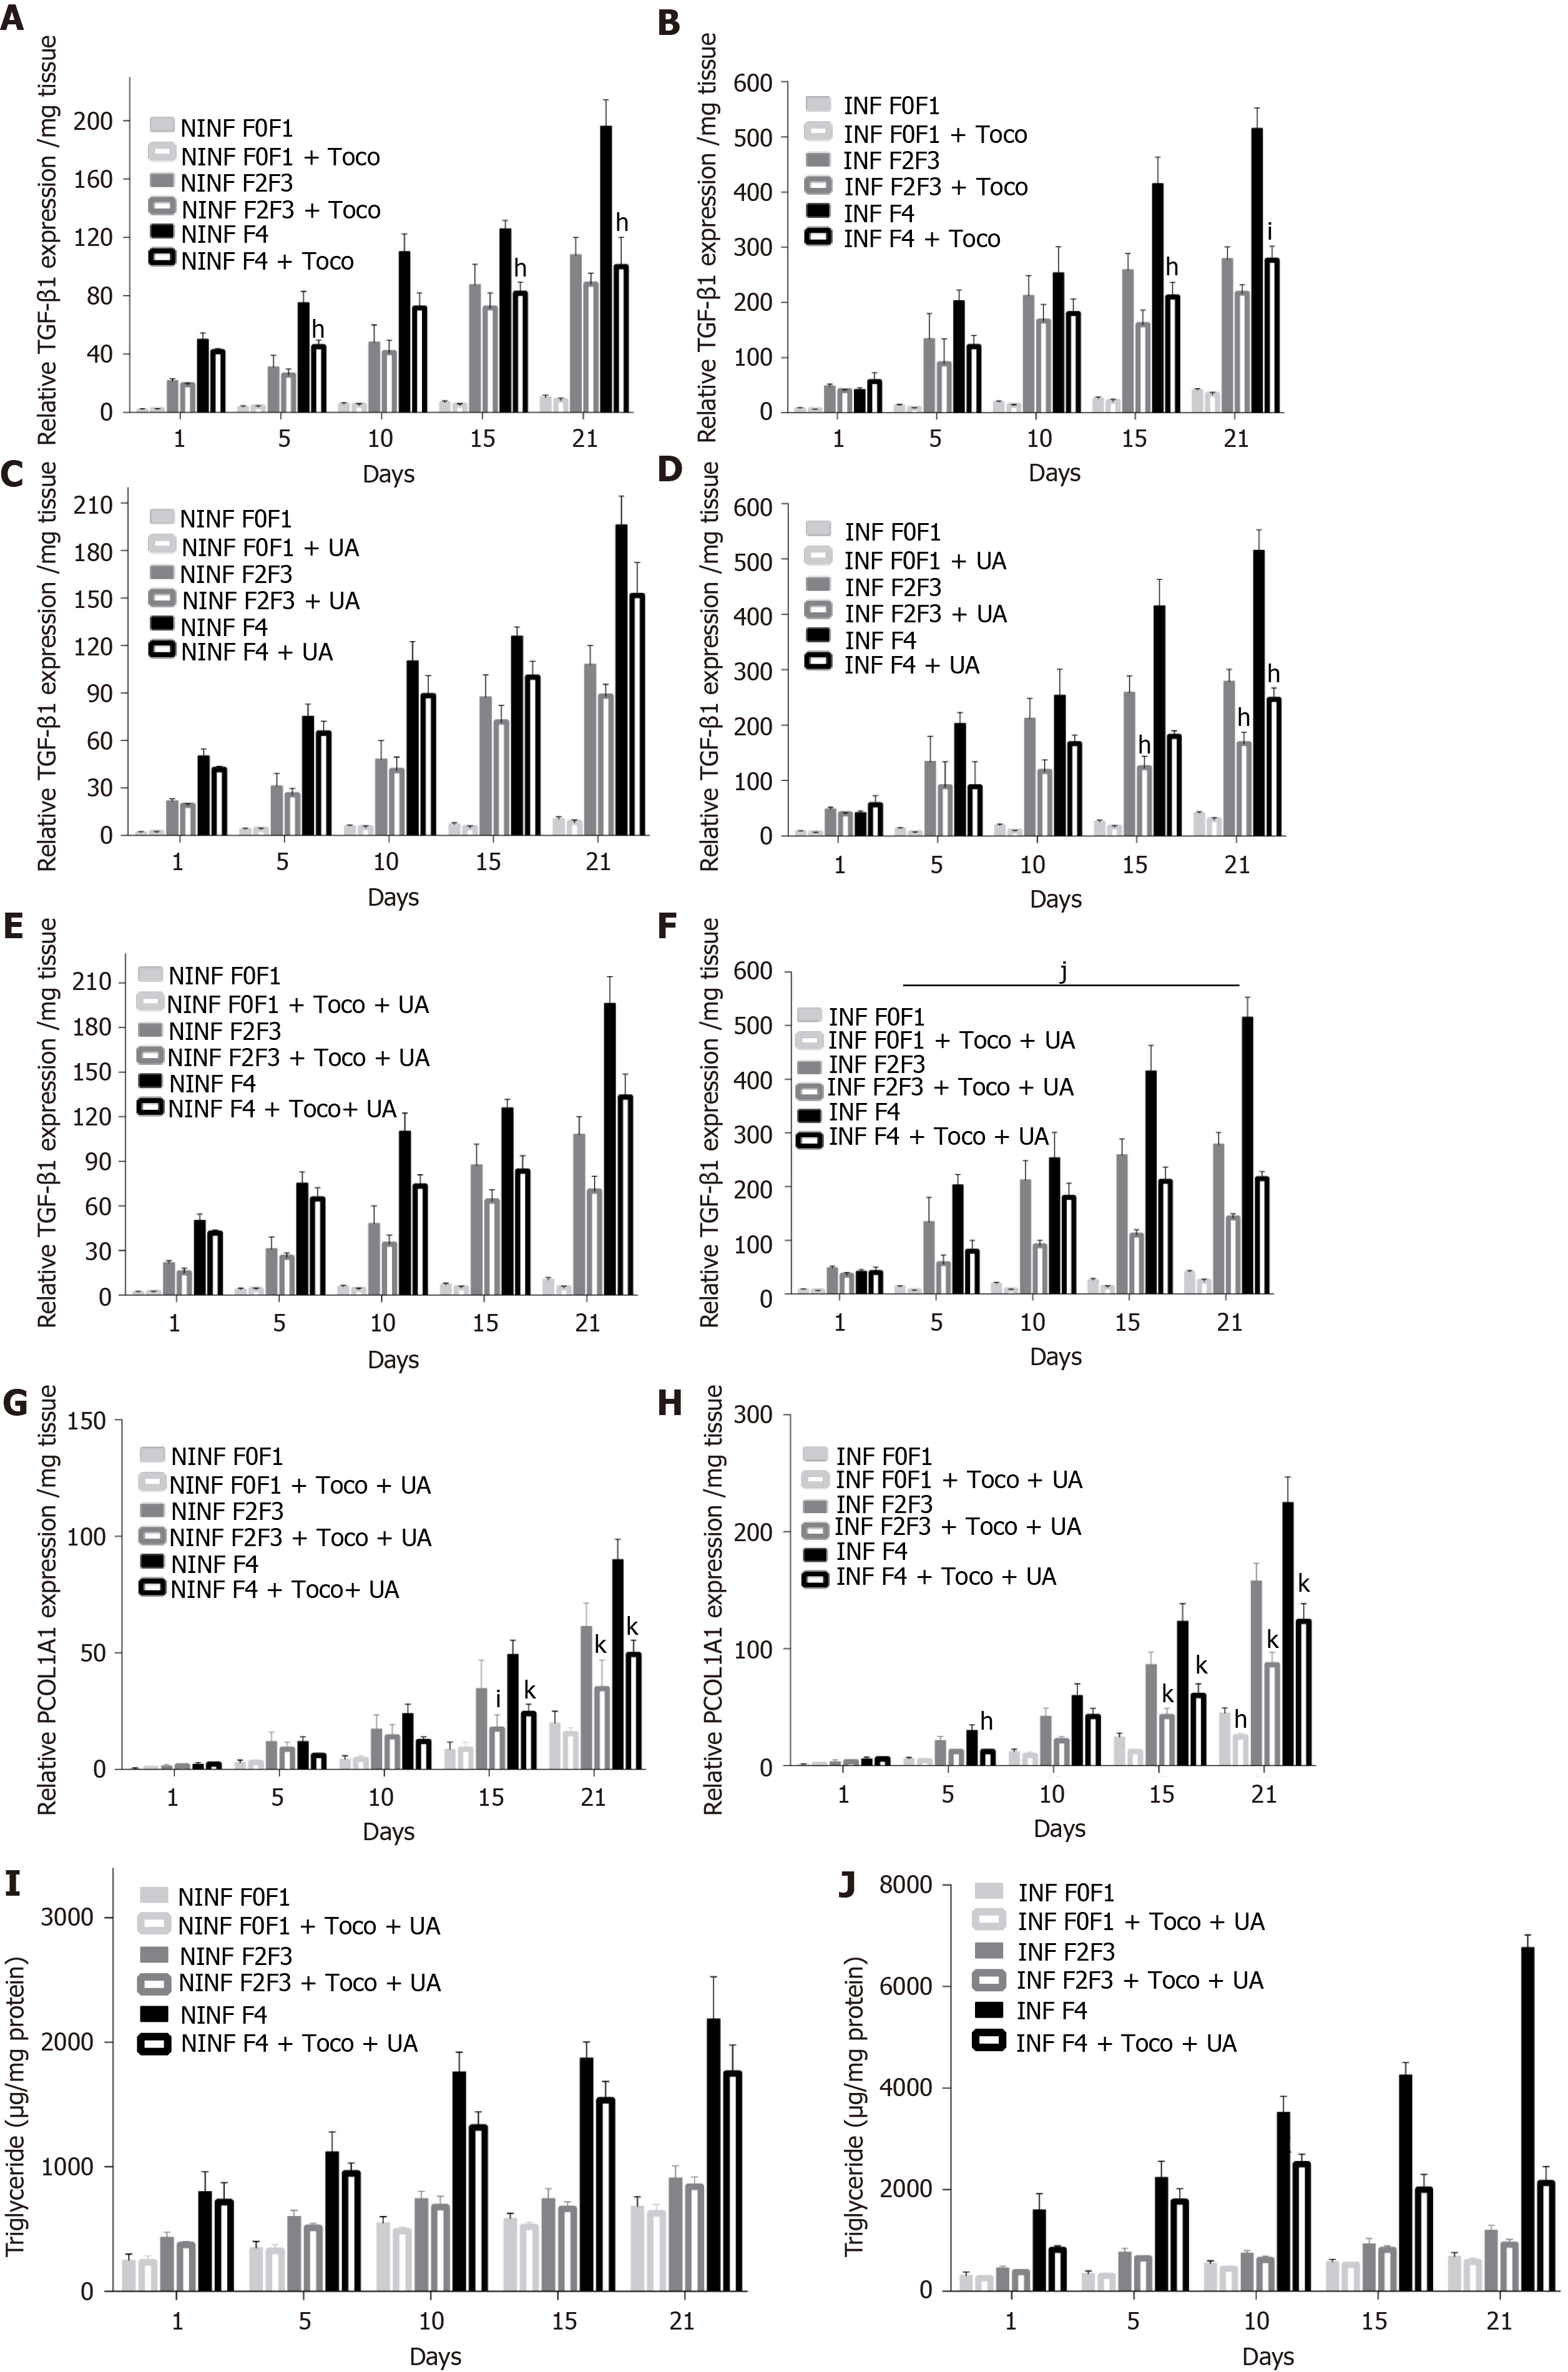
Figure 13 During treatment with alpha-Tocopherol and ursodeoxycholic acid in combination, significant inhibition of the TGF-β1 mRNA expression of fibrotic (F2-F3, F4) hepatitis C virus INF liver slice cultures from day 5 and significant reduction of Procol1A1 mRNA expression and the triglyceride production in F0 to F4 non-infected and hepatitis C virus INF liver slice cultures during the follow-up kinetics, as evidenced the real-time reverse transcription-quantitative polymerase chain reaction analysis and enzyme-linked immunosorbent assays, respectively.
A and B: TGF-β1 mRNA expression (relative TGF-β1 expression /mg tissue) during the 21 days follow up kinetics, in α-Tocopherol (Toco) treated liver slice (LS); C and D: TGF-β1 mRNA expression (relative TGF-β1 expression /mg tissue) during the 21 days follow up kinetics, in ursodeoxycholic acid (UCDA) treated LS; E and F: TGF-β1 mRNA expression (relative TGF-β1 expression /mg tissue) during the 21 days follow up kinetics, in LS during the combined treatment, Toco + UCDA. Data are expressed as means ± SEM (F2-F3 liver samples, n = 2; F4 liver samples, n = 2). kP < 0.0001 subject vs control (non-treated); jP < 0.001 subject vs control (non-treated); iP < 0.01 subject vs control (non-treated), hP < 0.05 subject vs control (non- treated) (two-way ANOVA test); G and H: Procol1A1 mRNA expression (relative Procol1A1 expression /mg tissue) during the 21 days follow up kinetics, in LS during the combined treatment, Toco + UCDA. Data are expressed as means ± SEM (F0-F1 liver samples, n = 10; F2-F3 liver samples, n = 2; F4 liver samples, n = 2). kP < 0.0001 subject vs control (non-treated); jP < 0.001 subject vs control (non-treated); iP < 0.01 subject vs control (non-treated), hP < 0.05 subject vs control (non-treated); (two-way ANOVA test); I and J: Triglyceride production (µg/mg protein) during the 21 days follow-up kinetics, in NINF and hepatitis C virus INF LS from F0-F1 to F4 LS cultures significantly reduced by the combined treatment [Toco + UCDA (UA)], more particularly from day 15 in F4 hepatitis C virus infected LS cultures. Data are expressed as means ± SEM (F0-F1, n = 5, F2-F3 liver samples, n = 2; F4 liver samples, n = 2). kP < 0.0001 subject vs control (non- treated); jP < 0.001 subject vs control (non-treated); iP < 0.01 subject vs control (non-treated), hP < 0.05 subject vs control (non-treated) (two-way ANOVA test).
- Citation: Kartasheva-Ebertz D, Gaston J, Lair-Mehiri L, Massault PP, Scatton O, Vaillant JC, Morozov VA, Pol S, Lagaye S. Adult human liver slice cultures: Modelling of liver fibrosis and evaluation of new anti-fibrotic drugs. World J Hepatol 2021; 13(2): 187-217
- URL: https://www.wjgnet.com/1948-5182/full/v13/i2/187.htm
- DOI: https://dx.doi.org/10.4254/wjh.v13.i2.187


