Copyright
©The Author(s) 2021.
World J Hepatol. Feb 27, 2021; 13(2): 187-217
Published online Feb 27, 2021. doi: 10.4254/wjh.v13.i2.187
Published online Feb 27, 2021. doi: 10.4254/wjh.v13.i2.187
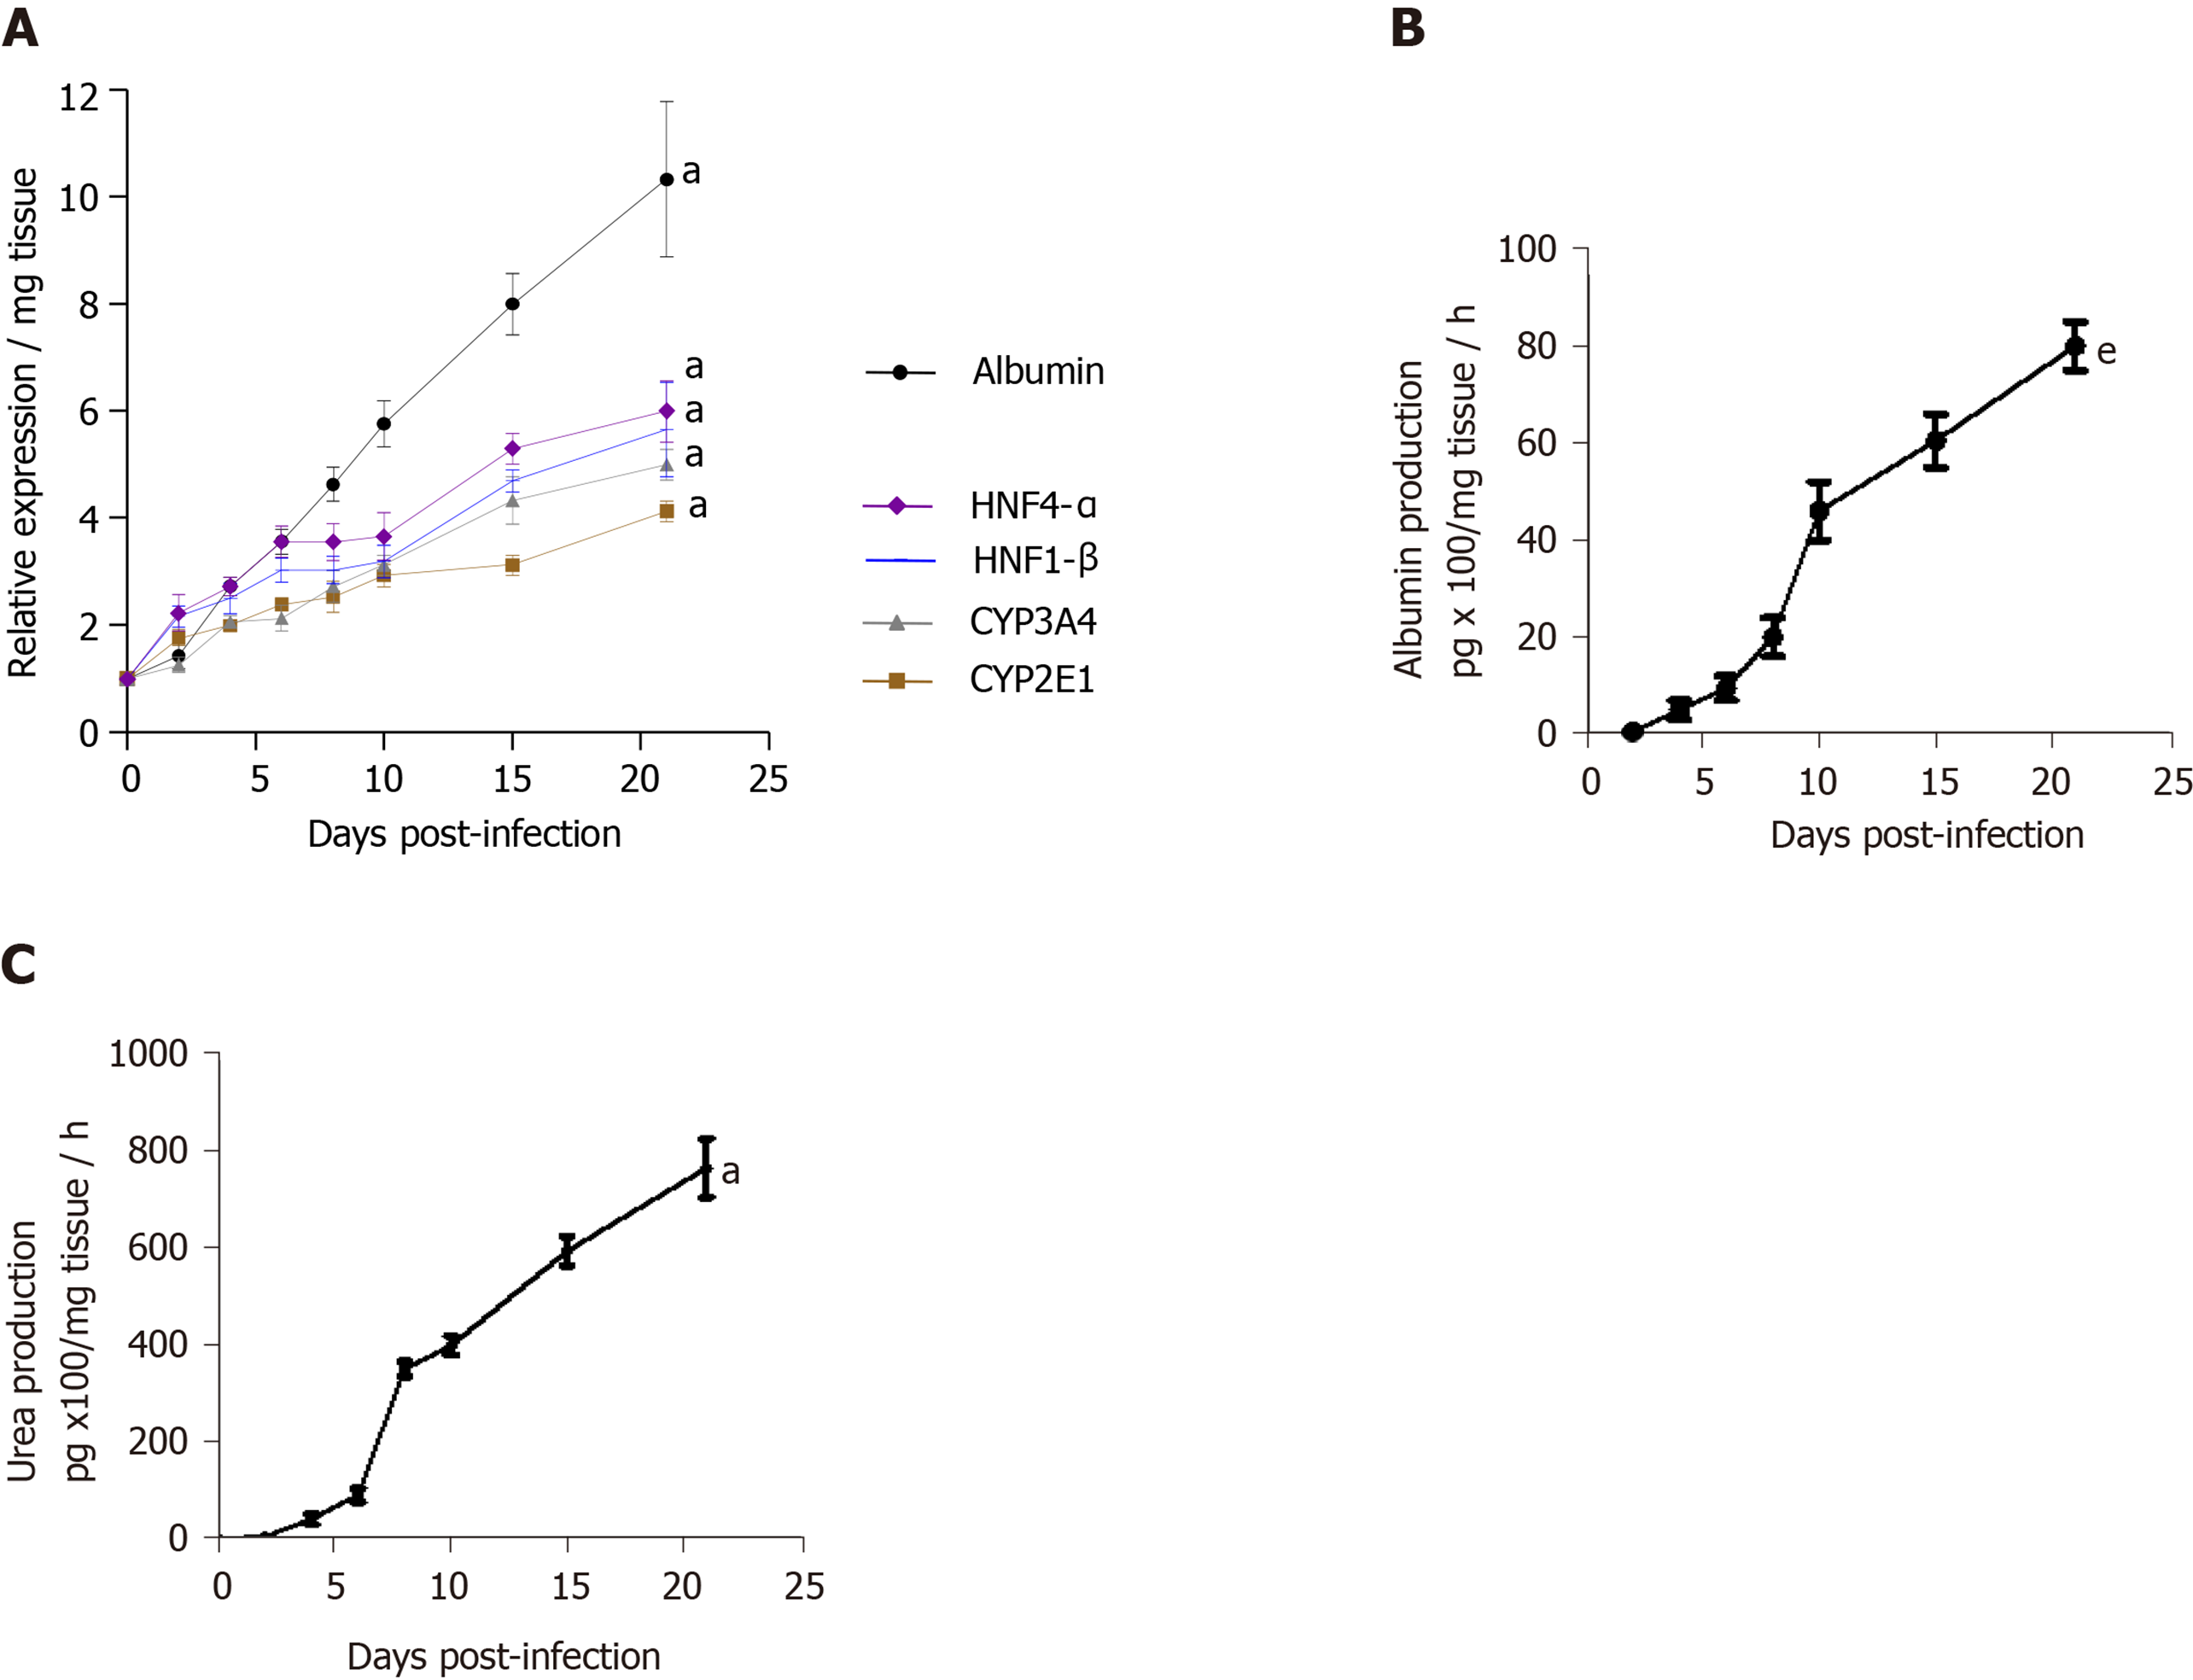
Figure 3 Maintenance of phenotypic characteristics of human non-fibrotic (F0-F1) hepatitis C virus-infected liver slices during the culture, demonstrated by real-time reverse transcription-quantitative polymerase chain reaction and biochemical assays.
A: Hepatocyte-specific gene mRNA expression (relative expression/mg tissue) during the 21 days follow up studies. Maintenance of hepatocyte-specific gene expression patterns in human non-fibrotic (F0-F1) hepatitis C virus (HCV) infected liver slices during the culture. The real-time reverse transcription-quantitative polymerase chain reaction analyses were performed from five independent human non-fibrotic (F0-F1) liver samples, using HCV- infected slices in triplicate from each liver. Liver slices were infected with HCVcc, on day 0, at MOI = 0.1. All liver–specific gene expression values were normalized to 18S RNA as an internal standard and expressed in relation to the zero-time point. Values are expressed as mean ± standard errors. The results were compared using the two-paired Student’s t-test: Albumin, aP < 0.0001; CYP2E1: aP < 0.0001; CYP3A4: aP < 0.0001; HNF1-β: aP < 0.0001; HNF4-α: aP < 0.0001); B and C: Biochemical functional assays: B: Albumin production (pg x 100/mg tissue/ hour) during the 21d- follow up studies (days). C: Urea production (pg/mg tissue/hour during the 21d- follow up studies (days) by human F0-F1 cultured HCV-infected liver slices (n = 5). The assays were performed as previously described[11,12]. Studies were performed in triplicate and repeated twice for each liver sample. Values are expressed as means ± standard errors (n = 5). The results were compared using the two-paired Student’s t-test: Albumin production: eP < 0.001; urea production: aP < 0.0001.
- Citation: Kartasheva-Ebertz D, Gaston J, Lair-Mehiri L, Massault PP, Scatton O, Vaillant JC, Morozov VA, Pol S, Lagaye S. Adult human liver slice cultures: Modelling of liver fibrosis and evaluation of new anti-fibrotic drugs. World J Hepatol 2021; 13(2): 187-217
- URL: https://www.wjgnet.com/1948-5182/full/v13/i2/187.htm
- DOI: https://dx.doi.org/10.4254/wjh.v13.i2.187


