Copyright
©The Author(s) 2021.
World J Hepatol. Feb 27, 2021; 13(2): 187-217
Published online Feb 27, 2021. doi: 10.4254/wjh.v13.i2.187
Published online Feb 27, 2021. doi: 10.4254/wjh.v13.i2.187
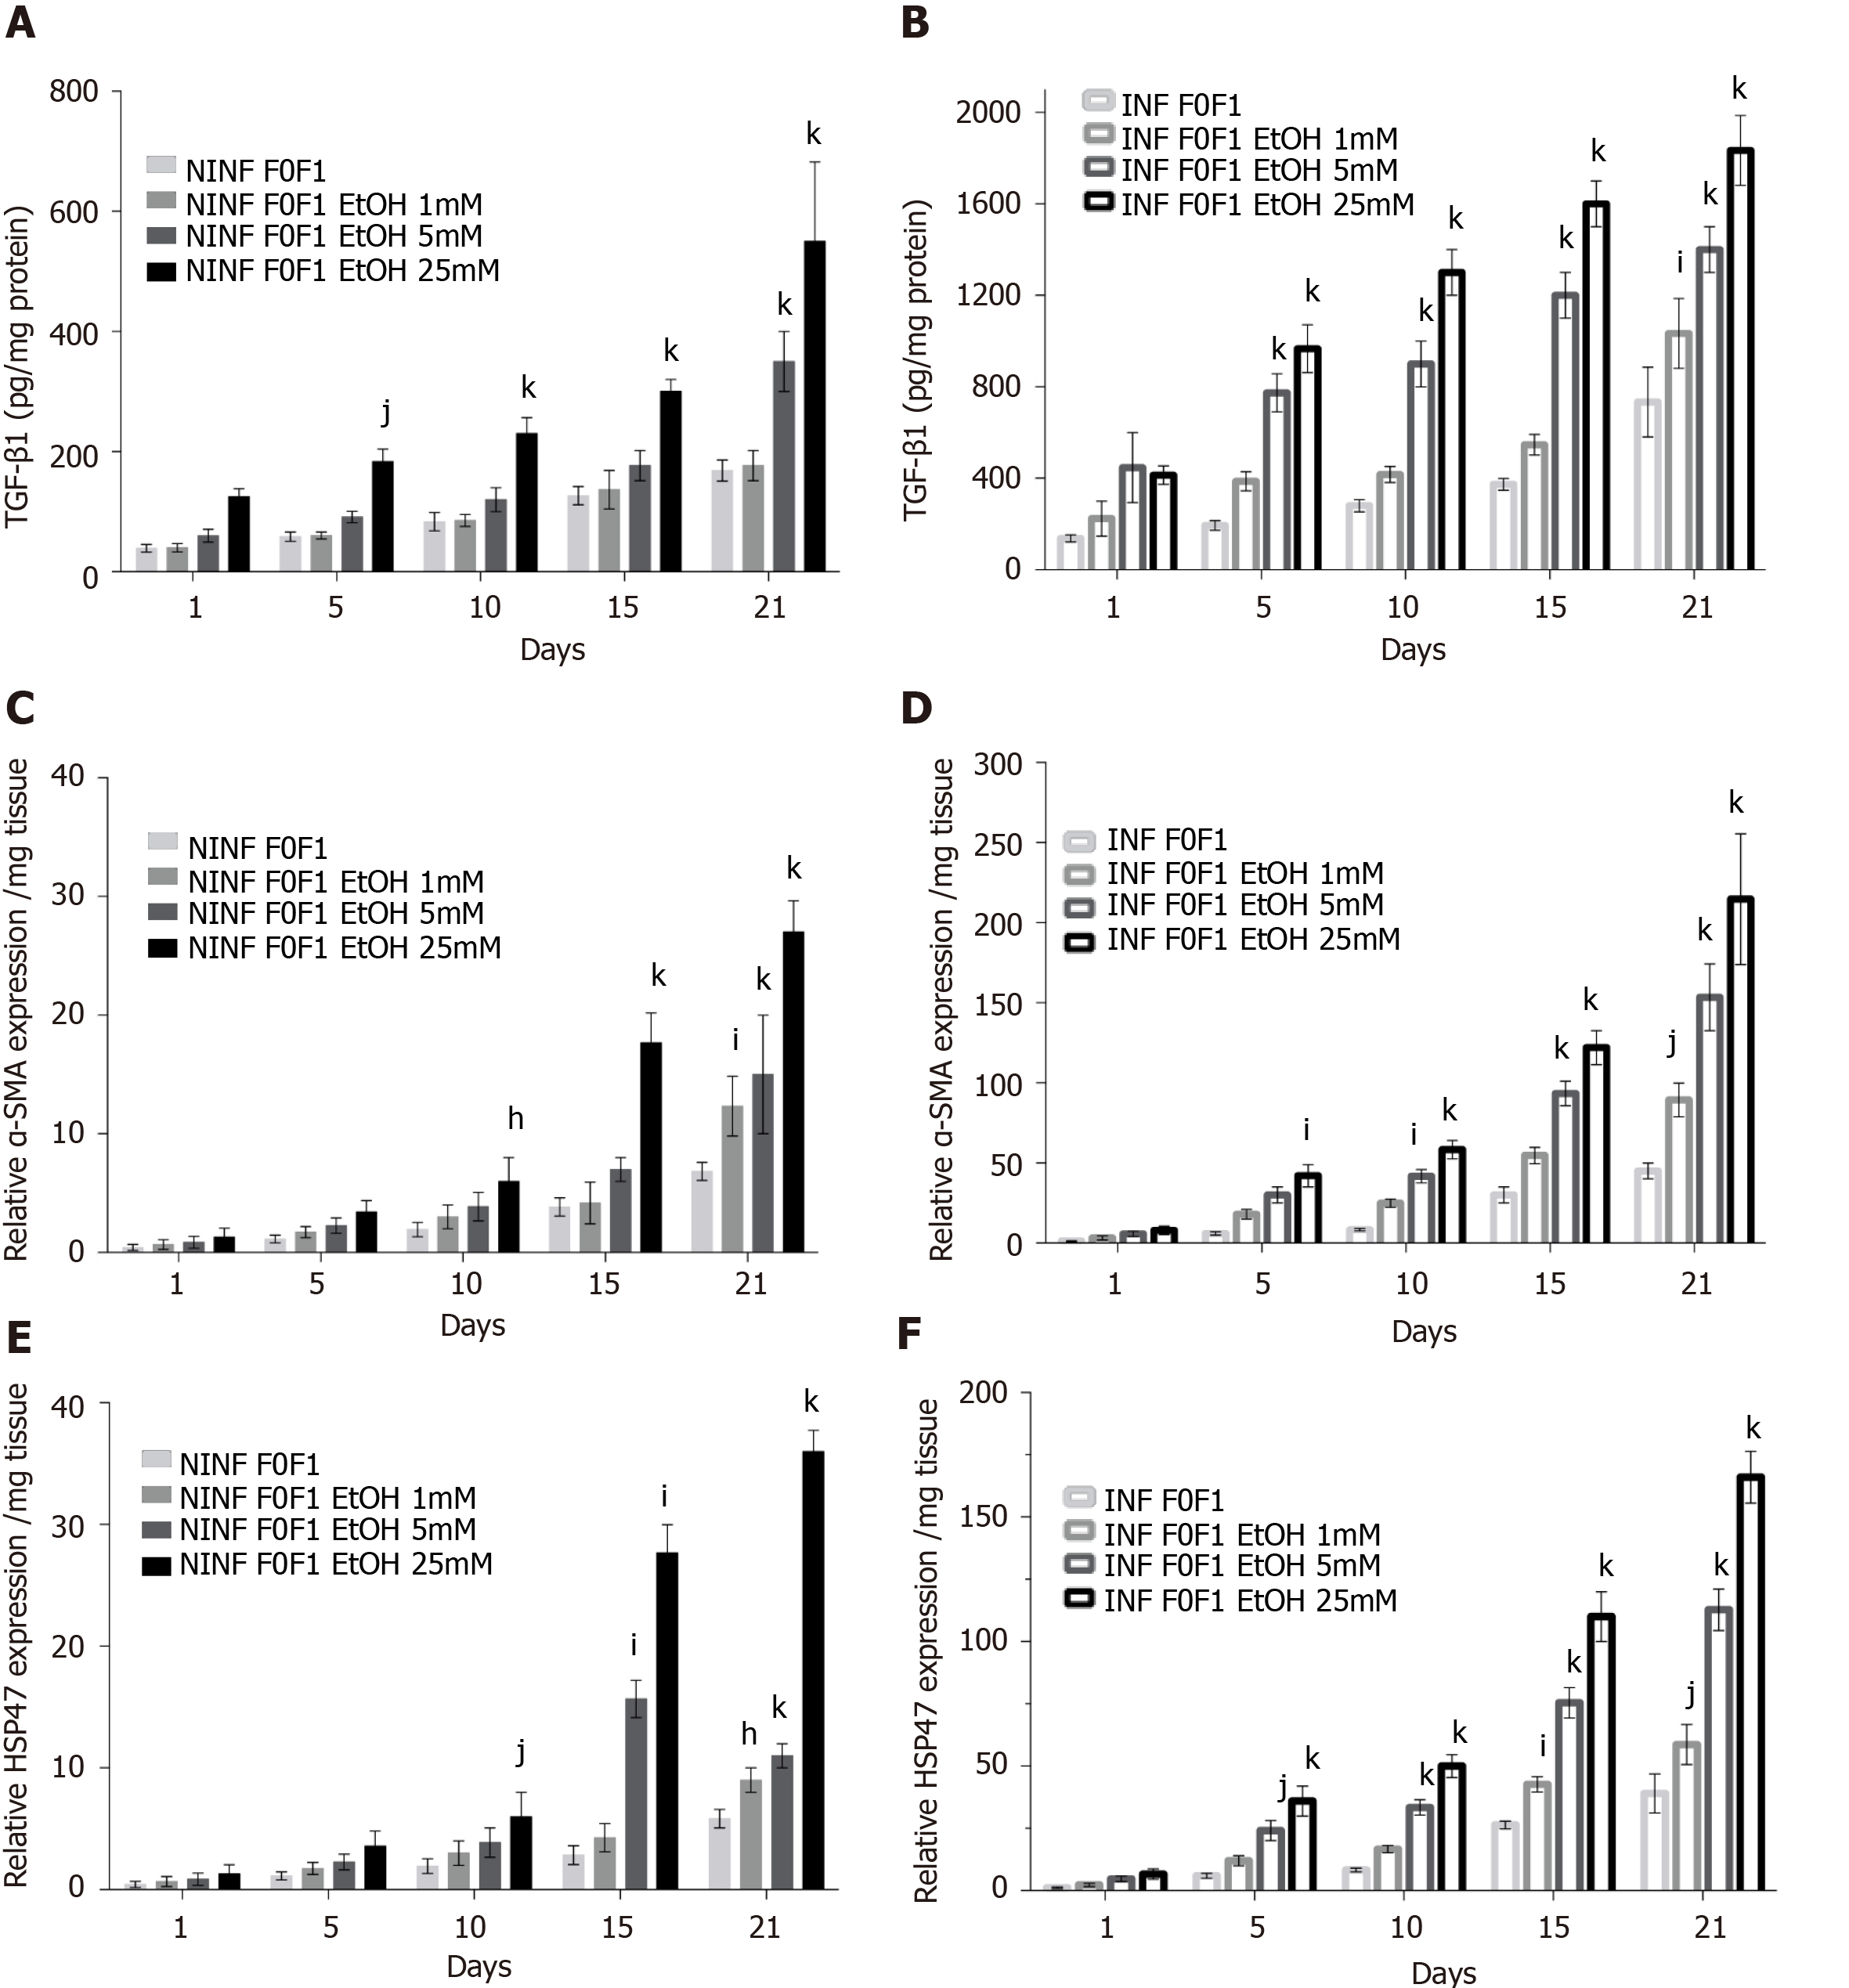
Figure 9 Significantly increase in TGF-β1 protein and RNA expression of α-SMA, and HSP47 in non-infected or hepatitis C virus-infected non-fibrotic (F0-F1) liver slice cultures treated with 1 mmol/L, 5 mmol/L and 25 mmol/L of ethanol was shown by enzyme-linked immunosorbent assay and real-time reverse transcription-quantitative polymerase chain reaction analyses.
A and B: TGF-β1 intracellular protein expression (pg/mg protein) during 21 days follow up kinetics, in non-infected (A) and hepatitis C virus (HCV)-infected (B) F0-F1 liver slice (LS) cultures, treated with 1 mmol/L, 5 mmol/L, 25 mmol/L of ethanol (EtOH); C and D: Relative α-SMA RNA expression level (relative RNA expression/mg tissue) during 21 days follow up kinetics, in non-infected (C) and HCV-infected (D) F0-F1 LS cultures treated with 1 mmol/L, 5 mmol/L, 25 mmol/L of EtOH; E and F: Relative HSP47 RNA expression level expression (relative RNA expression / mg tissue) during 21 days follow up kinetics, in non-infected (E) and HCV-infected (F) F0-F1 LS cultures treated with 1 mmol/L, 5 mmol/L, 25 mmol/L of EtOH. All presented data take into account the viability of the liver slice cultures. Values are expressed as means ± SEMs (n = 5); Levels of significance: kP < 0.0001 subject vs control (non-treated); jP < 0.001 subject vs control (non-treated); iP < 0.01 subject vs control (non-treated), hP < 0.05 subject vs control (non-treated) (two-way ANOVA test).
- Citation: Kartasheva-Ebertz D, Gaston J, Lair-Mehiri L, Massault PP, Scatton O, Vaillant JC, Morozov VA, Pol S, Lagaye S. Adult human liver slice cultures: Modelling of liver fibrosis and evaluation of new anti-fibrotic drugs. World J Hepatol 2021; 13(2): 187-217
- URL: https://www.wjgnet.com/1948-5182/full/v13/i2/187.htm
- DOI: https://dx.doi.org/10.4254/wjh.v13.i2.187


