Copyright
©The Author(s) 2020.
World J Hepatol. Dec 27, 2020; 12(12): 1198-1210
Published online Dec 27, 2020. doi: 10.4254/wjh.v12.i12.1198
Published online Dec 27, 2020. doi: 10.4254/wjh.v12.i12.1198
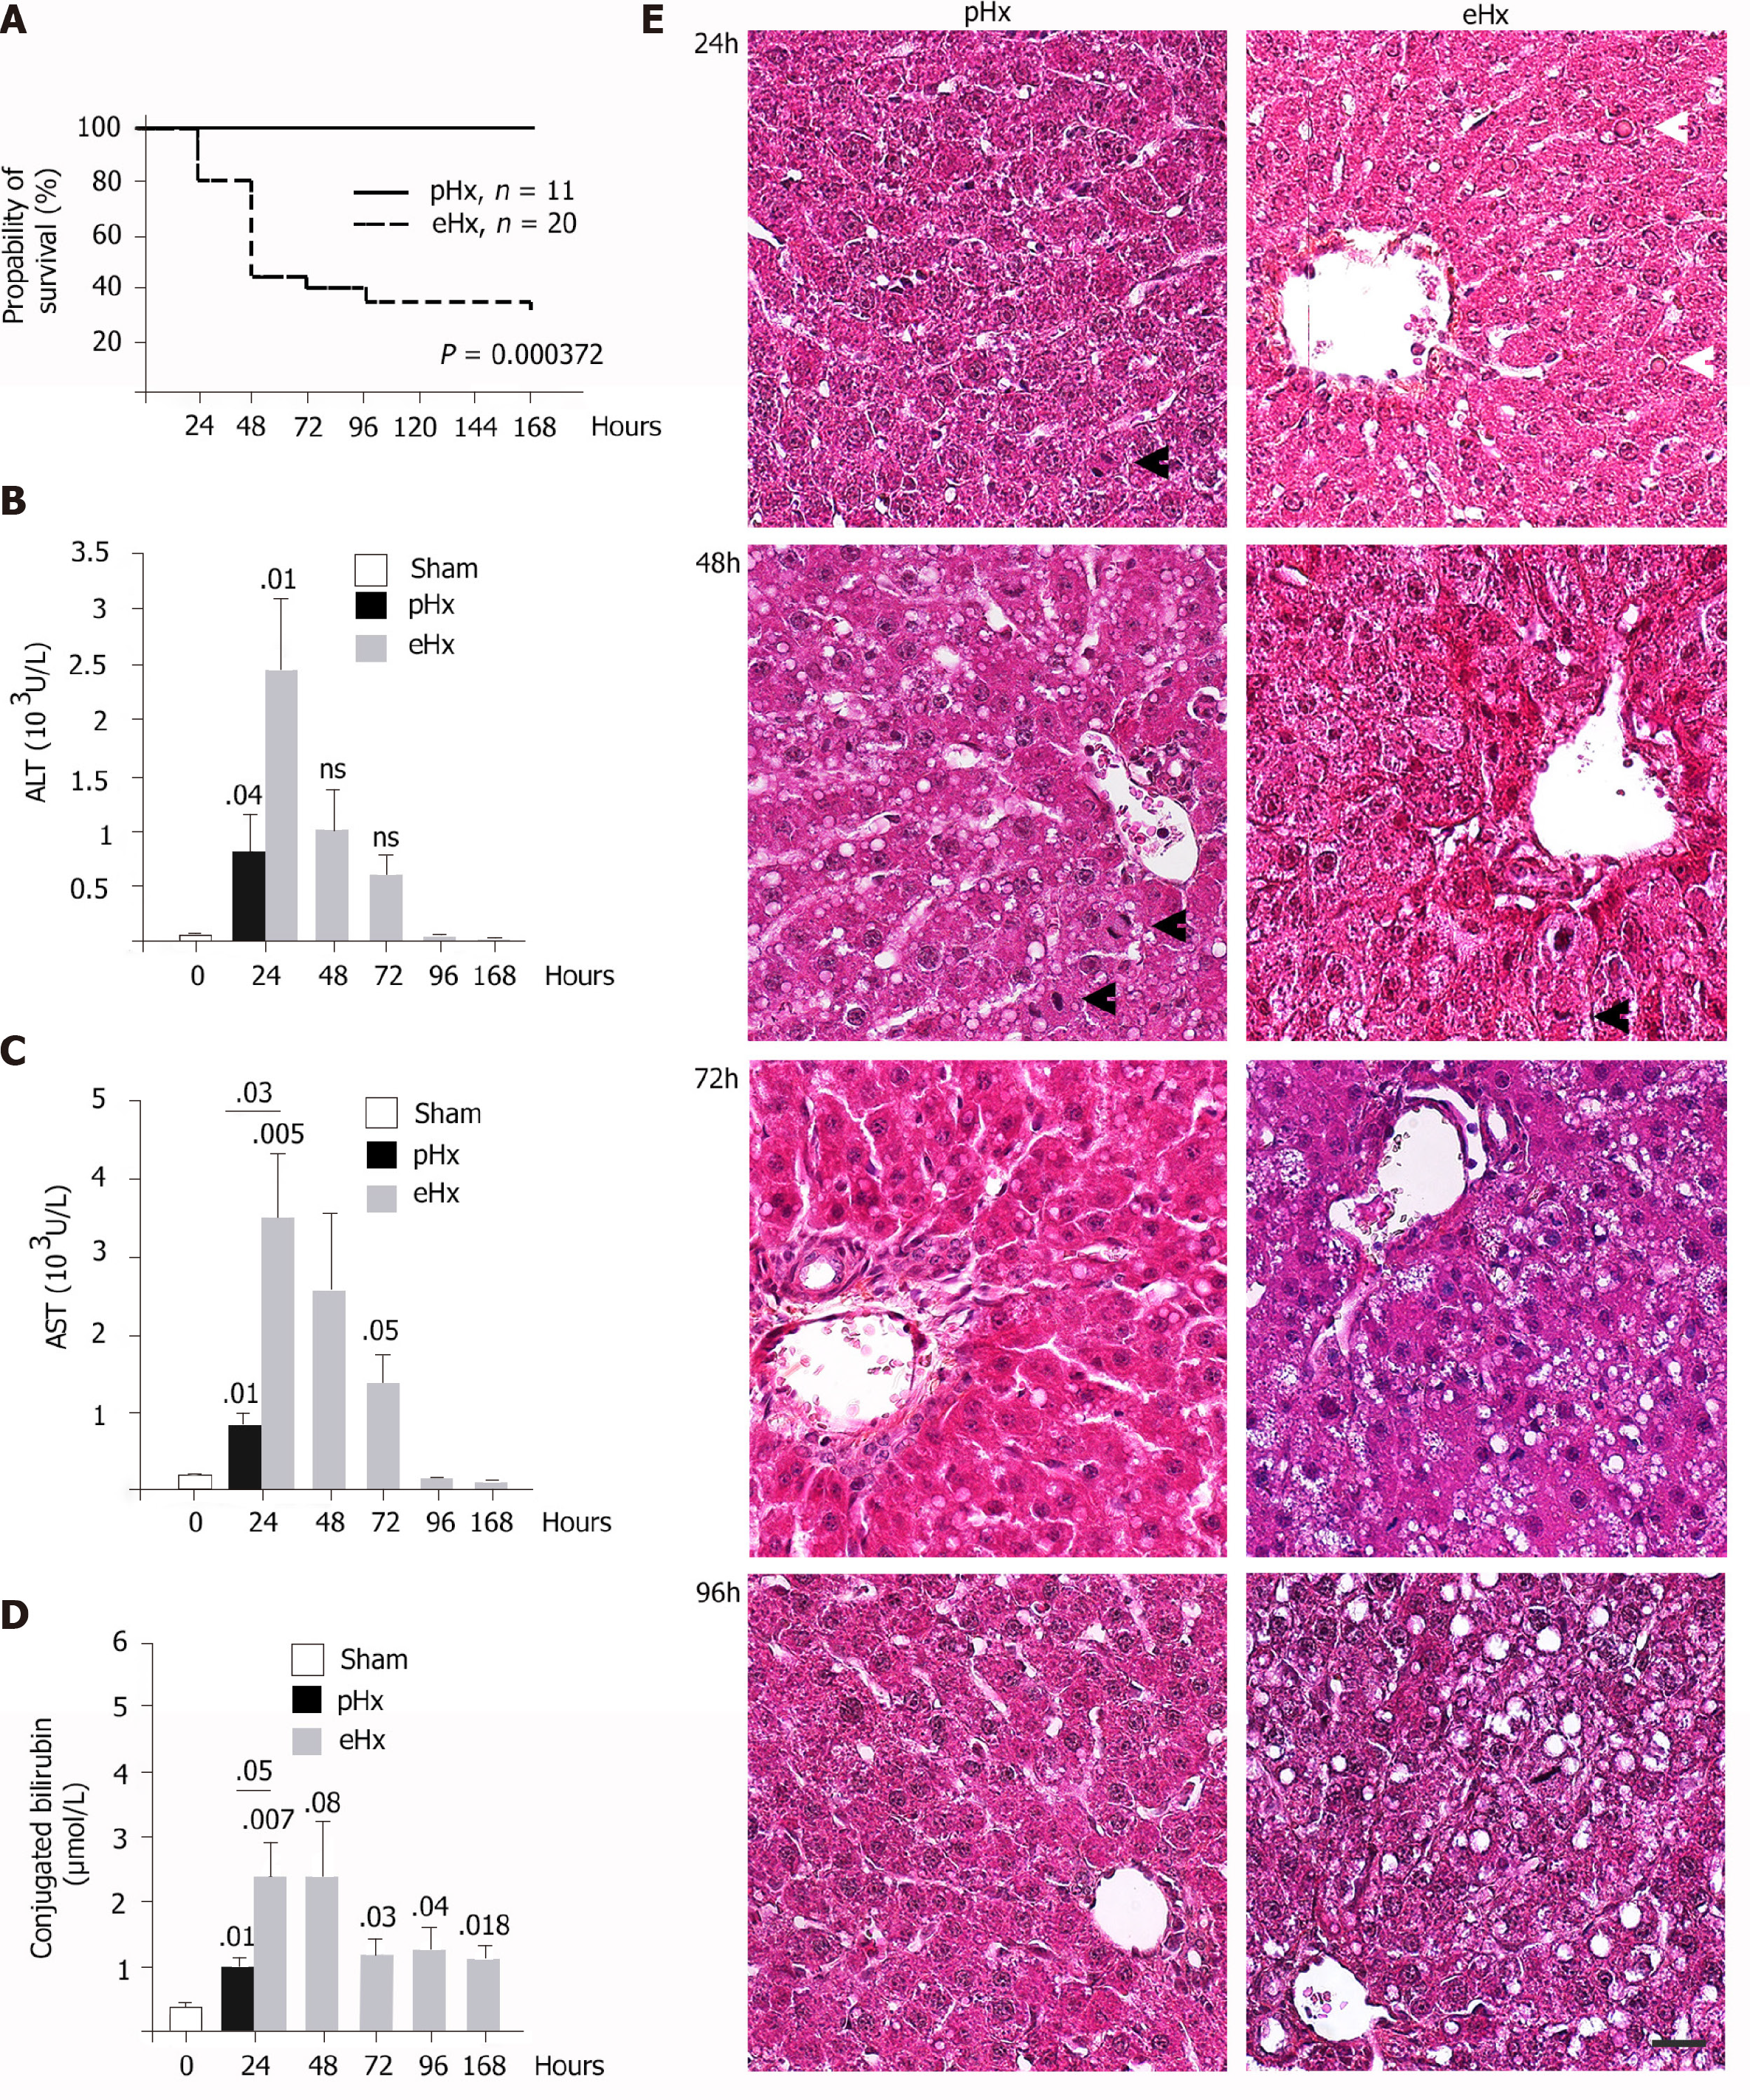
Figure 1 Survival rates and post-operative liver injury after enlarged liver resection.
Male Wistar rats were subjected to 70% [hepatectomy (pHx)] or 90% [extended hepatectomy (eHx)] followed by harvest of blood samples and the remnant liver tissues at the indicated time points after surgery. A: Kaplan-Meier survival plots; B: Serum levels of alanine aminotransferase (ALT); C: Serum levels of aspartate aminotransferase (AST); D: Conjugated bilirubin from hours 24 to 168 post-eHx (n = 45); E: Representative liver images stained with hematoxylin, eosin, and alcian blue at the indicated time points post-eHx; black arrowheads indicate mitotic figures, and white arrowheads point to globular red hyaline material. Scale bar: 50 μM. Sham: Laparotomy control group.
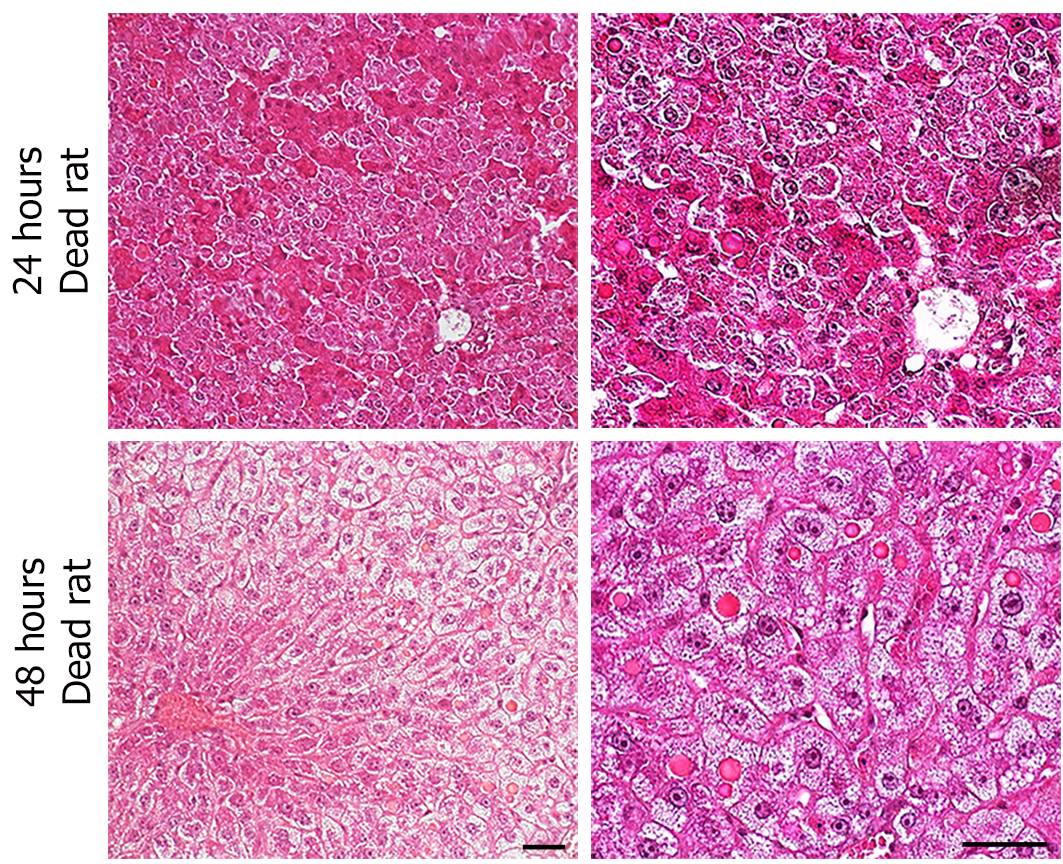
Figure 2 Severity of hepatocyte damage on the onset of liver regeneration.
Histological analysis of representative liver sections harvested within minutes of death and stained with hematoxylin, eosin, and alcian blue from rats that died 24 h and 48 h post-resection. Note the presence of enlarged hepatocytes containing cytoplasmic hyaline inclusions. Scale bar: 50 μmol/L.
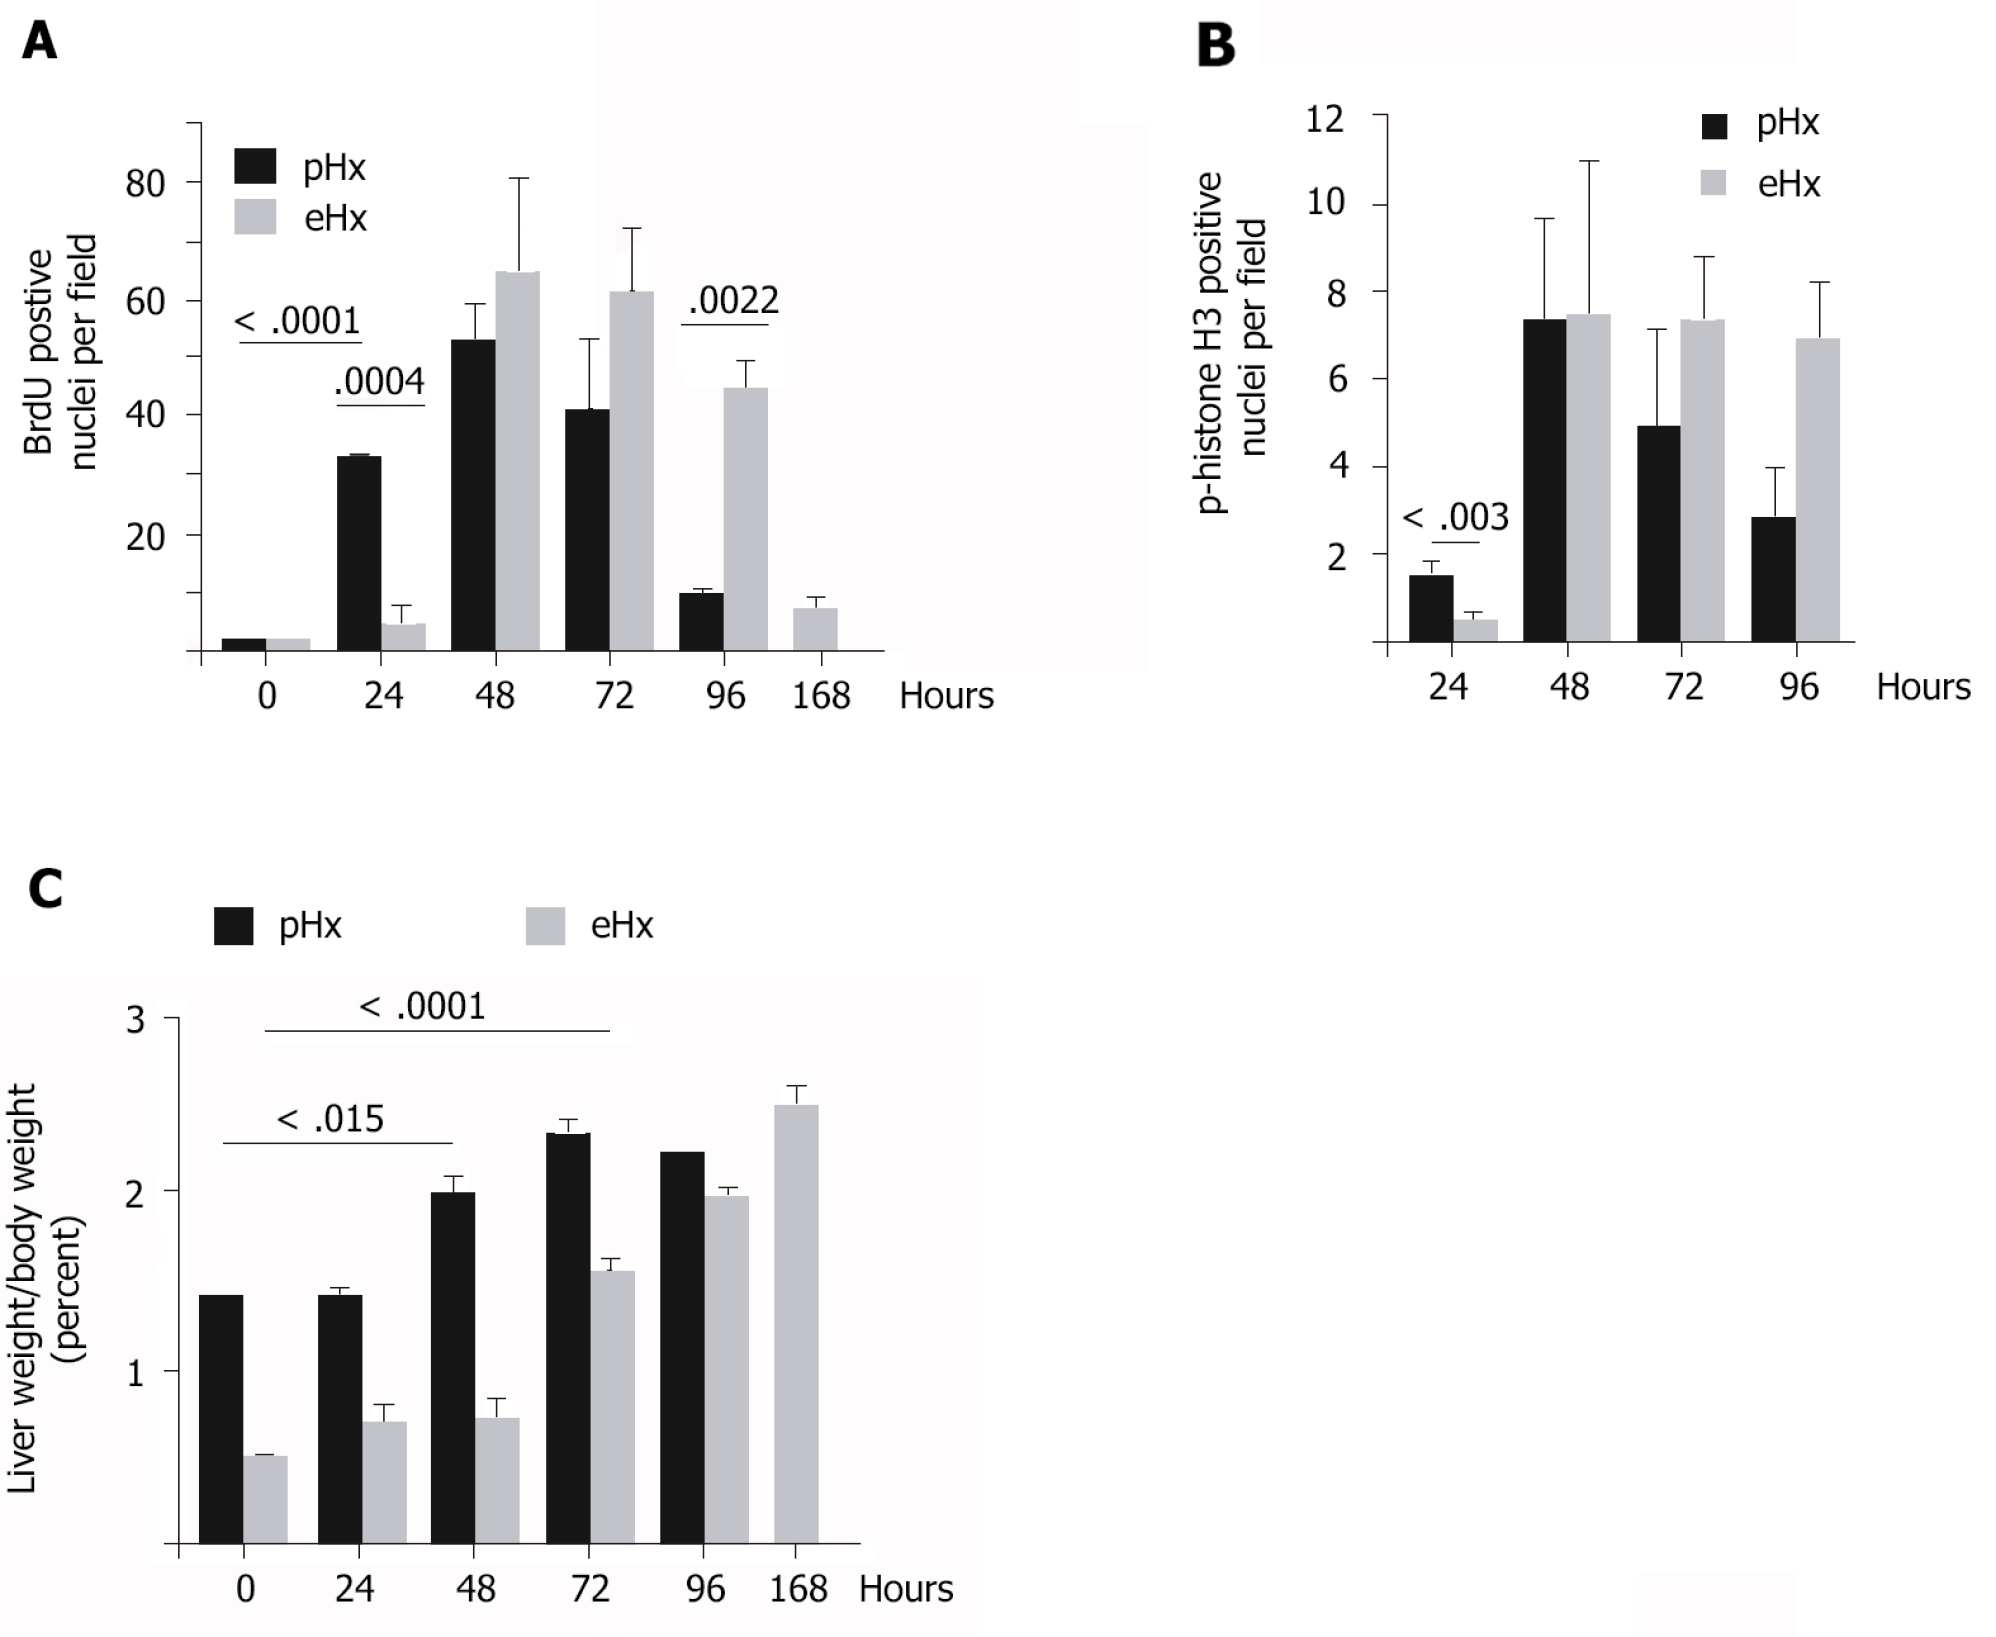
Figure 3 S-phase progression is markedly delayed after extended hepatectomy.
Animals were sacrificed at the indicated time points after 70% [hepatectomy (pHx)] or 90% [extended hepatectomy (eHx)], and remnant liver tissues were harvested for immunofluorescence analysis. A: Bromodeoxyuridine (BrdU) incorporation; B: Phospho-histone H3 Labeling of mitotic cells. Cell counting was performed in 10 random microscopic fields on 6 rats in the eHx group and 3 rats in pHx; C: Mean liver to body weight ratios after pHx and eHx. eHx: Extended hepatectomy; pHx: 70% hepatectomy.
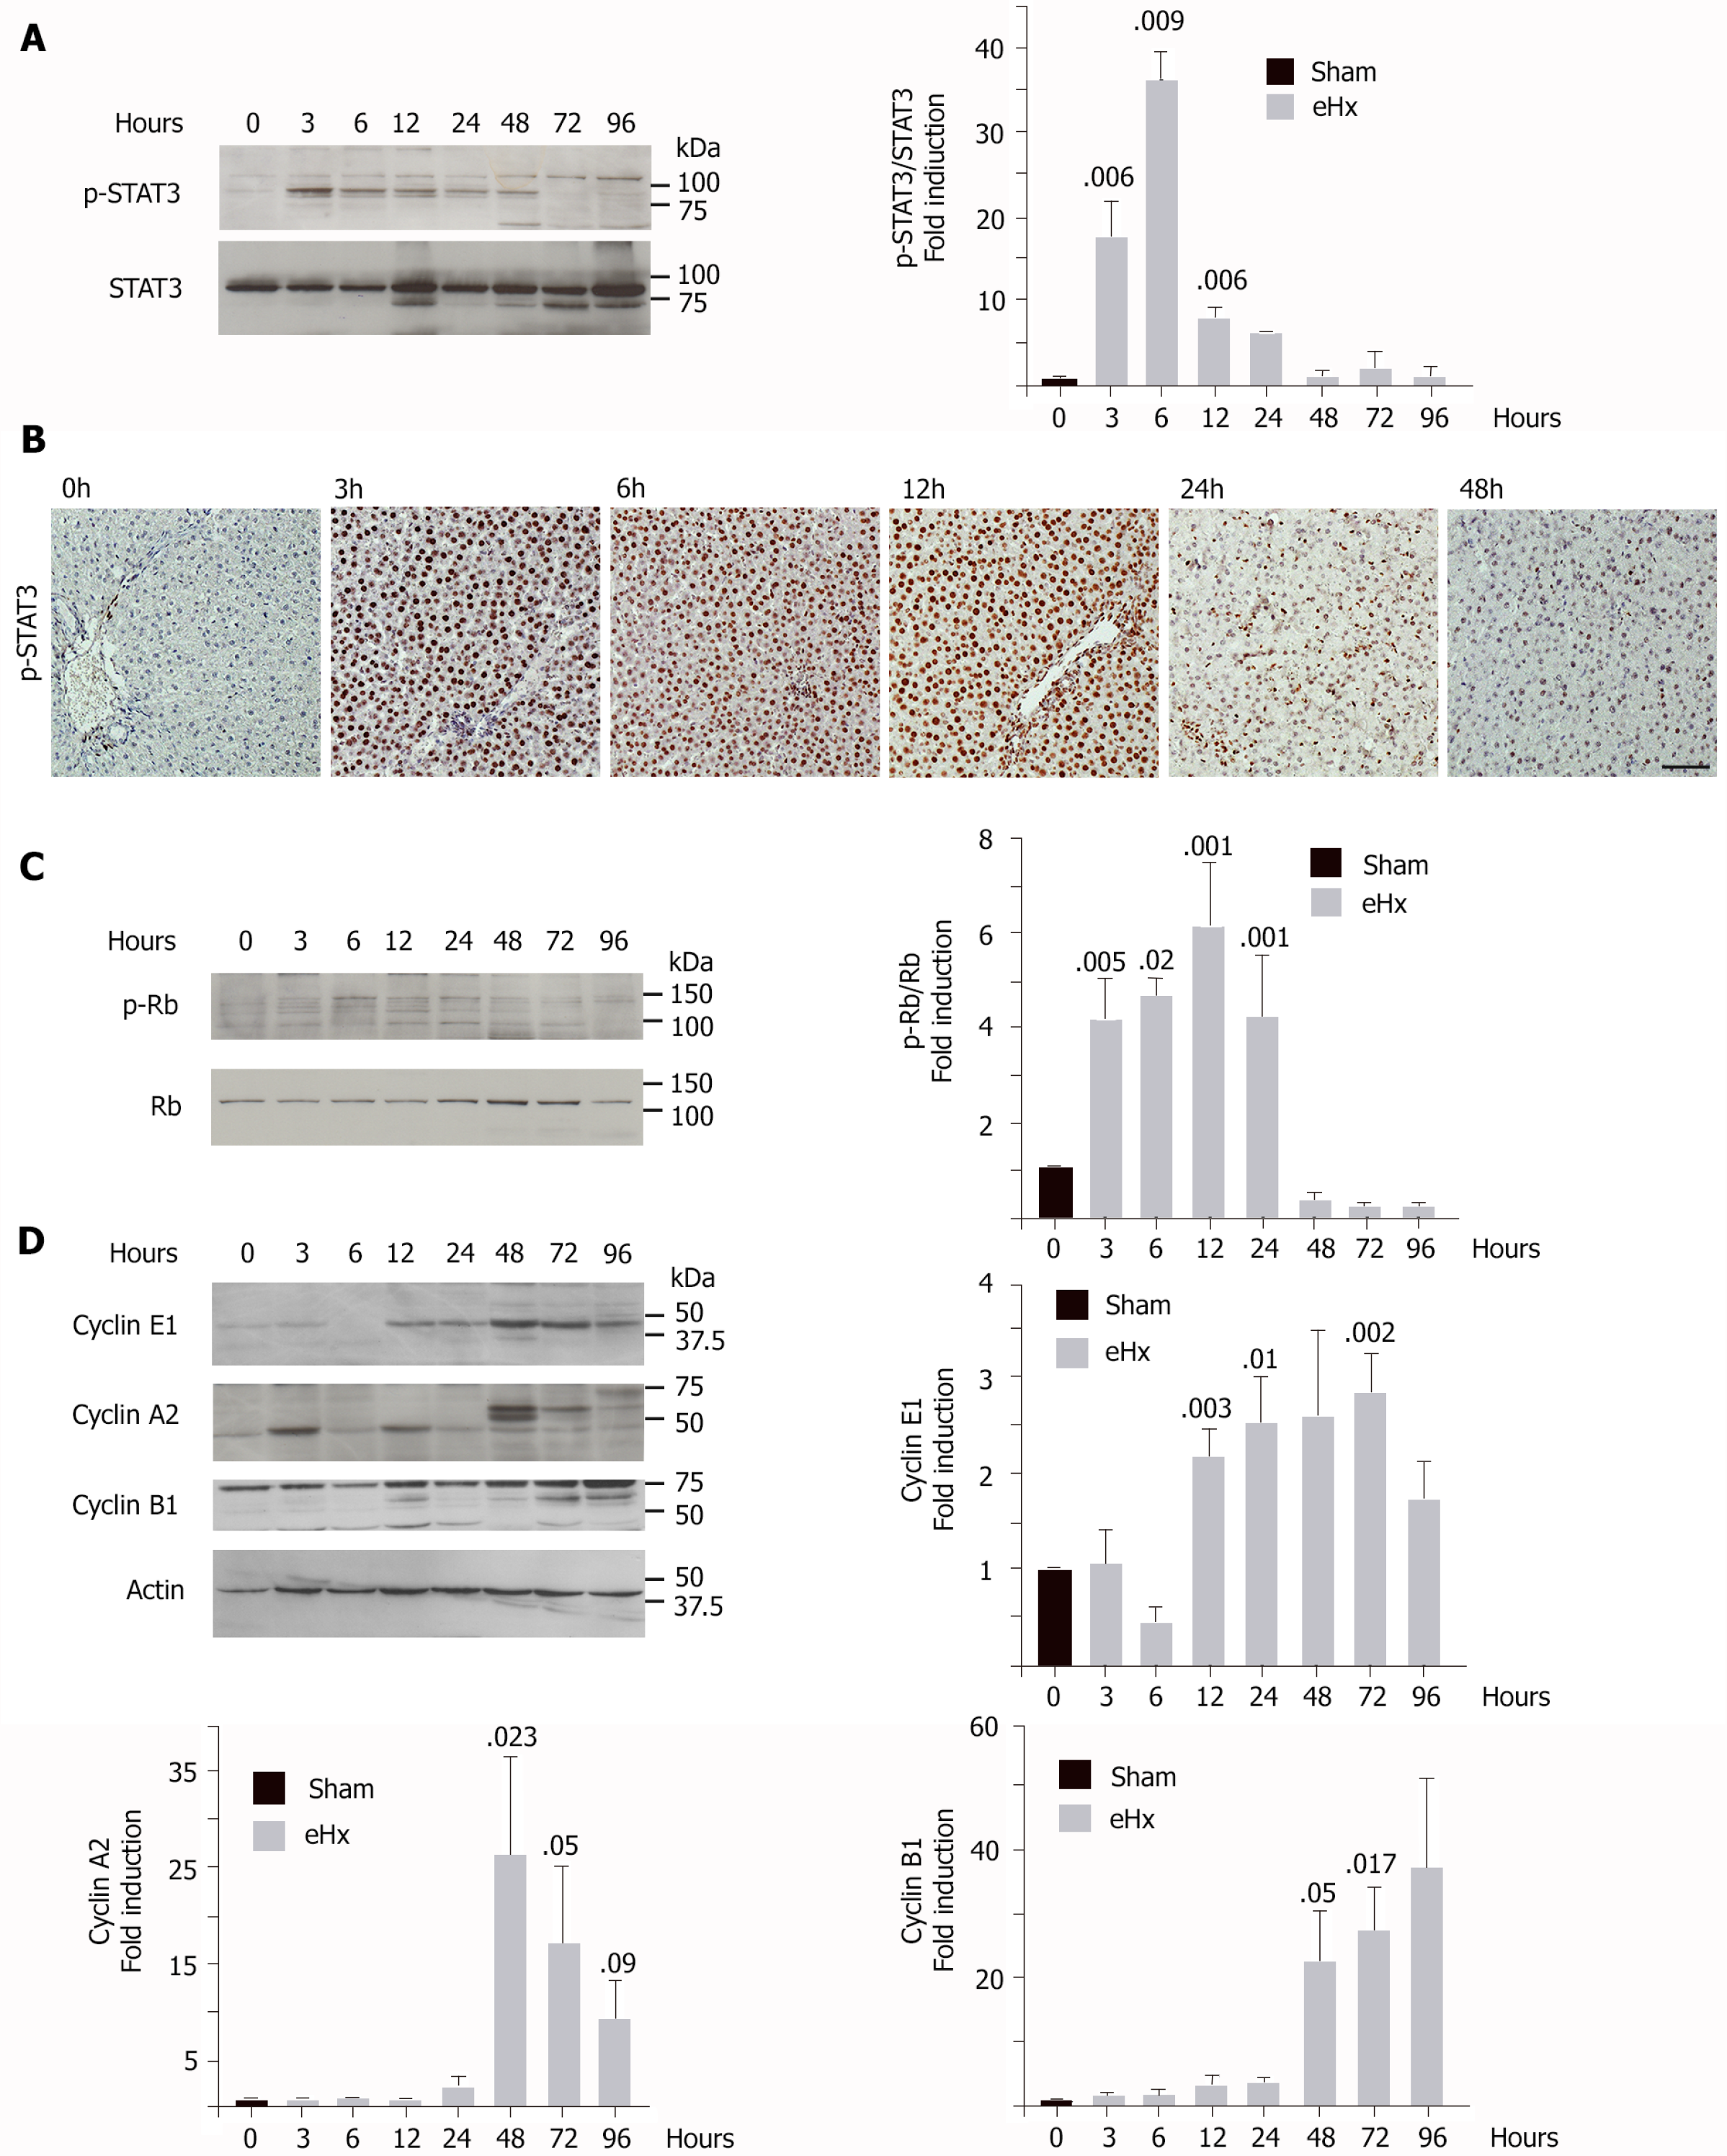
Figure 4 Expression and activation of cell cycle proteins during liver regeneration.
Extracts from rat liver tissues harvested at the indicated time points after extended hepatectomy (eHx) were subjected to western blot and immunohistochemistry. A and B: Signal transducer and activator of transcription 3 (STAT3) activation; C: Retinoblastoma protein (Rb) inactivation; D: Cyclin E1, A2, and B1 expression. Bar graphs represent the mean densitometry value ± standard error of the mean n = 6 rats per time point. Sham: Laparotomy control group.
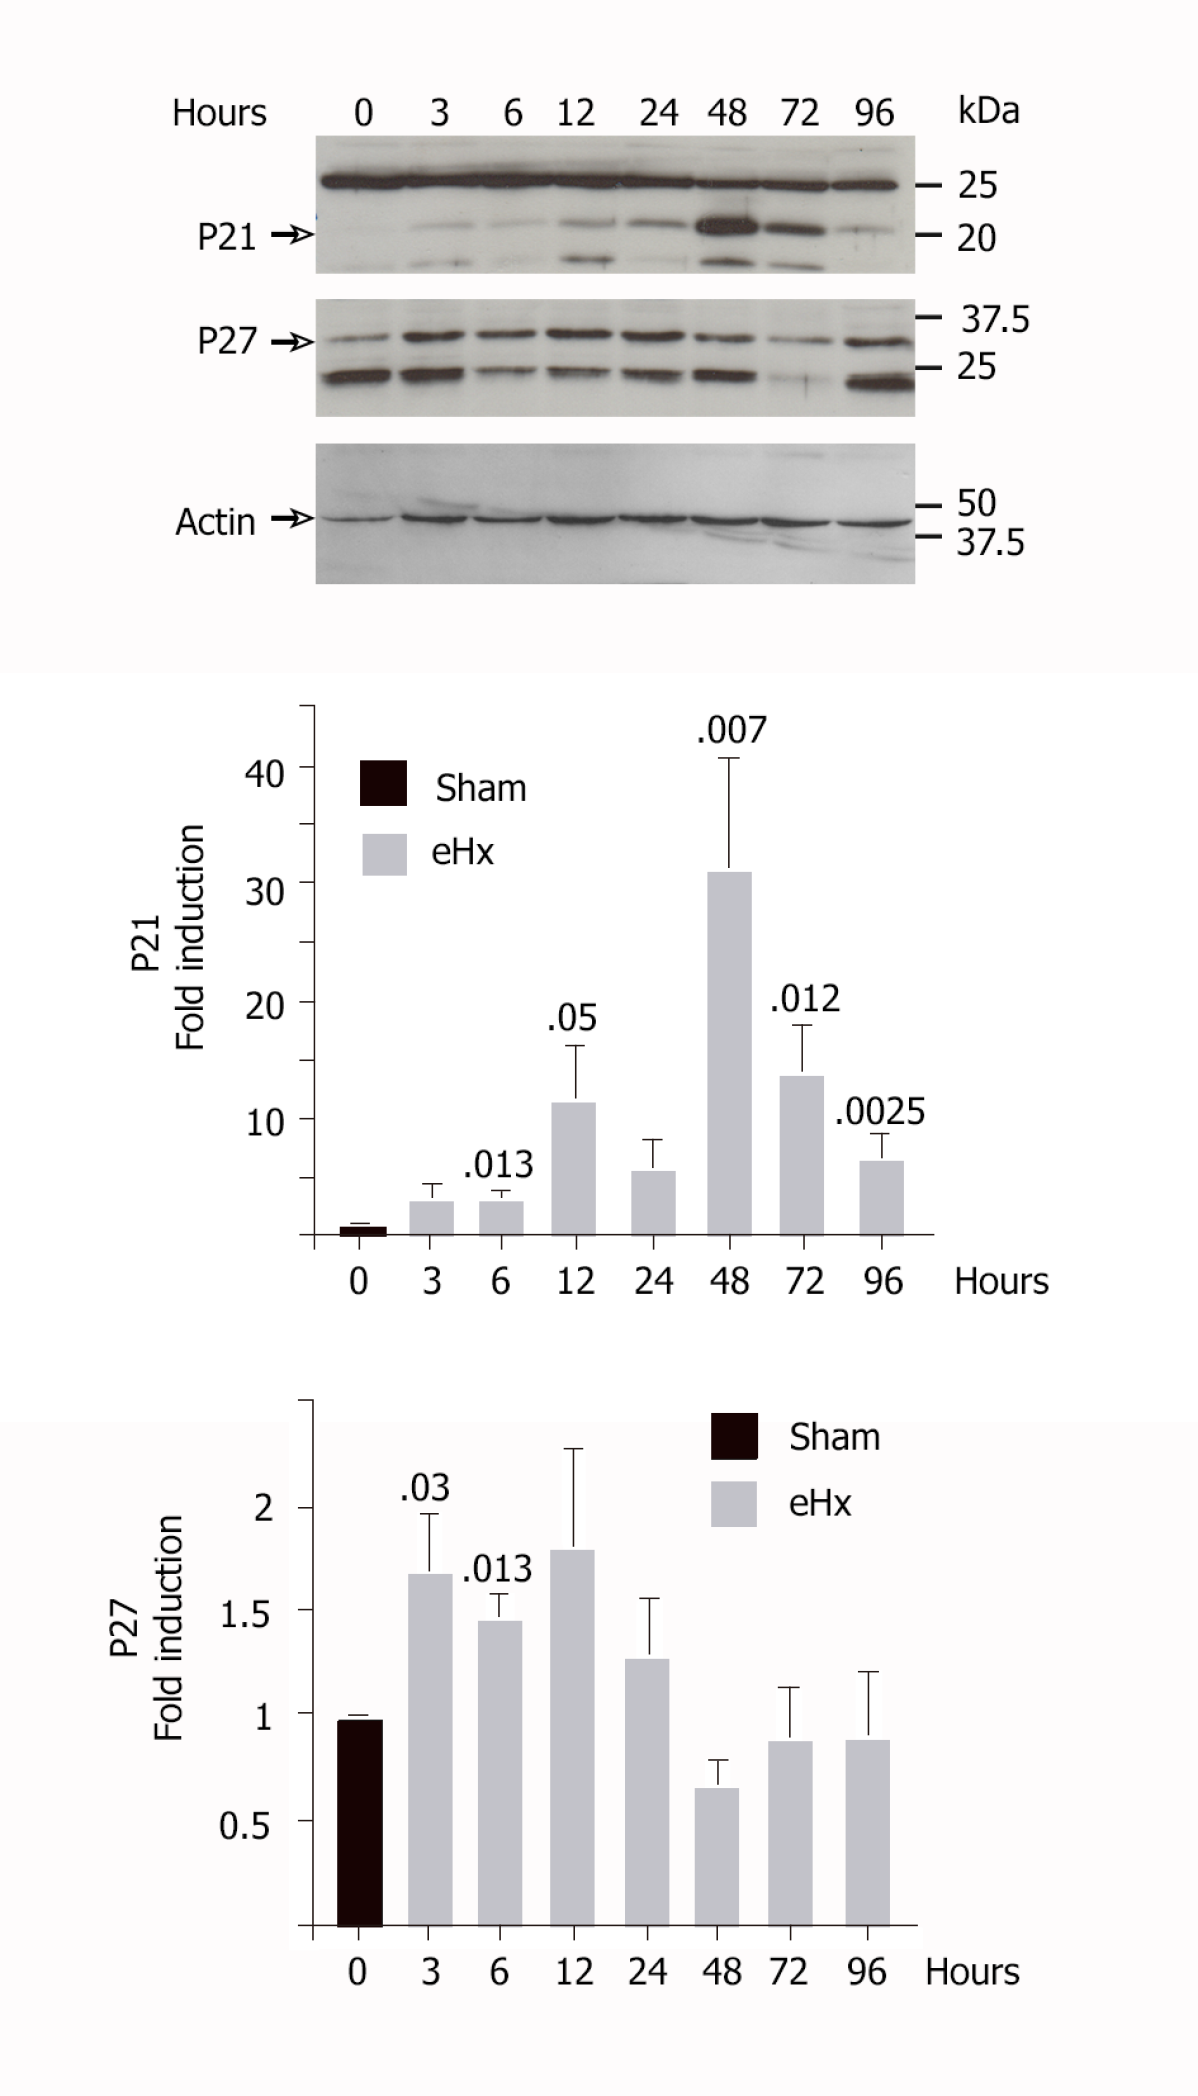
Figure 5 Increased expression of p21 and p27 in regenerating rat liver.
The expression of p21 and p27 was investigated using western blot performed on snap-frozen liver samples collected at the indicated time points post-extended hepatectomy (eHx). Six rats were studied for each time point. A representative image is presented in the upper part of the figure, and the mean values for 6 rats per condition are shown as bar graphs. Sham animals correspond to the laparotomy group. Sham: Laparotomy control group.
- Citation: Moniaux N, Lacaze L, Gothland A, Deshayes A, Samuel D, Faivre J. Cyclin-dependent kinase inhibitors p21 and p27 function as critical regulators of liver regeneration following 90% hepatectomy in the rat. World J Hepatol 2020; 12(12): 1198-1210
- URL: https://www.wjgnet.com/1948-5182/full/v12/i12/1198.htm
- DOI: https://dx.doi.org/10.4254/wjh.v12.i12.1198


