Copyright
©2009 Baishideng.
World J Hepatol. Oct 31, 2009; 1(1): 98-102
Published online Oct 31, 2009. doi: 10.4254/wjh.v1.i1.98
Published online Oct 31, 2009. doi: 10.4254/wjh.v1.i1.98
Figure 1 Schematic representation of the constructed transgene of HDGF.
Schematic representation of the constructed fragments used in the generation of transgenic mice. A DNA fragment covering the entire cDNA of the mouse HDGF was inserted into the expression vector, which contains promoter and enhancer of mouse albumin gene.
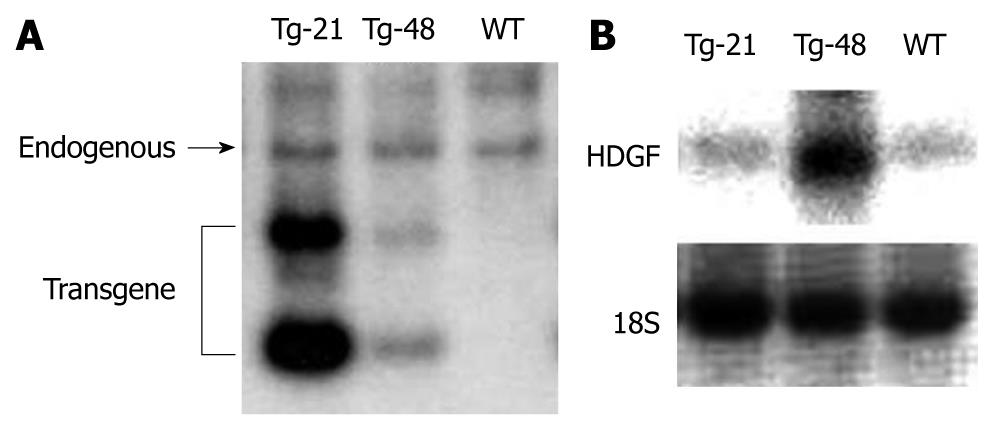
Figure 2 Genomic integration and mRNA expression of the HDGF-transgene.
A: Southern blot analysis with HDGF cDNA probe. Genomic DNA was isolated from individual mouse tails and Southern blot analysis was performed according to standard methods. The bands representing endogenous HDGF and transgenes are shown. Genomic DNA of a transgenic mice (line number 21: Tg-21) contains high copy numbers of the transgene. Genomic DNA of the other transgenic mice (line number 48: Tg-48) contains low copy numbers of the transgene; B: Northern blot analysis with HDGF cDNA probe. Total RNA was isolated from liver tissues of both transgenic (Tg) and wild-type (WT) mice. Twenty micrograms of total RNA extracted was loaded and hybridized with mouse cDNA of the HDGF-specific sequence. HDGF expression was high in the liver of the Tg-48 mouse. The expression level of HDGF in the liver of Tg-21 was almost equal to the level expressed in the control liver. Ribosomal RNA of 18S is shown in the lower panel.
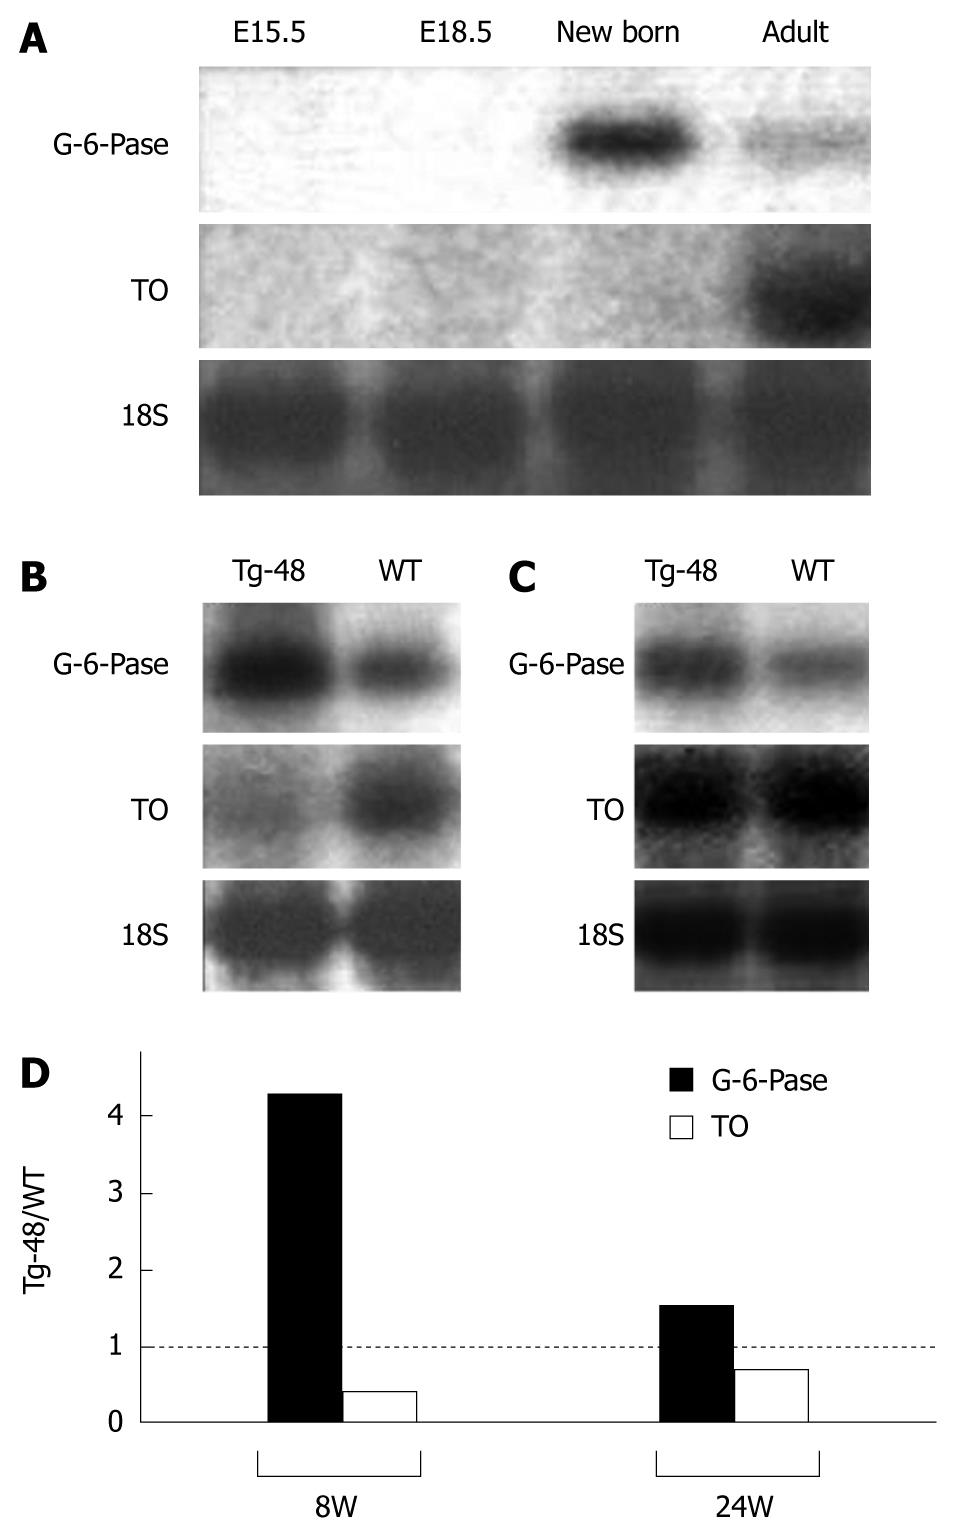
Figure 3 The expression of differentiation marker genes of hepatocytes.
A: The expression of differentiation marker genes of hepatocytes in normal mice. RNA was extracted from fetal mice of E (embryonic day) 13.5 and 15.5, and postnatal mice of zero weeks (new born) and 8 wk after birth. Twenty micrograms of total RNA was loaded and hybridized with mouse cDNA probes. Ribosomal RNA of 18S is shown in the lowest panel; B: The expression of differentiation marker genes of hepatocytes in adult (8 wk) transgenic mice. In the control liver of 8-wk-old mouse, G-6-Pase expression is low and TO expression is high. In contrast, G-6-Pase expression is high and TO expression is low in the transgenic liver. Ribosomal RNA of 18S is shown in the lowest panel; C: The expression of differentiation marker genes of hepatocytes in adult (24w) transgenic mice. Unlike the 8-wk-old mouse, expression levels of G-6-Pase and TO show small differences between the transgenic liver and the normal liver. Ribosomal RNA of 18S is shown in the lowest panel. D: Densitometry measurements of Northern blot analysis. Northern blot signals in Figure 3B and C were measured and normalized by the internal control bands (18S). The expression levels of G-6-Pase and TO in the liver of Tg-48 mouse were compared with the levels in the control liver. The ratios of band intensities (Tg-48/WT) were graphically shown. Two independent experiments were conducted in duplicate, and similar results were obtained.
- Citation: Enomoto H, Nakamura H, Komatsu-Kanatani N, Liu Y, Yoshida K, Okuda Y, Yamamoto T, Liu W, Nishiguchi S. Partial blockage of hepatocyte maturation in hepatoma-derived growth factor transgenic mice. World J Hepatol 2009; 1(1): 98-102
- URL: https://www.wjgnet.com/1948-5182/full/v1/i1/98.htm
- DOI: https://dx.doi.org/10.4254/wjh.v1.i1.98


