Copyright
©The Author(s) 2016.
World J Stem Cells. Oct 26, 2016; 8(10): 342-354
Published online Oct 26, 2016. doi: 10.4252/wjsc.v8.i10.342
Published online Oct 26, 2016. doi: 10.4252/wjsc.v8.i10.342
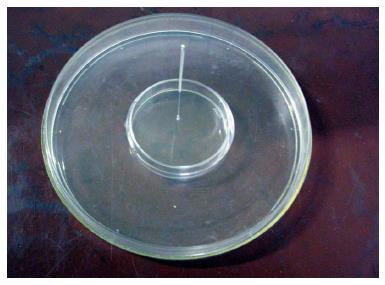
Figure 1 A general view of the culture dish with the needle.
The magnetized acu-puncture needle is in the center. The needle passes through the cover of the outer dish (the “shirt”), then passes through the cover of the inner dish (the culture dish) and reaches the bottom of the culture dish. The needle is held in an upright position by both the “shirt” cover and the culture dish cover.
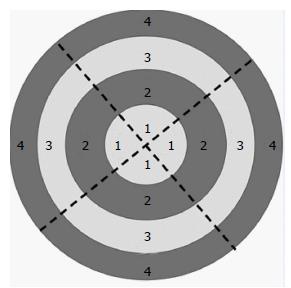
Figure 2 The scheme for photographic fields of the bottom of the culture dish.
The numbers mark the concentric regions: The central region (1); the area near the central region (2); the area near the fringe region (3); the fringe region (4). The dotted lines divide the bottom into four sectors. Each sector comprises four photographic fields; thus, overall, there are 16 photographed fields for each culture dish.
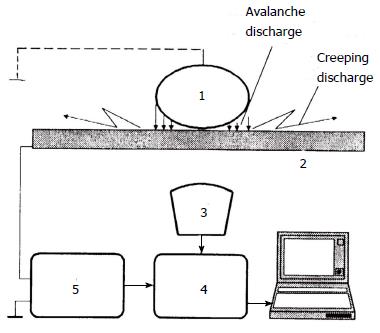
Figure 3 The scheme of a device for studying the characteristics of gas discharge visualisation.
An object of a study with an attached grounding electrode (1); a trans-parent electrode (2); an optical system (3); video converter (4); electronic components (5). The optical system (3) produces photographs of the electron avalanche and the creeping gas discharges through the transparent electrode (2) (cited in Korotkov, 2001).
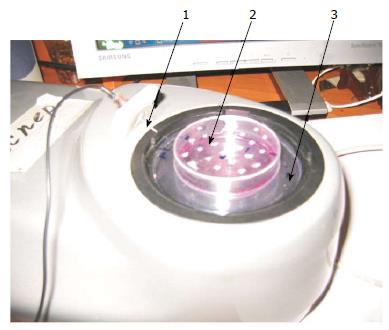
Figure 4 A general view of the experimental setup using the gas discharge visuali-sation Pro Camera.
The grounding electrode (1). A culture dish with culture medium covered with the specially designed lid (2) with openings for the introduction of the grounding electrode (1) at different locations. The dish holder (3). A transparent electrode covers the whole area under the holder (3) and the culture dish (2). To take gas discharge visualisation photos, the grounding electrode (1) is set in one of the lid holes to the depth of contact with liquid. After that, photography was performed in the dark.
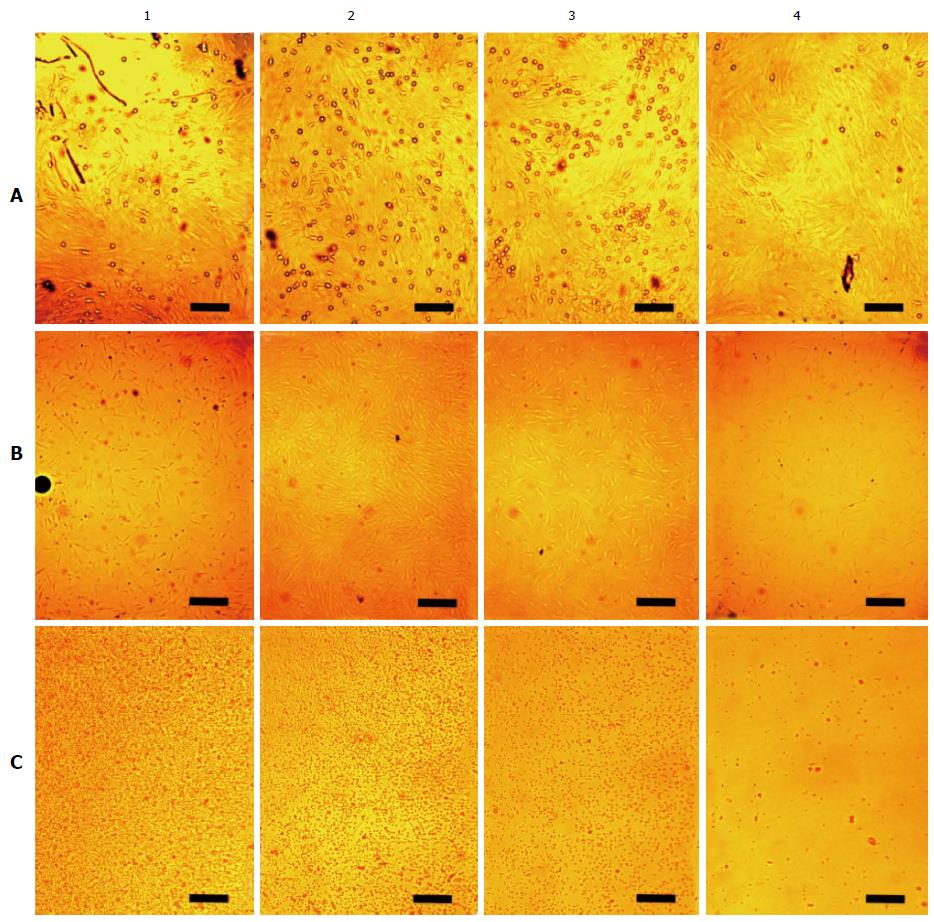
Figure 5 Arrangements of living unstained cells in affecting the magnetized needle.
Snapshots were carried out in four perpendicular directions from the center of the cultural dish in four concentric areas fixed width (Figure 2). In columns: The central region (1); the area near the central region (2); the area near the fringe region (3); the fringe region (4). In rows: A: Arrangements at the dish bottom of rBMSCs cultured for 6 d under the influence of the magnetized needle (the needle in the center of the culture dish). The small rounded cells of approximately a micron are seen over the cell monolayer. They are unevenly distributed, depending on their distance from the center of the dish. The bar is 10 μm; B: Arrangements of hBMSCs cultured for 1 d under the influence of the needle (the needle in the center of the culture dish). The dark round trace of the needle is seen on the left edge of the photo B1. The bar is 25 μm; C: Migration of human mononuclear leukocytes during a day without expo-sure to the needle. The bar is 10 μm. rBMSCs: Rat bone marrow-derived stromal stem cells; hBMSCs: Human bone marrow-derived stromal stem cells.
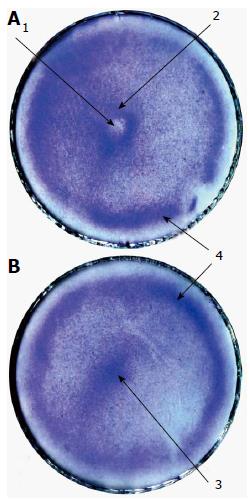
Figure 6 The effect of a metal rod (needle) on the arrangement of rat bone marrow-derived stromal stem cells.
rBMSCs in 4 mL of culture medium were plated in 50-mm culture dishes at 20000 cells/cm2 and cultured with the needle in the centre of the dishes (A) or without the needle (B) for one day. Cells in the dishes were fixed and stained with crystal violet. The vertical walls of the dishes were removed. The stained bottoms of the dishes were scanned. Arrows mark the central depression (1); the central ring (2); the central heap (3); and the peripheral ring (4). rBMSCs: Rat bone marrow-derived stromal stem cells.
Figure 7 The effect of the needle on the redistribution rat bone marrow-derived stromal stem cells when setting the needle away from the centre of the culture dish.
A: The dish in the absence of the effect; B: Control without the needle; C: The needle in the centre; D: The needles away from the centre, with the placement of the needle as indicated by a dot. Explanations are provided in the text.
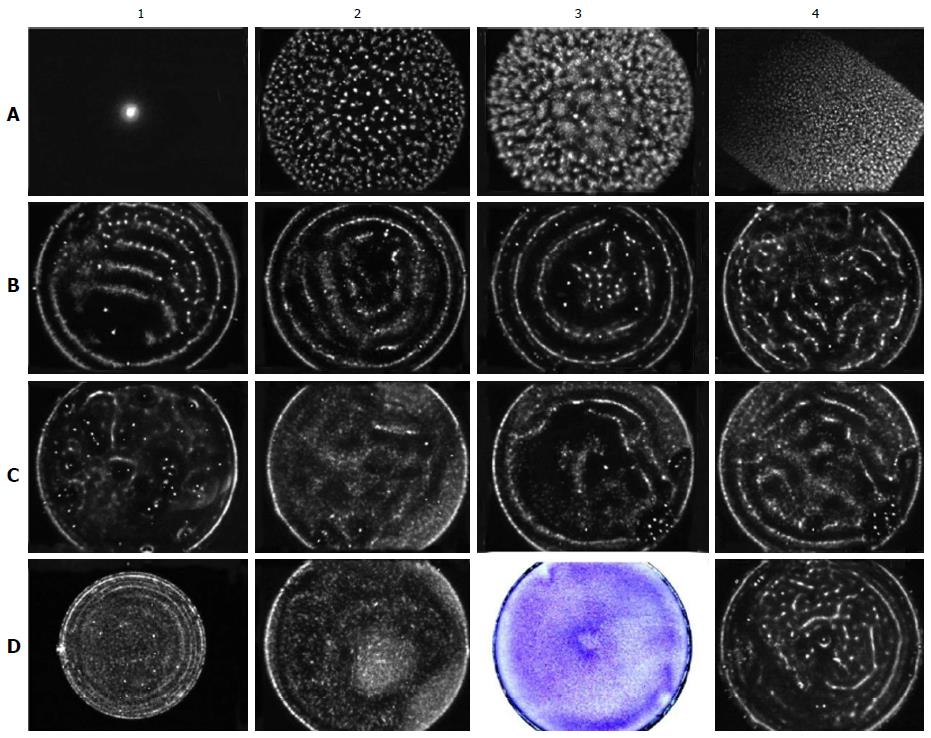
Figure 8 Evaluation of the structure of the electromagnetic field in the dishes using the gas discharge visualisation method.
Except where otherwise stated, the experimental conditions are as follows: A 50-mm culture dish with a negatively charged bottom, the grounding electrode in the centre of the dish, a voltage of 115 V, an exposure time of 20 s, and a liquid volume of 3 mL. GDG from an empty dish (A1). Water GDG (A2). GDG from a dish with a hydrophobic, uncharged bottom filled with PBS (A3). GDG from a square culture cuvette filled with PBS (A4). GDG from the dish filled with PBS when the grounding electrode is in the centre (B1, note the gap in the lower left quadrant due to the uneven distribution of the charge on the bottom of the dish), equidistant from the centre and the edge (B2), and at the side (B3) of the dish. GDG from the complete culture medium α-MEM (B4). GDG from α-MEM incubated in the dish at 37 °C for one day (C1). GDG from the dish containing NCTCs at 25 × 103 cells/cm2, at a voltage of 90 V (C2) and at a voltage of 115 V, with exposure for 10 (C3) and 20 s (C4). GDG from a 35-mm culture dish with NCTCs at 25 × 103 cells/cm2, at a voltage of 125 V (D1). GDG from rBMSCs incubated with the magnetised needle for one day (D2). The same cells after fixation and staining (D3). GDG from E. coli at 200 × 103 cells/mL. rBMSCs: Rat bone marrow-derived stromal stem cells; GDG: Gas discharge glow; E. coli: Escherichia coli.
- Citation: Emelyanov AN, Borisova MV, Kiryanova VV. Model acupuncture point: Bone marrow-derived stromal stem cells are moved by a weak electromagnetic field. World J Stem Cells 2016; 8(10): 342-354
- URL: https://www.wjgnet.com/1948-0210/full/v8/i10/342.htm
- DOI: https://dx.doi.org/10.4252/wjsc.v8.i10.342


