Copyright
©The Author(s) 2015.
World J Stem Cells. Aug 26, 2015; 7(7): 1064-1077
Published online Aug 26, 2015. doi: 10.4252/wjsc.v7.i7.1064
Published online Aug 26, 2015. doi: 10.4252/wjsc.v7.i7.1064
Figure 1 Cell viability and growth of embryonic stem cells encapsulated in self-assembling three-dimensional scaffolds.
Enhanced yellow fluorescent protein-labeled ESCs were encapsulated (2 × 10⁶ cells/mL) in fixed and floating scaffolds prepared using Dex-SH with 7.5% thiol substitution and PEG-4-Acr. Encapsulated cells were cultured in ESC medium and periodically cell growth was visualized using fluorescent microscopy. A and B: Live (green) and dead (yellow) cells in fixed scaffolds stained with PI at day 1 and week 3, respectively. While the viable cells increased with time, the number of dead cells remained constant. Scale bars = 100 μm; C and D: Three-dimensional (3-D) confocal images of floating scaffolds representing ESC growth at day 3 and week 3, respectively; E: Growth of ESCs encapsulated in 3-D scaffolds was assayed by direct count using hemocytometer. Cells seeded in 3-D scaffolds (at 2 × 10⁶ cells/mL) were incubated in ESC medium and counted at various time intervals. Data presented as cell number (x 106 cells/mL) ± SE (n = 3) and plotted against the days of incubation; F: Quantitative determination of ESC proliferation in floating scaffolds at week 0, 1, 2, 3, and 4 of culture after staining with PB as analyzed by microplate reader. The results were expressed as the normalized absorbance ± SE (n = 3), with a significant increase in cell number, compared to initial ESC viability at time 0. aP < 0.05 and bP < 0.01 using one-way ANOVA with the non-equal variance hypothesis and Games-Howell multiple comparisons test. ESCs: Embryonic stem cells; Dex-SH: Thiol functionalized dextran; PEG-4-Acr: Polyethylene glycol tetra-acrylate.
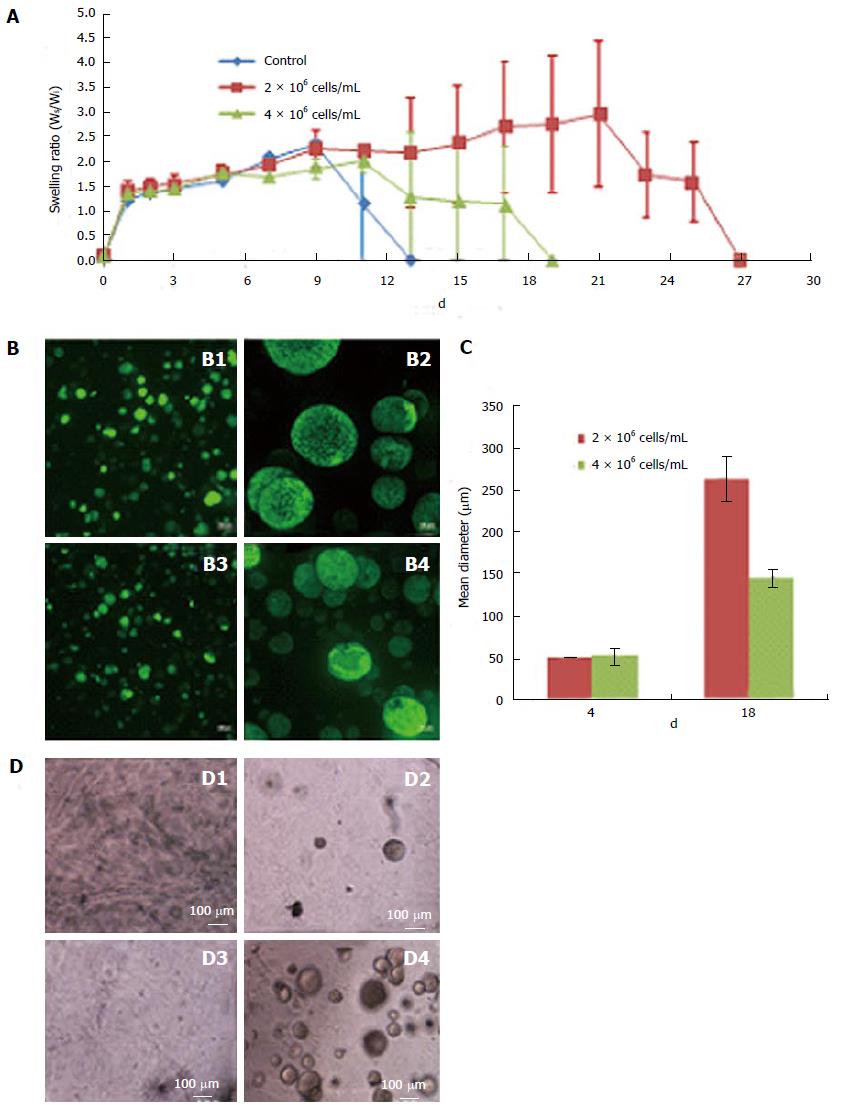
Figure 2 Effect of cell concentration on the rate of scaffold degradation and embryonic stem cells colony size.
A: Swelling tests of floating scaffolds prepared with 7.5% thiol substitution were used to compare the rate of degradation of scaffolds prepared with various cell concentrations (0, 2 × 10⁶ cells/mL and 4 × 10⁶ cells/mL). Scaffolds with and without ESCs were incubated in ESC medium and weighed periodically. Data expressed as the mean swelling ratio (Ws/Wi) ± SE (n = 3); B: Representative composite confocal images of ESCs grown in floating scaffolds encapsulating 2 × 10⁶ cells/mL (B1 and B2) and 4 × 10⁶ cells/mL (B3 and B4) at day-4 and day-18, respectively. Scale bars = 100 μm; C: Quantification of ESC colony size in floating scaffolds encapsulating 2 × 10⁶ cells/mL or 4 × 10⁶ cells/mL at day-4 and day-18 of culture. Cell colony size was expressed as mean diameter (μm) ± SE (n = 3); D: Growth of low concentrations of ESCs in 3-D scaffolds. Light micrographs of the scaffolds encapsulating 1 × 10⁴ cells/mL at day-0 and day-7 (D1 and D2, respectively) and 1 × 10⁵ cells/mL at day-0 and day-7 (D3 and D4 respectively). Scale bars = 100 μm. ESCs: Embryonic stem cells; 3-D: Three-dimensional.
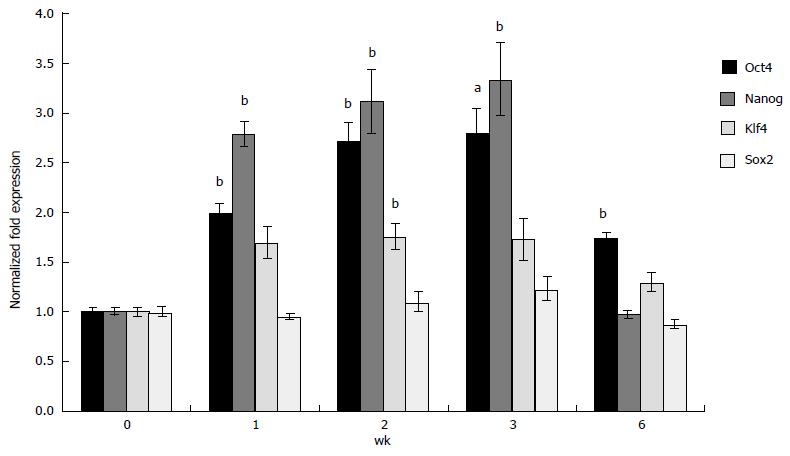
Figure 3 Expression of pluripotent markers in three-dimensional grown embryonic stem cells.
ESCs in scaffolds prepared with Dex-SH with 33% thiol substitution were cultured and analyzed for the expression of selected markers, Oct4, Nanog, Klf4, and Sox2 using qRT-PCR at week 0, 1, 2, 3, and 6. Results of experiments were expressed as the fold expression ± SE (n = 3) normalized to reference genes Gapdh and β-Actin, where a significant (aP < 0.05 and bP < 0.01) increase of pluripotent marker expression was compared to initial 2-D grown ESCs (day 0), using one-way ANOVA with the non-equal variance hypothesis and Dunnett’s multiple comparisons test. Results depicted showed upregulation of Oct4, Nanog, and Klf4, but Sox2 was maintained at levels similar to the control. Expression of Oct4 and Nanog was successively and significantly higher at week 1, 2 and 3 until the onset of degradation (week 6), at which point their expression was decreased to initial levels. ESCs: Embryonic stem cells; Dex-SH: Thiol funtionalized dextran; qRT-PCR: Quantitative real time polymerase chain reaction; 2-D: Two-dimensional.
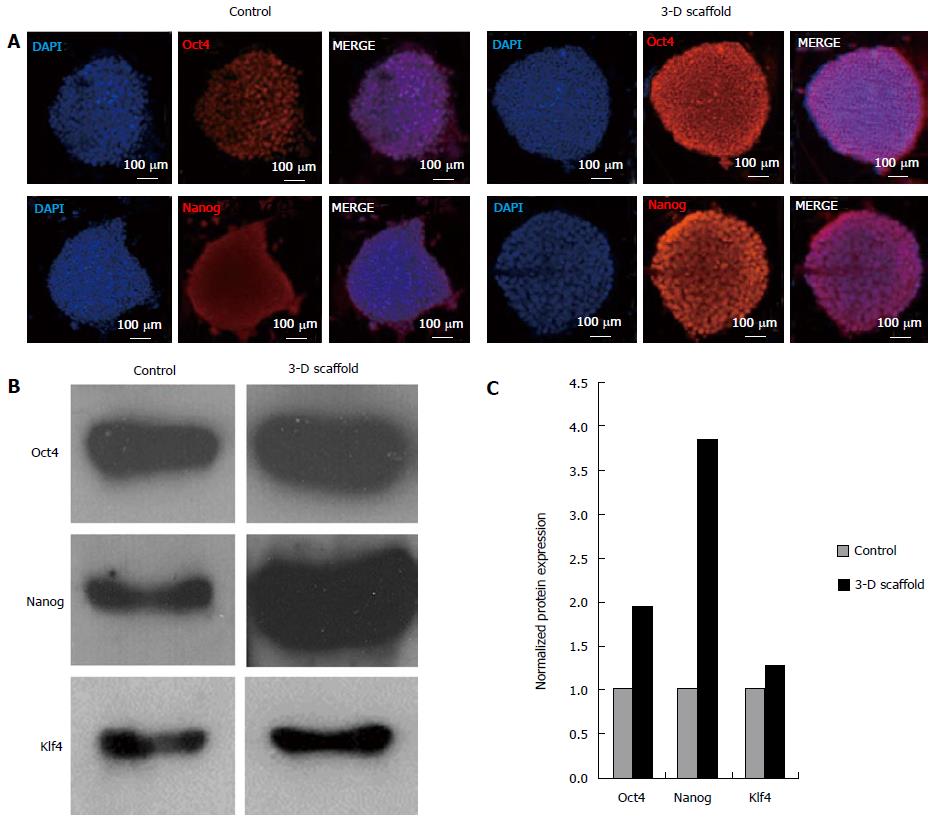
Figure 4 Protein expression of pluripotency markers in embryonic stem cells grown in two-dimensional and three-dimensional cultures.
ESCs grown in two-dimensional (2-D) and in 3-D floating scaffolds (prepared with 33% thiol substitution) were analyzed by immunofluorescence staining and western blotting. A: Cells grown in 2-D culture and 3-D scaffolds for 2 wk were cultured on coverslips for 2 d and stained with primary antibodies, Oct4 and Nanog, treated with Alexa Fluor 568 conjugated secondary antibodies, and counterstained with DAPI. Confocal images depicted an increase in Oct4 and Nanog protein expression in 3-D scaffold grown ESCs compared to 2-D cultured cells; B: Western blot analysis showed increased expressions of Oct4, Nanog, and Klf4 proteins in ESCs grown in the 3-D scaffold for 2 wk compared to initial 2-D grown ESCs (day 0). Cell were lysed in RIPA buffer and aliquots containing an equal amount of protein (10 μg) were subjected to 12% polyacrylamide gel electrophoresis, transferred to nitrocellulose membranes, and probed with antibodies against Oct4, Nanog, and Klf4; C: Quantitative analysis of western blots (normalized to β-actin levels) showed that Oct4, Nanog and Klf4 protein levels in 3-D grown cells were increased by 1.9, 3.9 and 1.3 fold, respectively, as compared to 2-D cultured controls. Representative results are shown. ESCs: Embryonic stem cells. DAPI: 4′,6-diamidino-2-phenylindole dihydrochloride.
Figure 5 Three-dimensional grown embryonic stem cells were subcultured under two-dimensional culture conditions expressed normal levels of pluripotent markers.
A: Light micrographs depicting cell morphology of the initial ESCs used for encapsulation (A1), cultured in three-dimensional (3-D) scaffolds for 2 wk (A2), and subsequently passaged 5 times in 2-D culture (A3); B: Expression of Oct4, Nanog, and Klf4 in ESCs grown in 2-D culture, 3-D grown ESCs, and 3-D grown ESCs, which were subsequently passaged 5 times in 2-D culture as determined by qRT-PCR. Results were expressed as the fold expression ± SE (n = 3) normalized to reference genes Gapdh and β-Actin where a significant (aP < 0.05 and bP < 0.01) increase of marker expression was compared to initial 2-D grown ESCs, using one-way ANOVA and Tukey multiple comparisons test. ESCs: Embryonic stem cells; MEF: Mouse embryonic fibroblasts; qRT-PCR: Quantitative real time polymerase chain reaction; ANOVA: Analysis of variance.
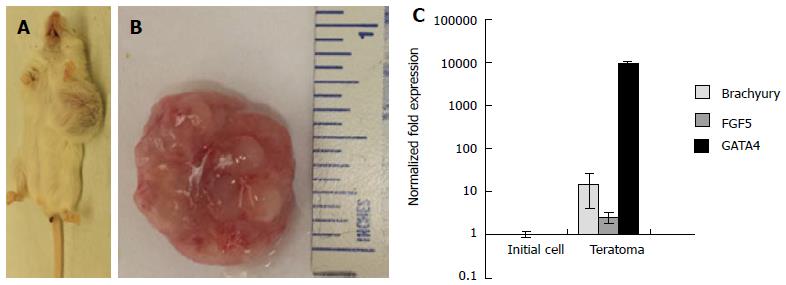
Figure 6 Three-dimensional grown embryonic stem cells formed teratomas in severe combined immunodeficient-beige mice.
Explanted teratoma tissues were analyzed for the expression of three germ layer markers. A: Gross images of tumor growth resulting from injection of 3-D grown ESCs. Tumor growth was observed in all mice injected (n = 3); B: Explanted tumor at 4 wk showed encapsulated, lobular and well-circumscribed gross morphology consistent with teratoma growth; C: Expression of germ layer markers, Brachyury, FGF5, and GATA4 representing mesoderm, ectoderm, and endoderm was analyzed by qRT-PCR. Results of tumor explants were expressed as fold expression ± SE (n = 3) normalized to reference genes Gapdh and β-Actin, and compared to initial cells injected in vivo. ESCs: Embryonic stem cells; qRT-PCR: Quantitative real time polymerase chain reaction..
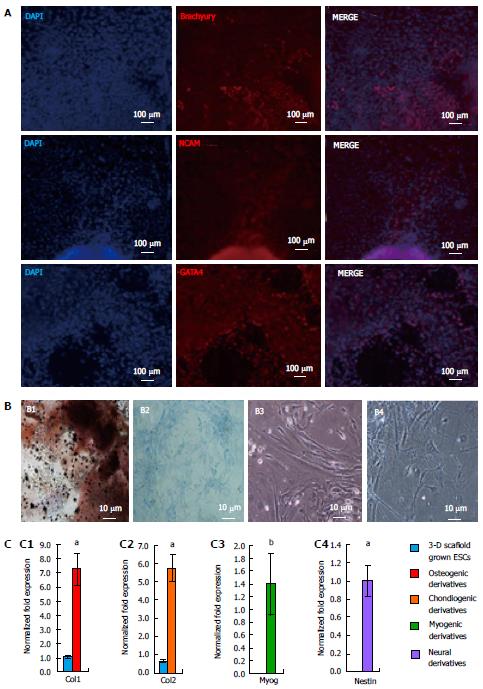
Figure 7 Differentiation potential of three-dimensional grown embryonic stem cells.
A: Embryoid bodies derived from ESCs grown in the 3-D scaffolds were allowed to spontaneously differentiate and analyzed by immunofluorescence staining with antibodies against all three germ layers. Confocal images depicted the presence of Brachyury, NCAM, and GATA4 protein expression, showing the potential of ESCs to differentiate into mesoderm, ectoderm, and endoderm, respectively; B: 3-D scaffold grown ESCs were also directed to differentiate via EB formation and selective induction media. Shown are light micrographs depicting cell morphology of ESC derivatives, osteogenic, chondrogenic, myogenic, and neural (B1, B2, B3, and B4 respectively). Osteogenic and chondrogenic derivatives were cultured for 4 wk and analyzed by von Kossa, and alcian blue staining, respectively. Osteogenic cell-specific ECM stained dark brown for calcium deposition (B1). Proteoglycan produced by chondrogenic derivatives stained blue; C: Expression of cell-specific markers in differentiated ESC derivatives expressed Col1 (C1), Col2 (C2), Myog (C3), and Nestin (C4) markers for osteogenic, chondrogenic, myogenic and neural cells, respectively. Results represent the fold expression ± SE (n = 3) normalized to reference genes Gapdh and β-Actin where a significant (aP < 0.05 and bP < 0.01) increase of marker expression was compared to initial 2-D grown ESCs (day 0), using one-way ANOVA with the non-equal variance hypothesis. ESCs: Embryonic stem cells; ANOVA: Analysis of variance..
- Citation: McKee C, Perez-Cruet M, Chavez F, Chaudhry GR. Simplified three-dimensional culture system for long-term expansion of embryonic stem cells. World J Stem Cells 2015; 7(7): 1064-1077
- URL: https://www.wjgnet.com/1948-0210/full/v7/i7/1064.htm
- DOI: https://dx.doi.org/10.4252/wjsc.v7.i7.1064


