Copyright
©The Author(s) 2015.
World J Stem Cells. May 26, 2015; 7(4): 776-788
Published online May 26, 2015. doi: 10.4252/wjsc.v7.i4.776
Published online May 26, 2015. doi: 10.4252/wjsc.v7.i4.776
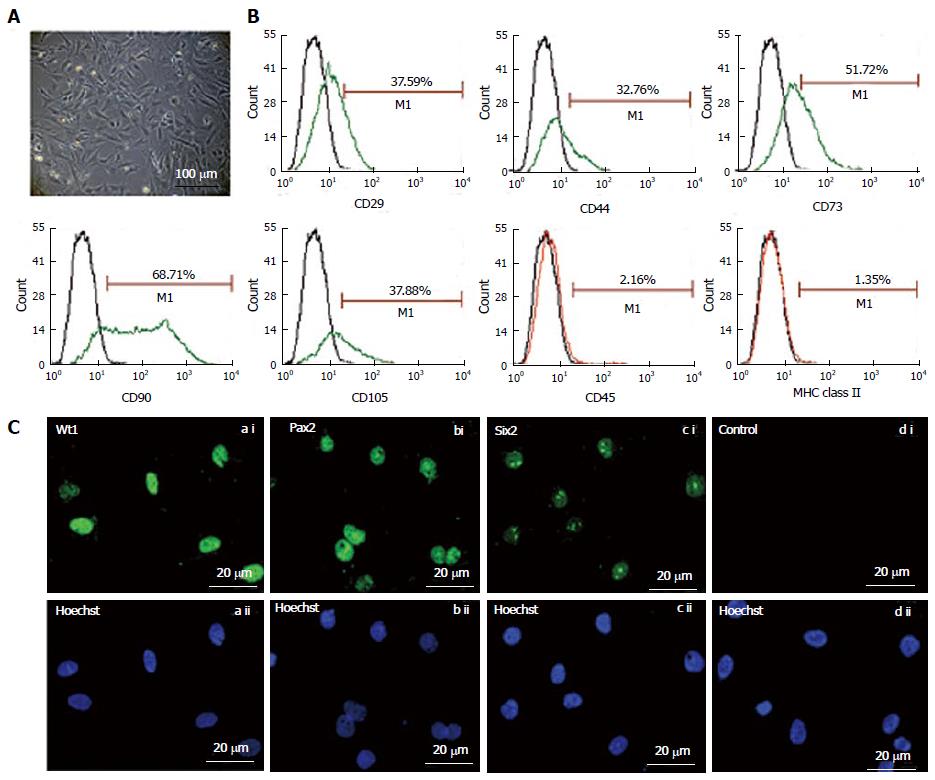
Figure 1 Morphology (A) and characterization of fetal kidney stem cells (B and C).
A: Representative photomicrograph (Scale bars indicate 100 μm) showing spindle-shaped and polygonal morphology of fetal kidney stem cells (fKSC); B: Phenotypic characterization of fKSC by flow cytometry showing expression of CD29, CD44, CD73, CD90, CD105, CD45, and MHC class II (green or red lines, detected with FITC - or phycoerythrin-conjugated antibodies, respectively) with isotype controls (black lines); C: Representative immunoflourescent photomicrographs (Scale bars indicate 20 μm) showing expression of renal progenitor markers viz. Wt1, Pax2 and Six2 on fKSC.
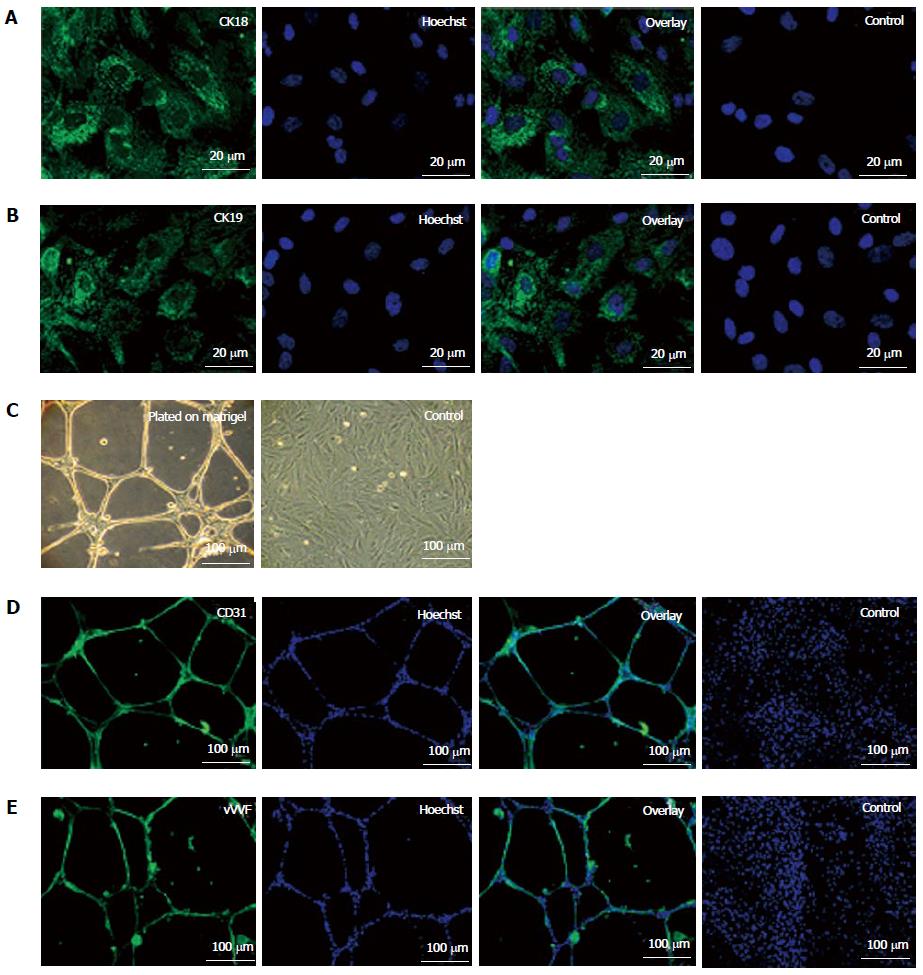
Figure 2 Epithelial differentiation (A, B) and angiogenic potential (C-E) of fetal kidney stem cells.
A: Representative photomicrograph (Scale bars indicate 20 μm) showing CK18 expression, Hoechst, overlay and untreated control cells with only Hoechst; B: Representative photomicrograph (Scale bars indicate 20 μm) showing CK19 expression, Hoechst, overlay and untreated control cells with only Hoechst; C: Representative photomicrographs (Scale bars indicate 100 μm) showing tubule like structure formation by fetal kidney stem cells (fKSC) cultured on matrigel and without matrigel as control; D: Representative immunoflourescent photomicrographs (Scale bars indicate 100 μm) showing CD31 expression, Hoechst, overlay and fKSC cultured without matrigel as controls with only Hoechst; E: Representative immunoflourescent photomicrographs (Scale bars indicate 100 μm) of fKSC cultured on matrigel showing Von Willebrand factor expression, Hoechst, overlay and fKSC cultured without matrigel as controls with only Hoechst.
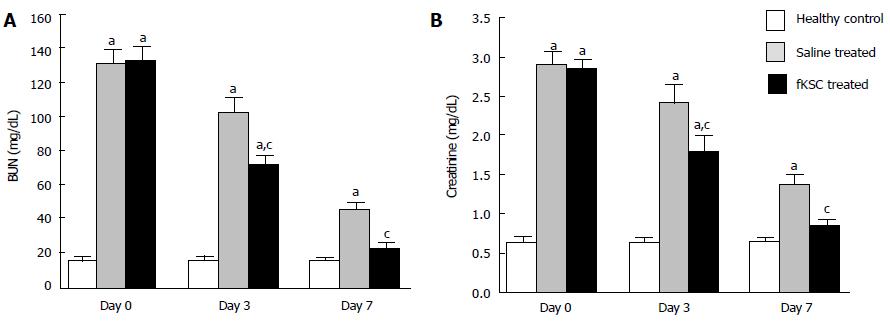
Figure 3 Effect of fetal kidney stem cells therapy on renal function in rats with cisplatin induced acute renal failure.
The changes in the levels of (A) blood urea nitrogen (BUN) and (B) serum creatinine in healthy control, saline treated and fetal kidney stem cells (fKSC) treated groups on day 0, 3 and 7 after fKSC therapy. Values expressed as Mean ± SE. aP < 0.05 for saline and fKSC treated vs healthy control group; cP < 0.05 for fKSC vs saline treated group.
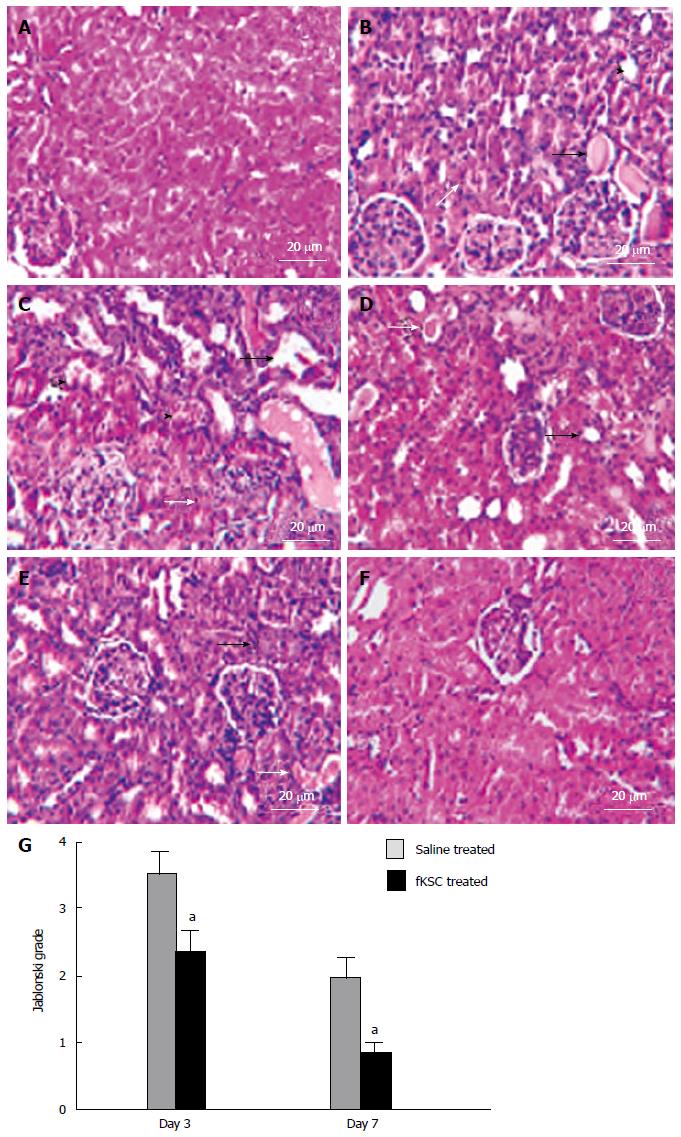
Figure 4 Fetal kidney stem cells attenuate renal structural damage in rats with cisplatin induced acute renal failure (Scale bars indicate 20 μm).
A: Kidney section of healthy control rats showing the normal architecture of tubules and glomeruli; B: Kidney section after 5 d of cisplatin treatment showing severe tubular necrosis (white arrow), hyaline cast formation (black arrow) and tubular dilatation (black arrow head); C: Kidney section of saline treated rats on day 3 of therapy showing severe tubular necrosis (white arrow), tubular vacuolization (black arrow) and tubular swelling and obstruction (black arrow head) with cell debris on day 3 after therapy; D: Kidney section of fetal kidney stem cells (fKSC) treated rats on day 3 of therapy showing attenuation of tubular injury with mild tubular dilatation (black arrow) and few hyaline casts inside the lumen (white arrow); E: Kidney section of saline treated rats on day 7 of therapy showing few necrotic tubular cells (black arrow) and luminal hyaline casts (white arrow); F: Kidney section of fKSC treated rats on day 7 of therapy fKSC showing almost normal architecture of tubules; G: Jablonski grading score of histological assessment of tubular necrosis in saline and fKSC treated kidneys on day 3 and day 7. Values expressed as mean ± SE. aP < 0.05 for fKSC vs saline treated group.
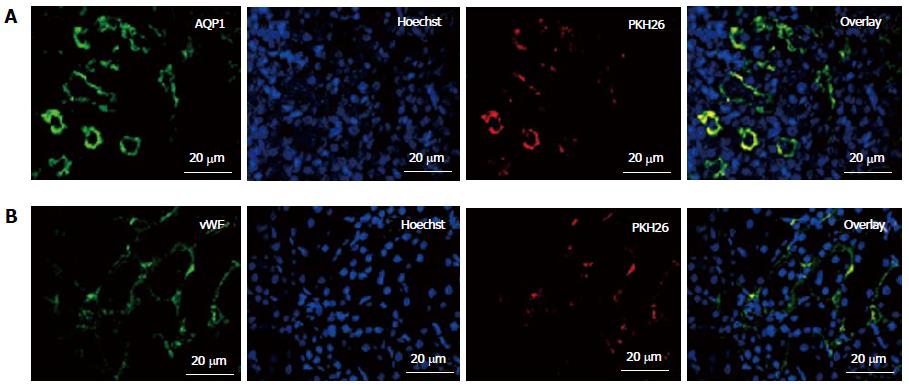
Figure 5 In vivo homing and engraftment of administered fetal kidney stem cells in renal tubules.
Representative immunofluorescent photomicrographs (Scale bars indicate 20 μm) showing engraftment of administered fetal kidney stem cells (fKSC) in renal tubules at day 7 of therapy, and expression of tubular epithelial and endothelial markers aquaporin (AQP)1 (A) and Von Willebrand factor (vWF) (B) respectively, with corresponding Hoechst, PKH26 labeled administered fKSC in injured kidney tissue respectively.
Figure 6 Effects of fetal kidney stem cells on apoptosis and proliferation of tubular cells in cisplatin injured kidney.
A: Quantification of dUTP nick-end labeling (TUNEL)-positive cells in kidney sections of saline and fetal kidney stem cells (fKSC) treated groups at day 3 and 7 after fKSC therapy; B: Quantification of proliferating cell nuclear antigen (PCNA)-positive cells in kidney sections of saline and fKSC treated groups at day 3 and 7 after fKSC therapy. Values expressed mean ± SE. aP < 0.05 for fKSC vs saline treated group. HPF: High-power field.
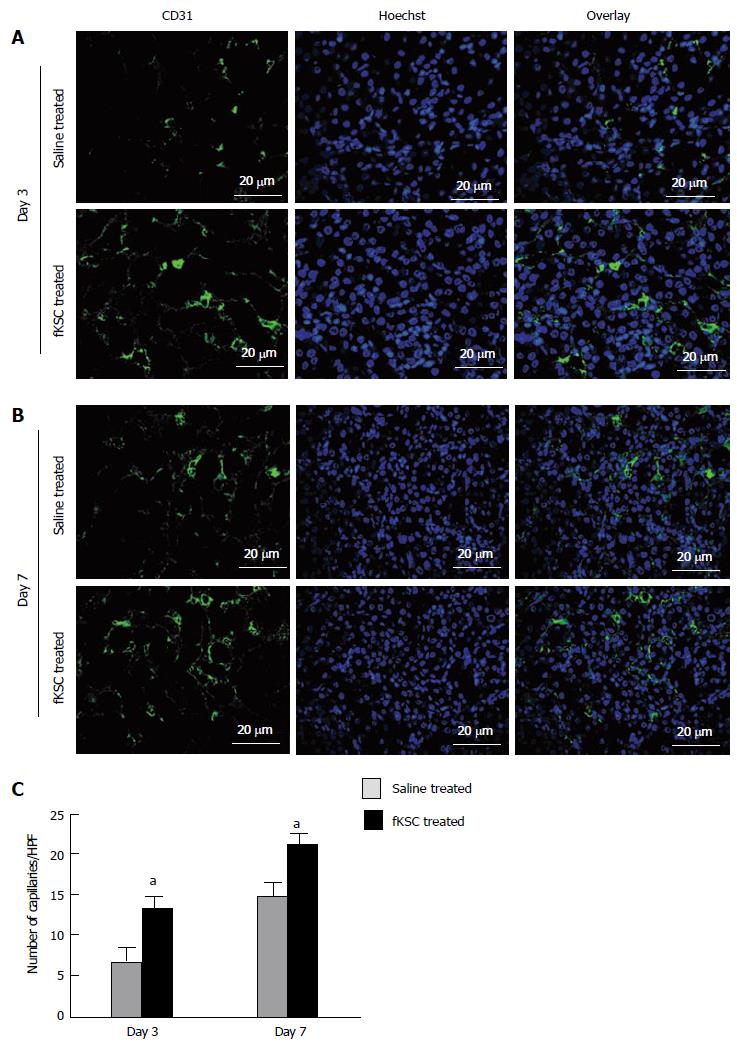
Figure 7 Fetal kidney stem cells accelerate angiogenesis in rats with cisplatin induced acute renal failure.
Representative immunoflourescent photomicrographs (Scale bars indicate 20 μm) showing perivascular capillaries stained with CD31 in saline treated and fetal kidney stem cells (fKSC) treated groups on day 3 (A) and on day 7 (B) after fKSC therapy. C: Quantification of perivascular capillaries stained with CD31, expressed as capillaries per HPF, in saline and fKSC treated groups. Values expressed Mean ± SE. aP < 0.05 for fKSC vs saline treated group. HPF: High-power field.
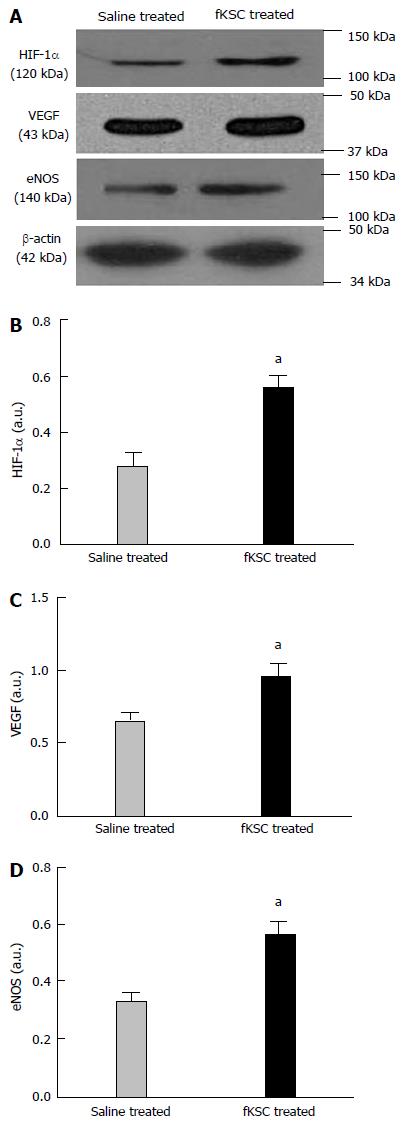
Figure 8 Early angiogenic effect of administered fetal kidney stem cells in cisplatin injured kidney.
Representative immunoblots showing the expression of hypoxia-inducible factor (HIF)-1α, vascular endothelial growth factor (VEGF) and endothelial nitric oxide synthase (eNOS) in saline and fetal kidney stem cells (fKSC) treated groups on day 3 after fKSC therapy (A-D). Bar diagrams showing densitometric quantification of the expression of HIF-1α (B), VEGF (C) and eNOS (D). Comparative gene expression ratio was calculated by referring each gene to β-actin as an internal control. Densitometric analysis applied for comparison of relative protein expression and represented in densitometric arbitrary units (a. u.). Values expressed mean ± SE. aP < 0.05 for fKSC vs saline treated group.
- Citation: Gupta AK, Jadhav SH, Tripathy NK, Nityanand S. Fetal kidney stem cells ameliorate cisplatin induced acute renal failure and promote renal angiogenesis. World J Stem Cells 2015; 7(4): 776-788
- URL: https://www.wjgnet.com/1948-0210/full/v7/i4/776.htm
- DOI: https://dx.doi.org/10.4252/wjsc.v7.i4.776


