Copyright
©The Author(s) 2015.
World J Stem Cells. May 26, 2015; 7(4): 776-788
Published online May 26, 2015. doi: 10.4252/wjsc.v7.i4.776
Published online May 26, 2015. doi: 10.4252/wjsc.v7.i4.776
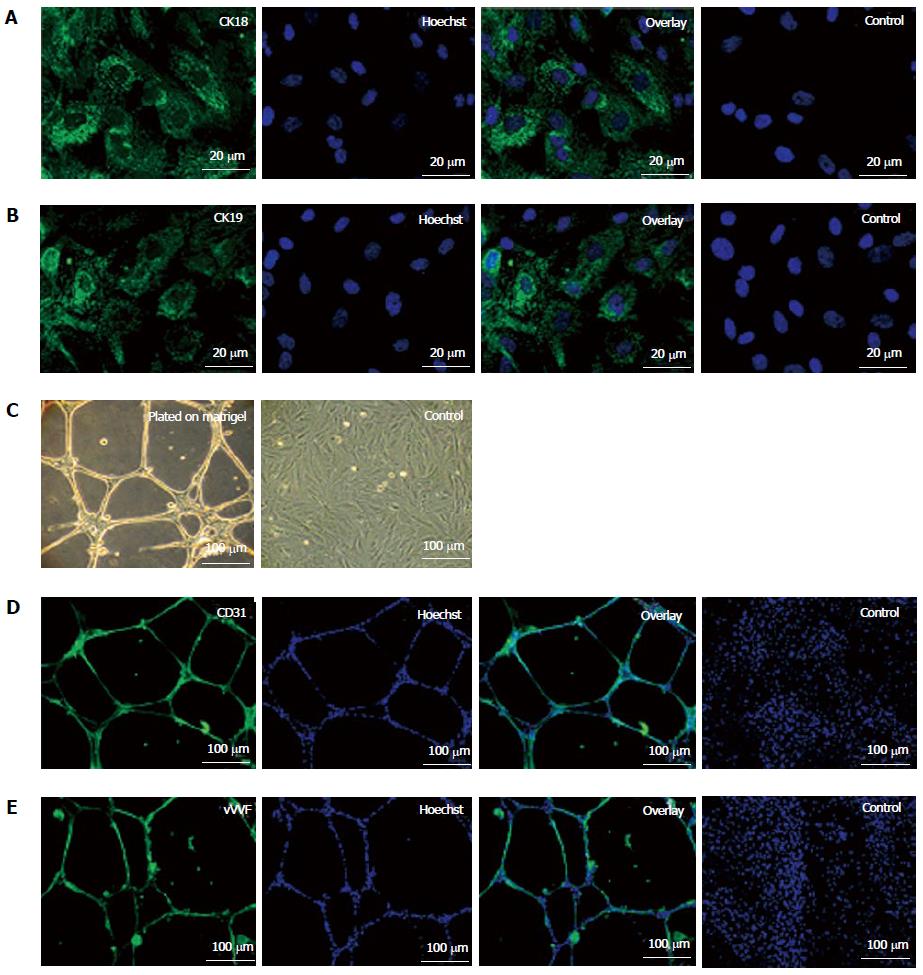
Figure 2 Epithelial differentiation (A, B) and angiogenic potential (C-E) of fetal kidney stem cells.
A: Representative photomicrograph (Scale bars indicate 20 μm) showing CK18 expression, Hoechst, overlay and untreated control cells with only Hoechst; B: Representative photomicrograph (Scale bars indicate 20 μm) showing CK19 expression, Hoechst, overlay and untreated control cells with only Hoechst; C: Representative photomicrographs (Scale bars indicate 100 μm) showing tubule like structure formation by fetal kidney stem cells (fKSC) cultured on matrigel and without matrigel as control; D: Representative immunoflourescent photomicrographs (Scale bars indicate 100 μm) showing CD31 expression, Hoechst, overlay and fKSC cultured without matrigel as controls with only Hoechst; E: Representative immunoflourescent photomicrographs (Scale bars indicate 100 μm) of fKSC cultured on matrigel showing Von Willebrand factor expression, Hoechst, overlay and fKSC cultured without matrigel as controls with only Hoechst.
- Citation: Gupta AK, Jadhav SH, Tripathy NK, Nityanand S. Fetal kidney stem cells ameliorate cisplatin induced acute renal failure and promote renal angiogenesis. World J Stem Cells 2015; 7(4): 776-788
- URL: https://www.wjgnet.com/1948-0210/full/v7/i4/776.htm
- DOI: https://dx.doi.org/10.4252/wjsc.v7.i4.776


