Copyright
©The Author(s) 2015.
World J Stem Cells. Nov 26, 2015; 7(10): 1215-1221
Published online Nov 26, 2015. doi: 10.4252/wjsc.v7.i10.1215
Published online Nov 26, 2015. doi: 10.4252/wjsc.v7.i10.1215
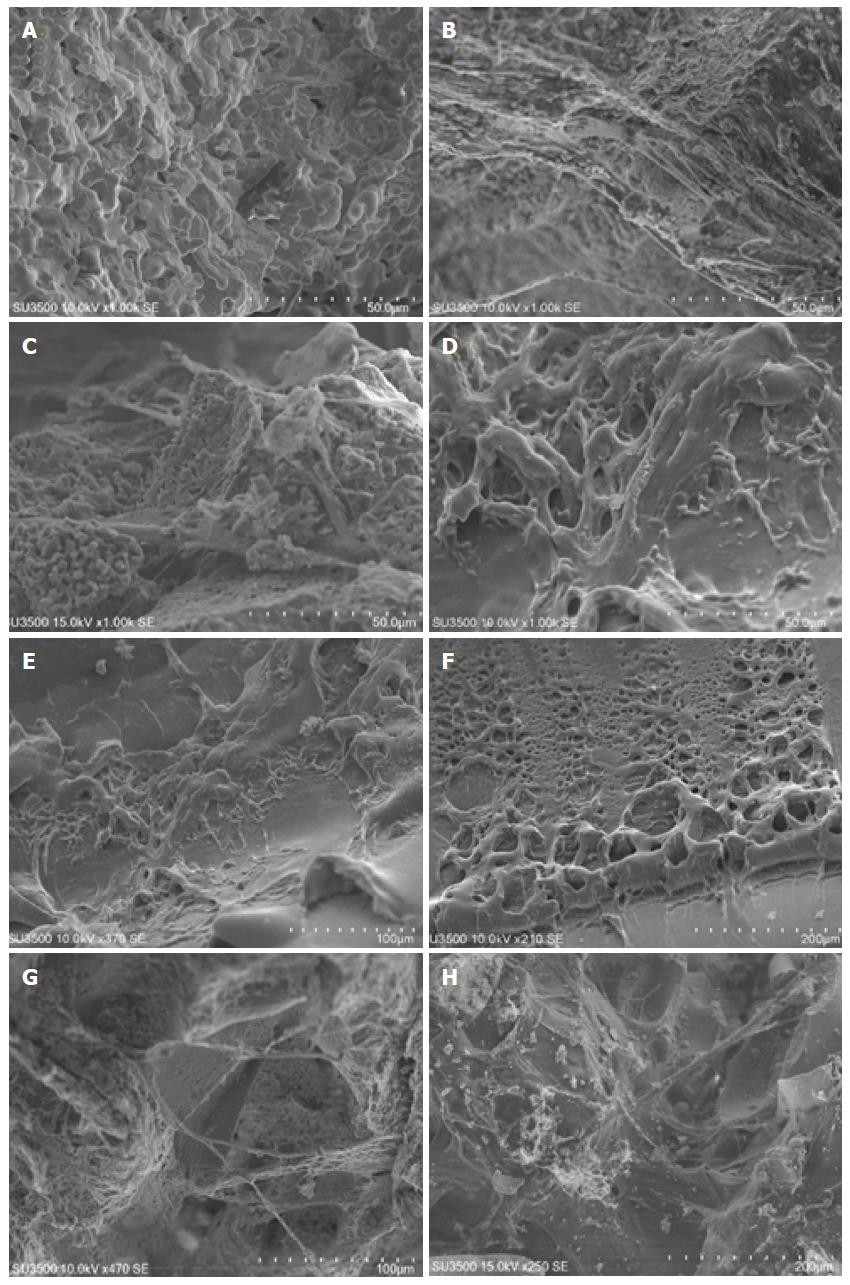
Figure 1 Scanning electron microscopy microphotographs of human dental pulp stem cells attachment and morphology on four different scaffolds.
A: SureOss (Allograft); B: Cerabone (Xenograft); C: OSTEON II Collagen (Composite); D: PLLA (Synthetic); E and F: PLLA at lower magnification; G and H: Cerabone at lower magnification. Note that cells were covered almost the entire scaffold surface of PLLA (D-F). Also note that attached cells on PLLA surface showed fibroblastic morphology (D-F), whereas cells on Cerabone and OSTEON II Collagen demonstrated osteoblasic phenotype (B, C, G, H).
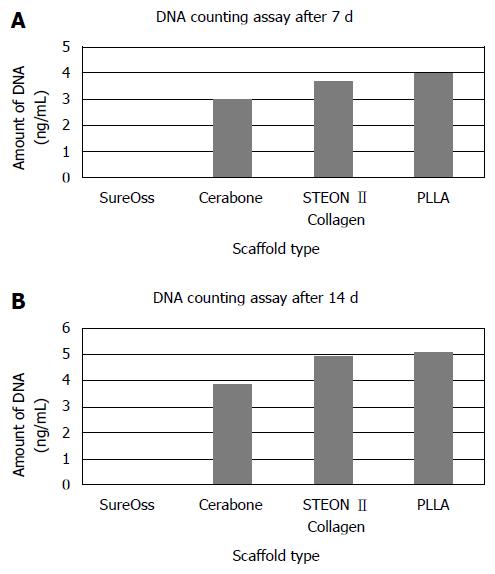
Figure 2 The quantitative analysis of human dental pulp stem cells proliferation by DNA counting assay after 7 (A) and 14 (B) d.
Note that the highest amount of DNA was observed on PLLA group at both time points.
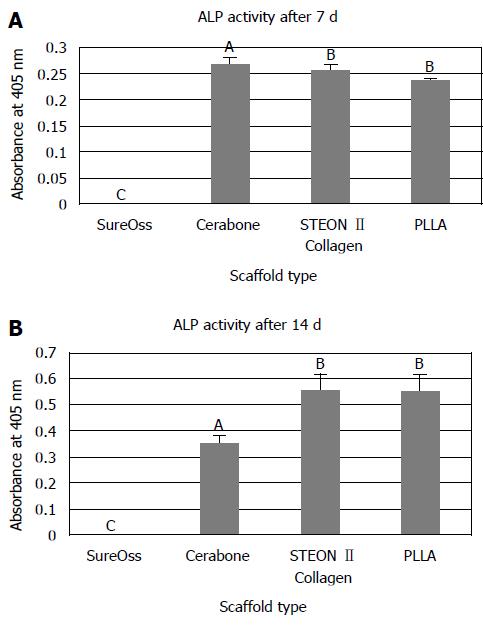
Figure 3 The assessment of osteogenic differentiation of human dental pulp stem cells by alkaline phosphatase activity assay after 7 (A) and 14 (B) d.
ALP activity was highest on PLLA and OSTEON II Collagen groups at day 14. Note that no significant difference was observed between PLLA and OSTEON II Collagen. Also, note that different letters are indicated significant difference at P≤ 0.05. ALP: Alkaline phosphatase.
-
Citation: Khojasteh A, Motamedian SR, Rad MR, Shahriari MH, Nadjmi N. Polymeric
vs hydroxyapatite-based scaffolds on dental pulp stem cell proliferation and differentiation. World J Stem Cells 2015; 7(10): 1215-1221 - URL: https://www.wjgnet.com/1948-0210/full/v7/i10/1215.htm
- DOI: https://dx.doi.org/10.4252/wjsc.v7.i10.1215


