Copyright
©The Author(s) 2021.
World J Stem Cells. Feb 26, 2021; 13(2): 177-192
Published online Feb 26, 2021. doi: 10.4252/wjSC.v13.i2.177
Published online Feb 26, 2021. doi: 10.4252/wjSC.v13.i2.177
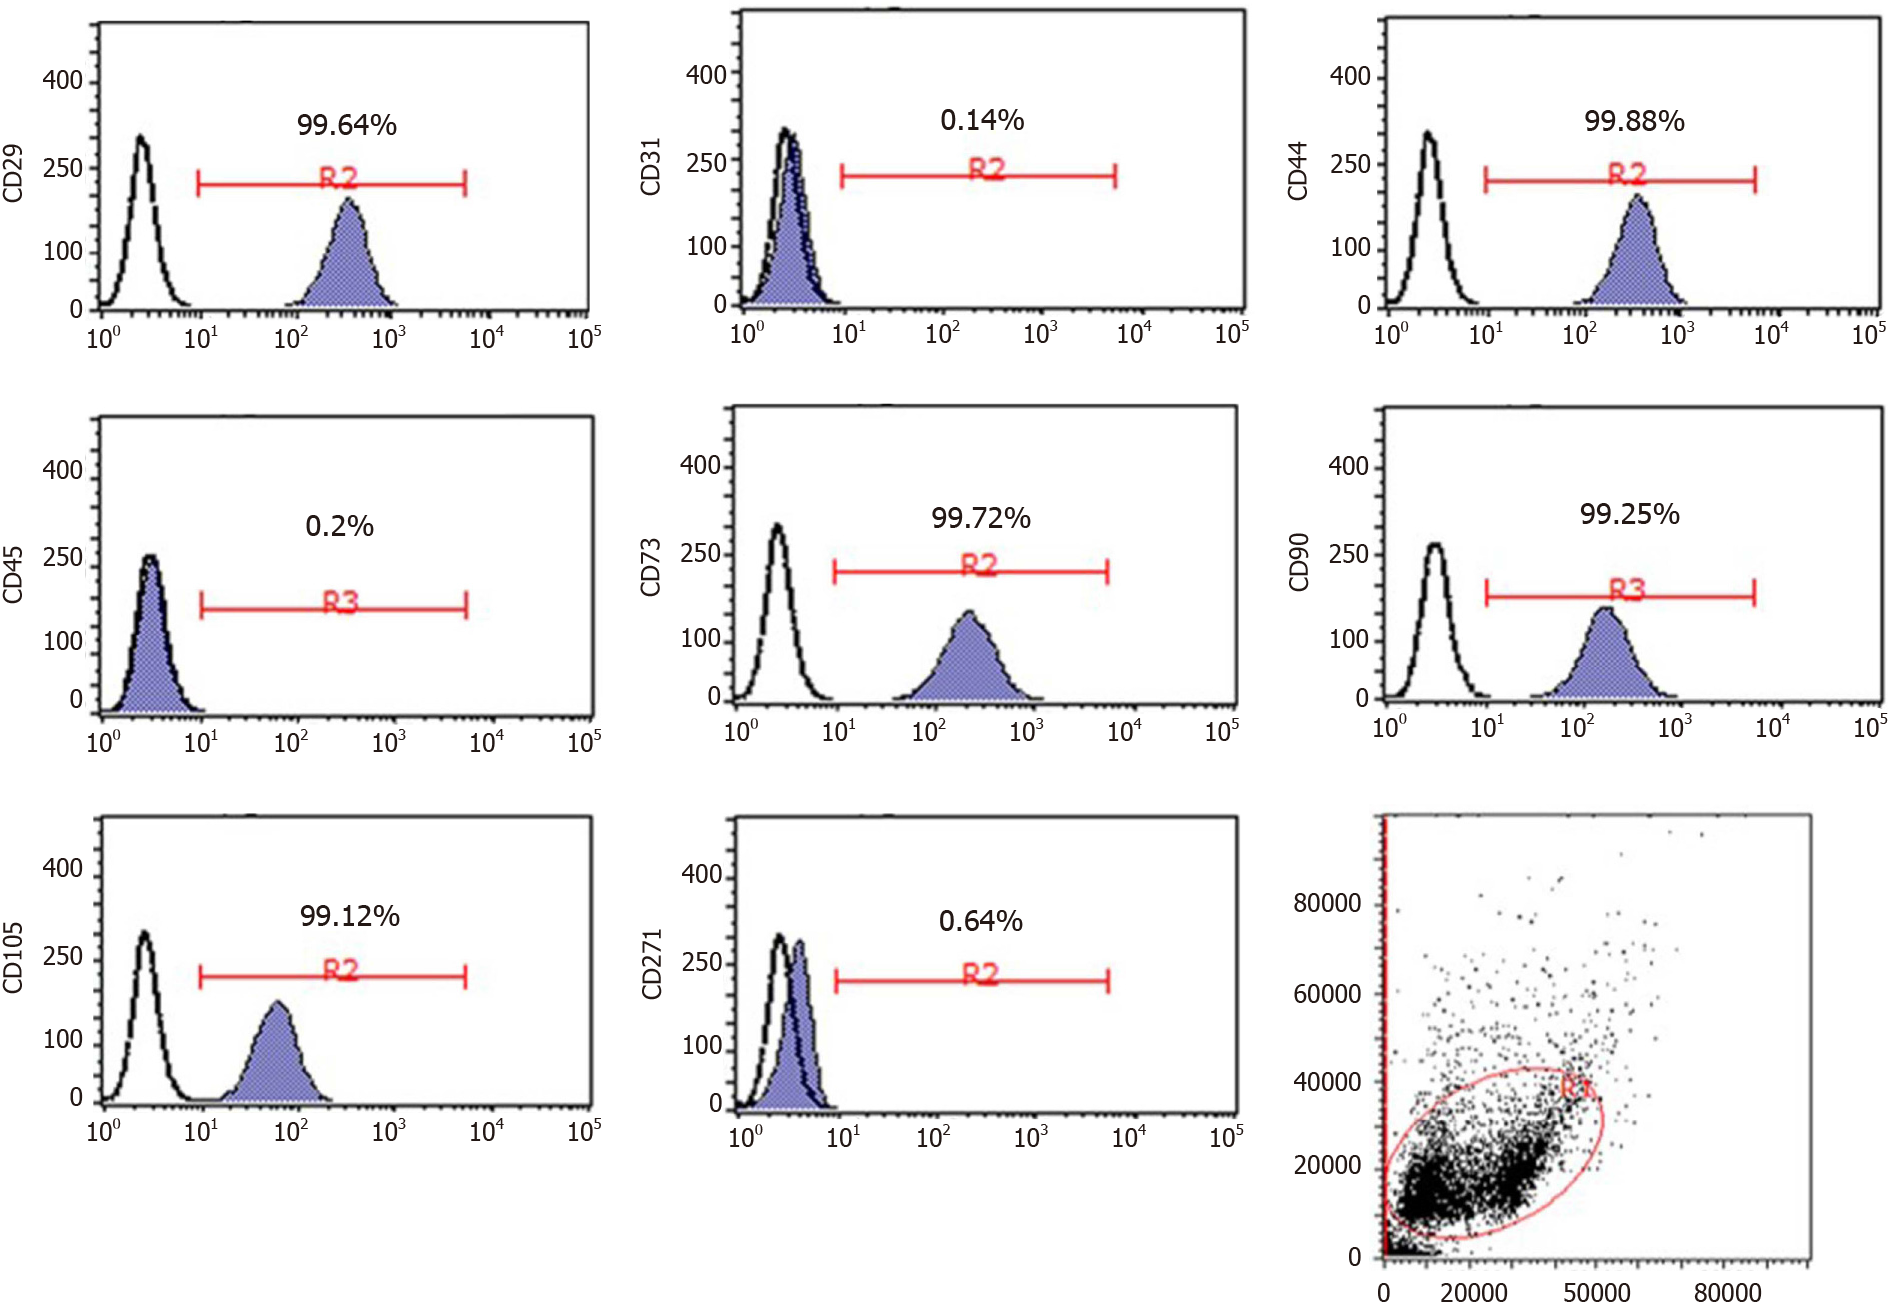
Figure 1 Immunophenotypes of umbilical cord-derived mesenchymal stem cells determined by flow cytometry.
Images illustrate the expression of positive stem markers CD29, CD44, CD73, CD90, and CD105 and negative stem markers CD31, CD45, and CD271.
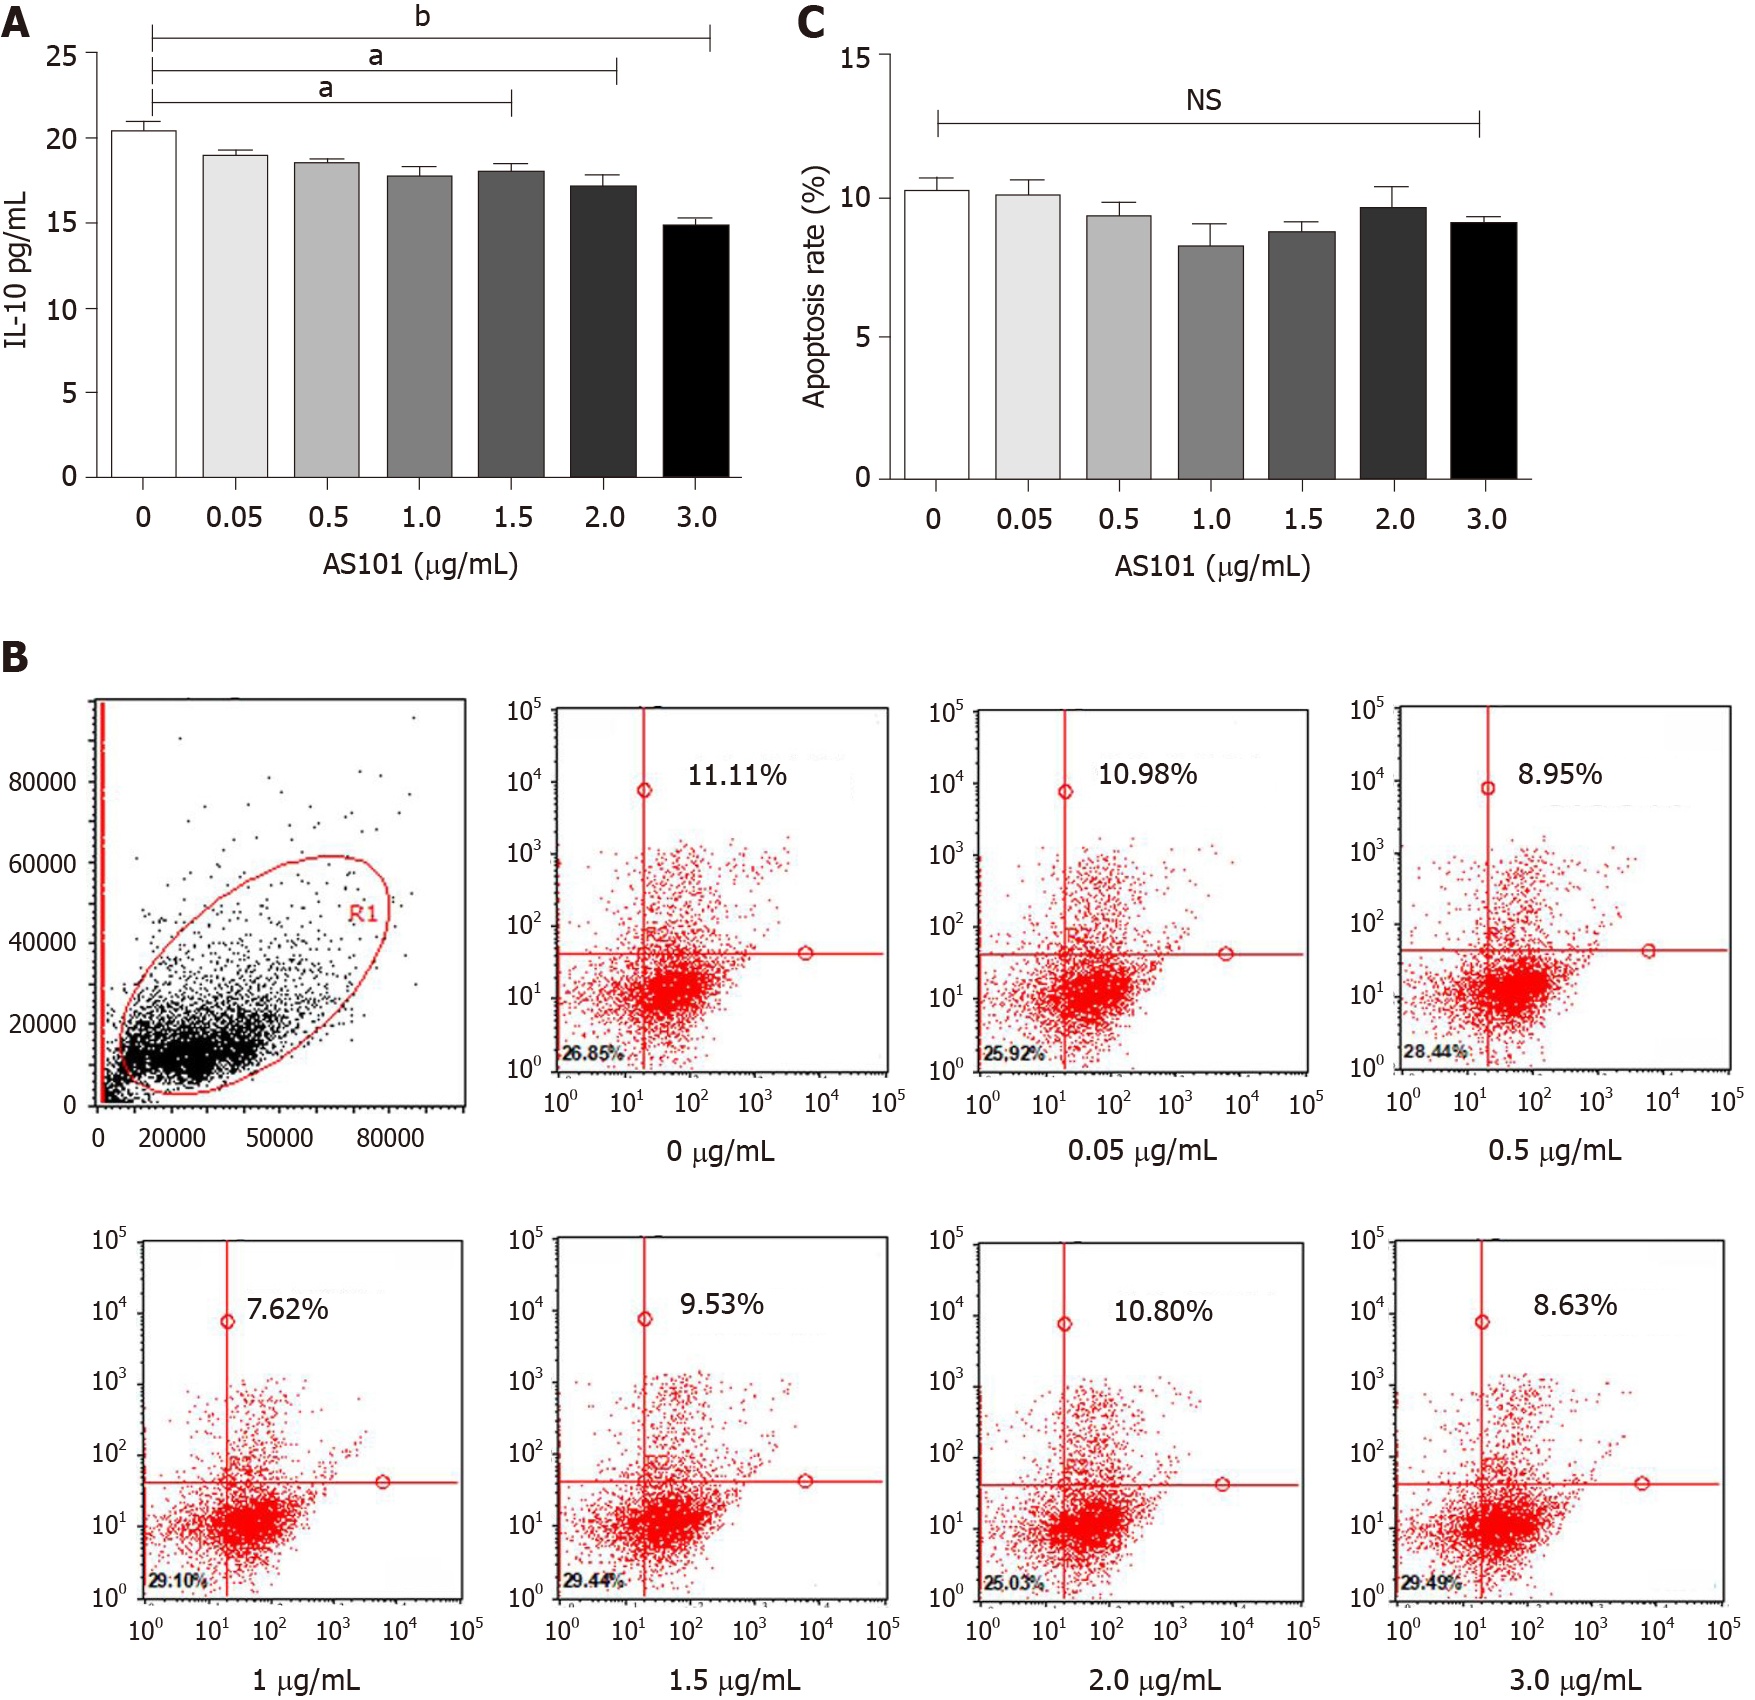
Figure 2 AS101 inhibits spontaneous interleukin-10 secretion by umbilical cord-derived mesenchymal stem cells.
A: Secreted interleukin-10 (IL-10) levels in the supernatant under exposure to different AS101 concentrations, as measured by enzyme-linked immunosorbent assay. The IL-10 level decreased with 1.5-3.0 μg/mL of AS101; B and C: Flow cytometry analysis of the viability of umbilical cord-derived mesenchymal stem cells (UC-MSCs) after co-culture with AS101. There was no significant difference in the proportion of UC-MSCs according to AS101 concentration. IL-10: Interleukin-10.
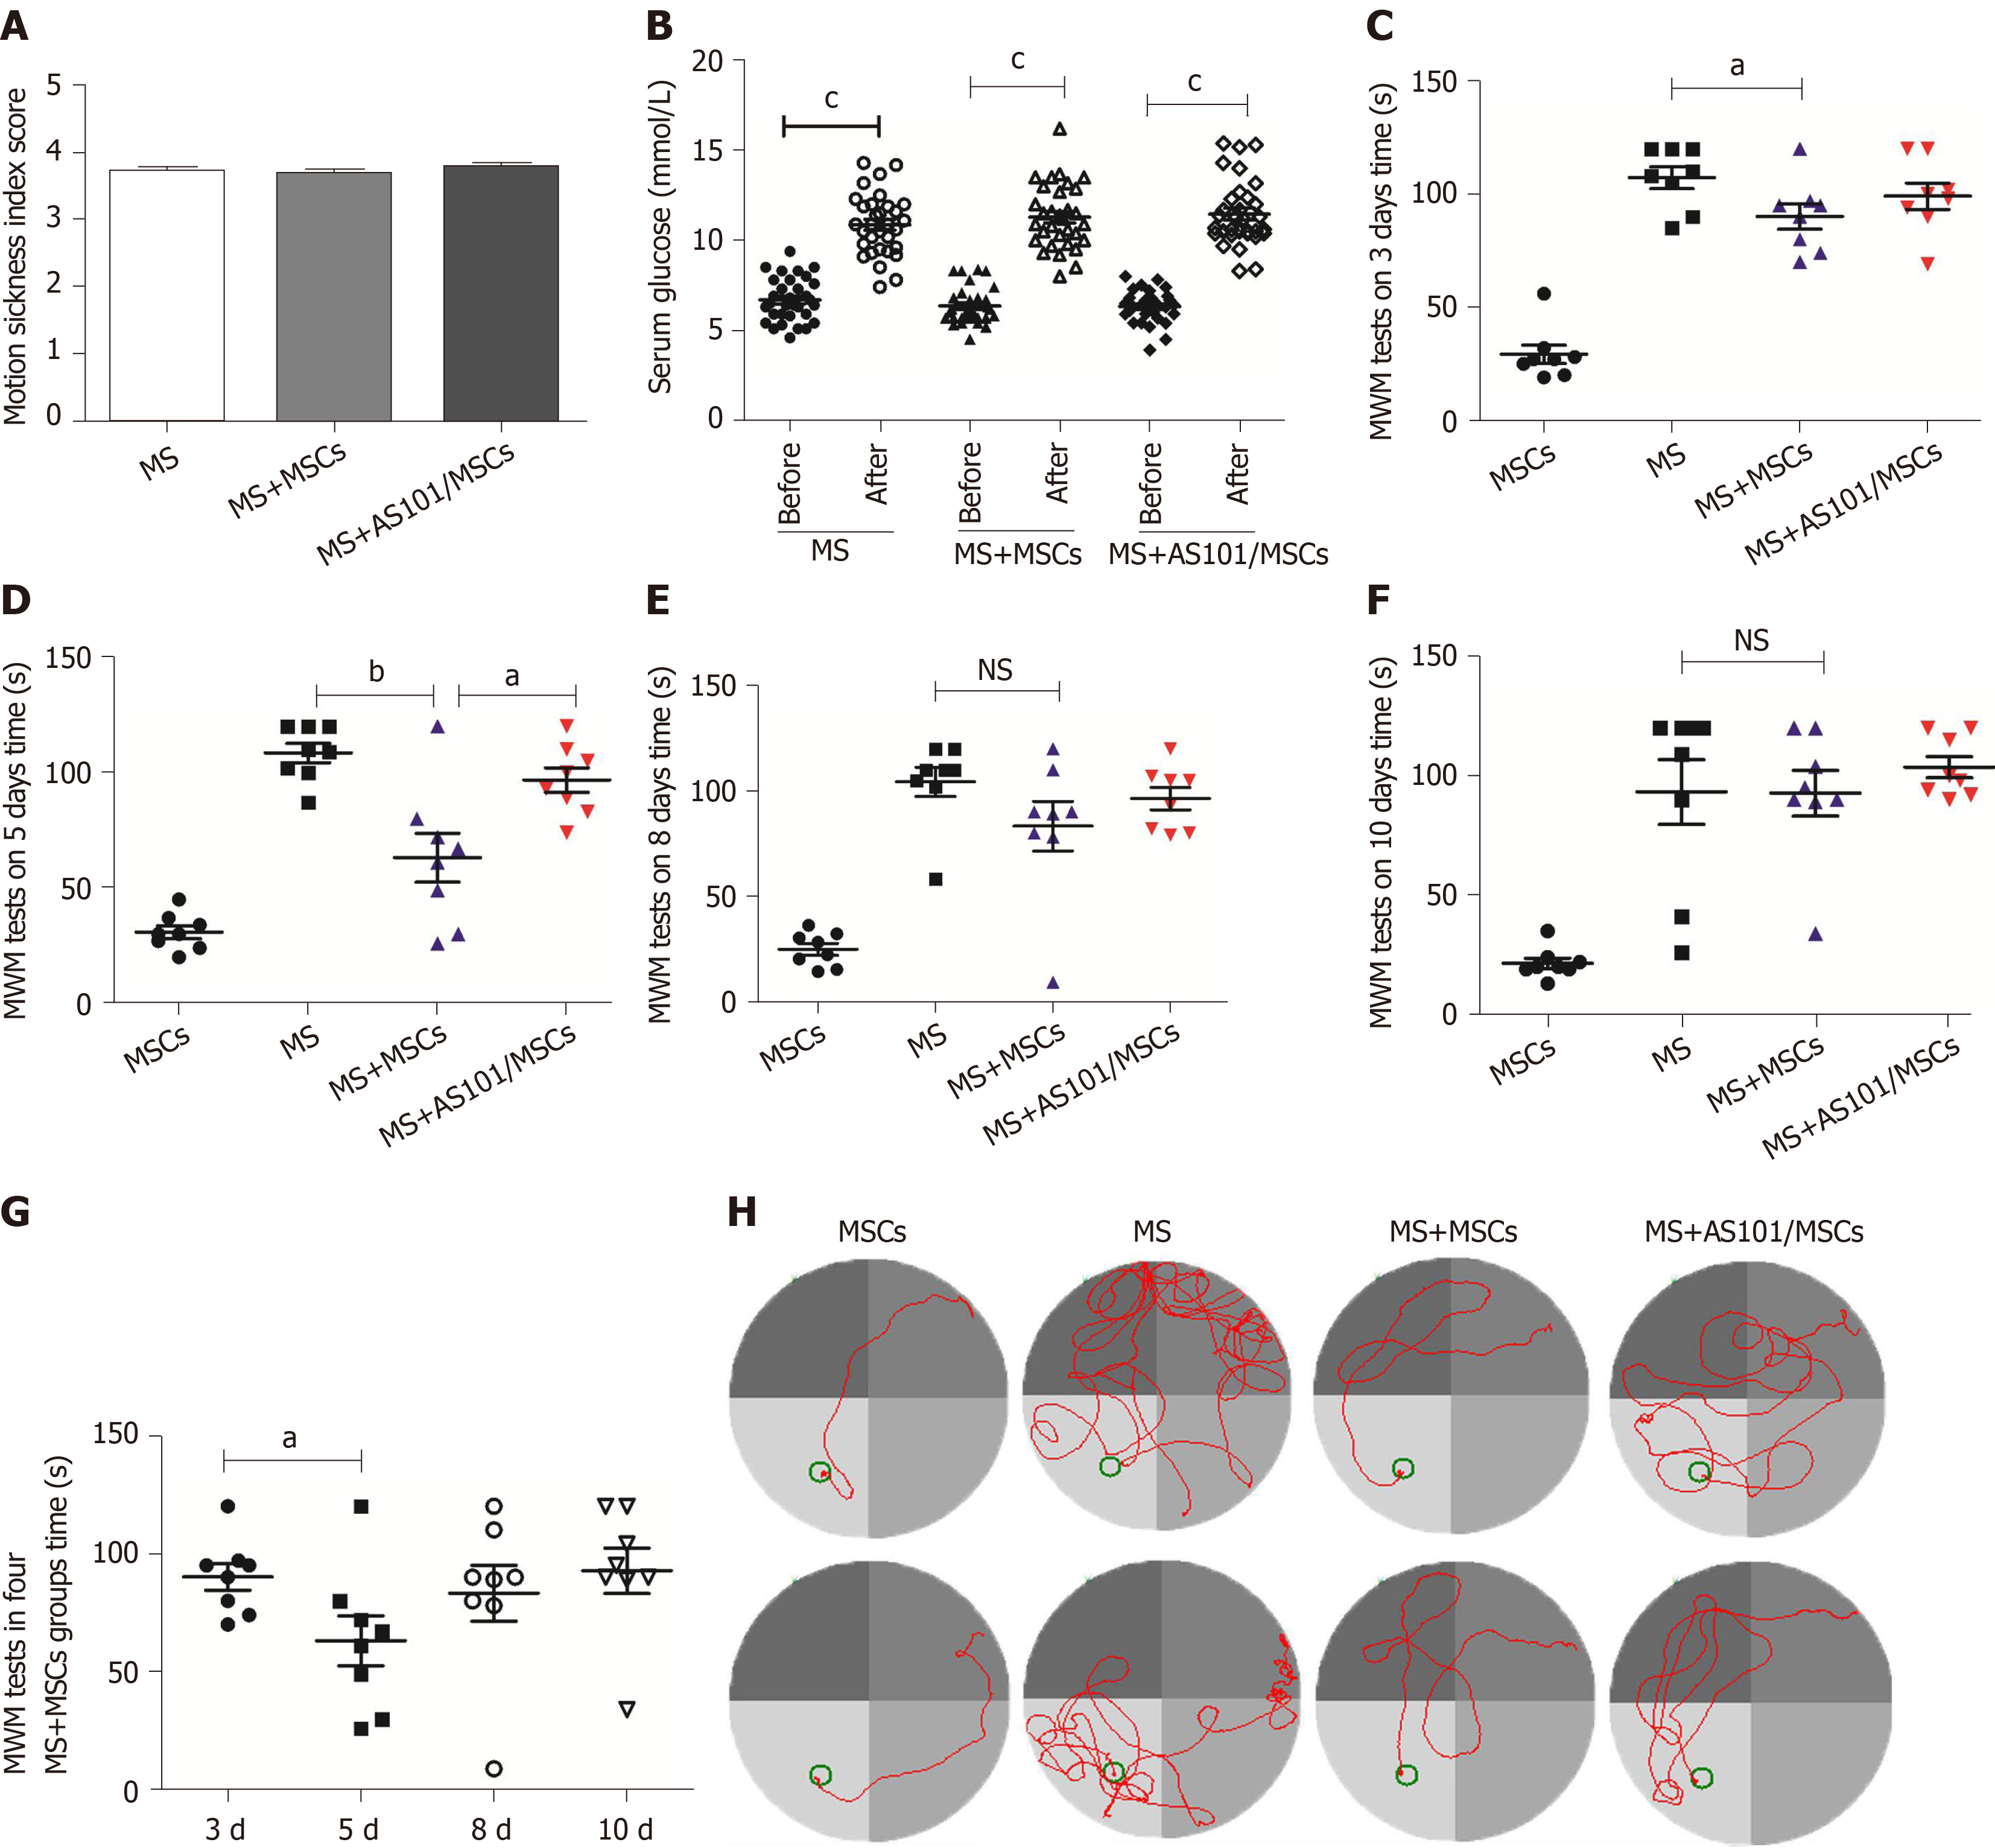
Figure 3 Motion sickness model evaluation and effects of umbilical cord-derived mesenchymal stem cells treatment on performance of mice in Morris water maze tests.
A: Motion sickness (MS) index score reflecting the degree of MS symptoms in mice; B: Serum glucose levels in the three groups before and after exposure to rotation (cP < 0.001); C-F: Time taken for the mice to reach the platform after different treatments. The time of the MS + mesenchymal stem cells (MS + MSCs) group was faster than that of the MS group at 3 d and 5 d (aP < 0.05; bP < 0.01); G: The 5-day group had the shortest time among the four MS + MSCs subgroups (aP < 0.05); H: Swimming trajectories in the MSCs, MS, MS + MSCs, and MS + AS101/MSCs groups on day 5; the platform is shown as a small circle. In addition to the MSCs group, the path of mice in the MS + MSCs group was clearer. MWM: Morris water maze; MS: Motion sickness; MSCs: Mesenchymal stem cells.
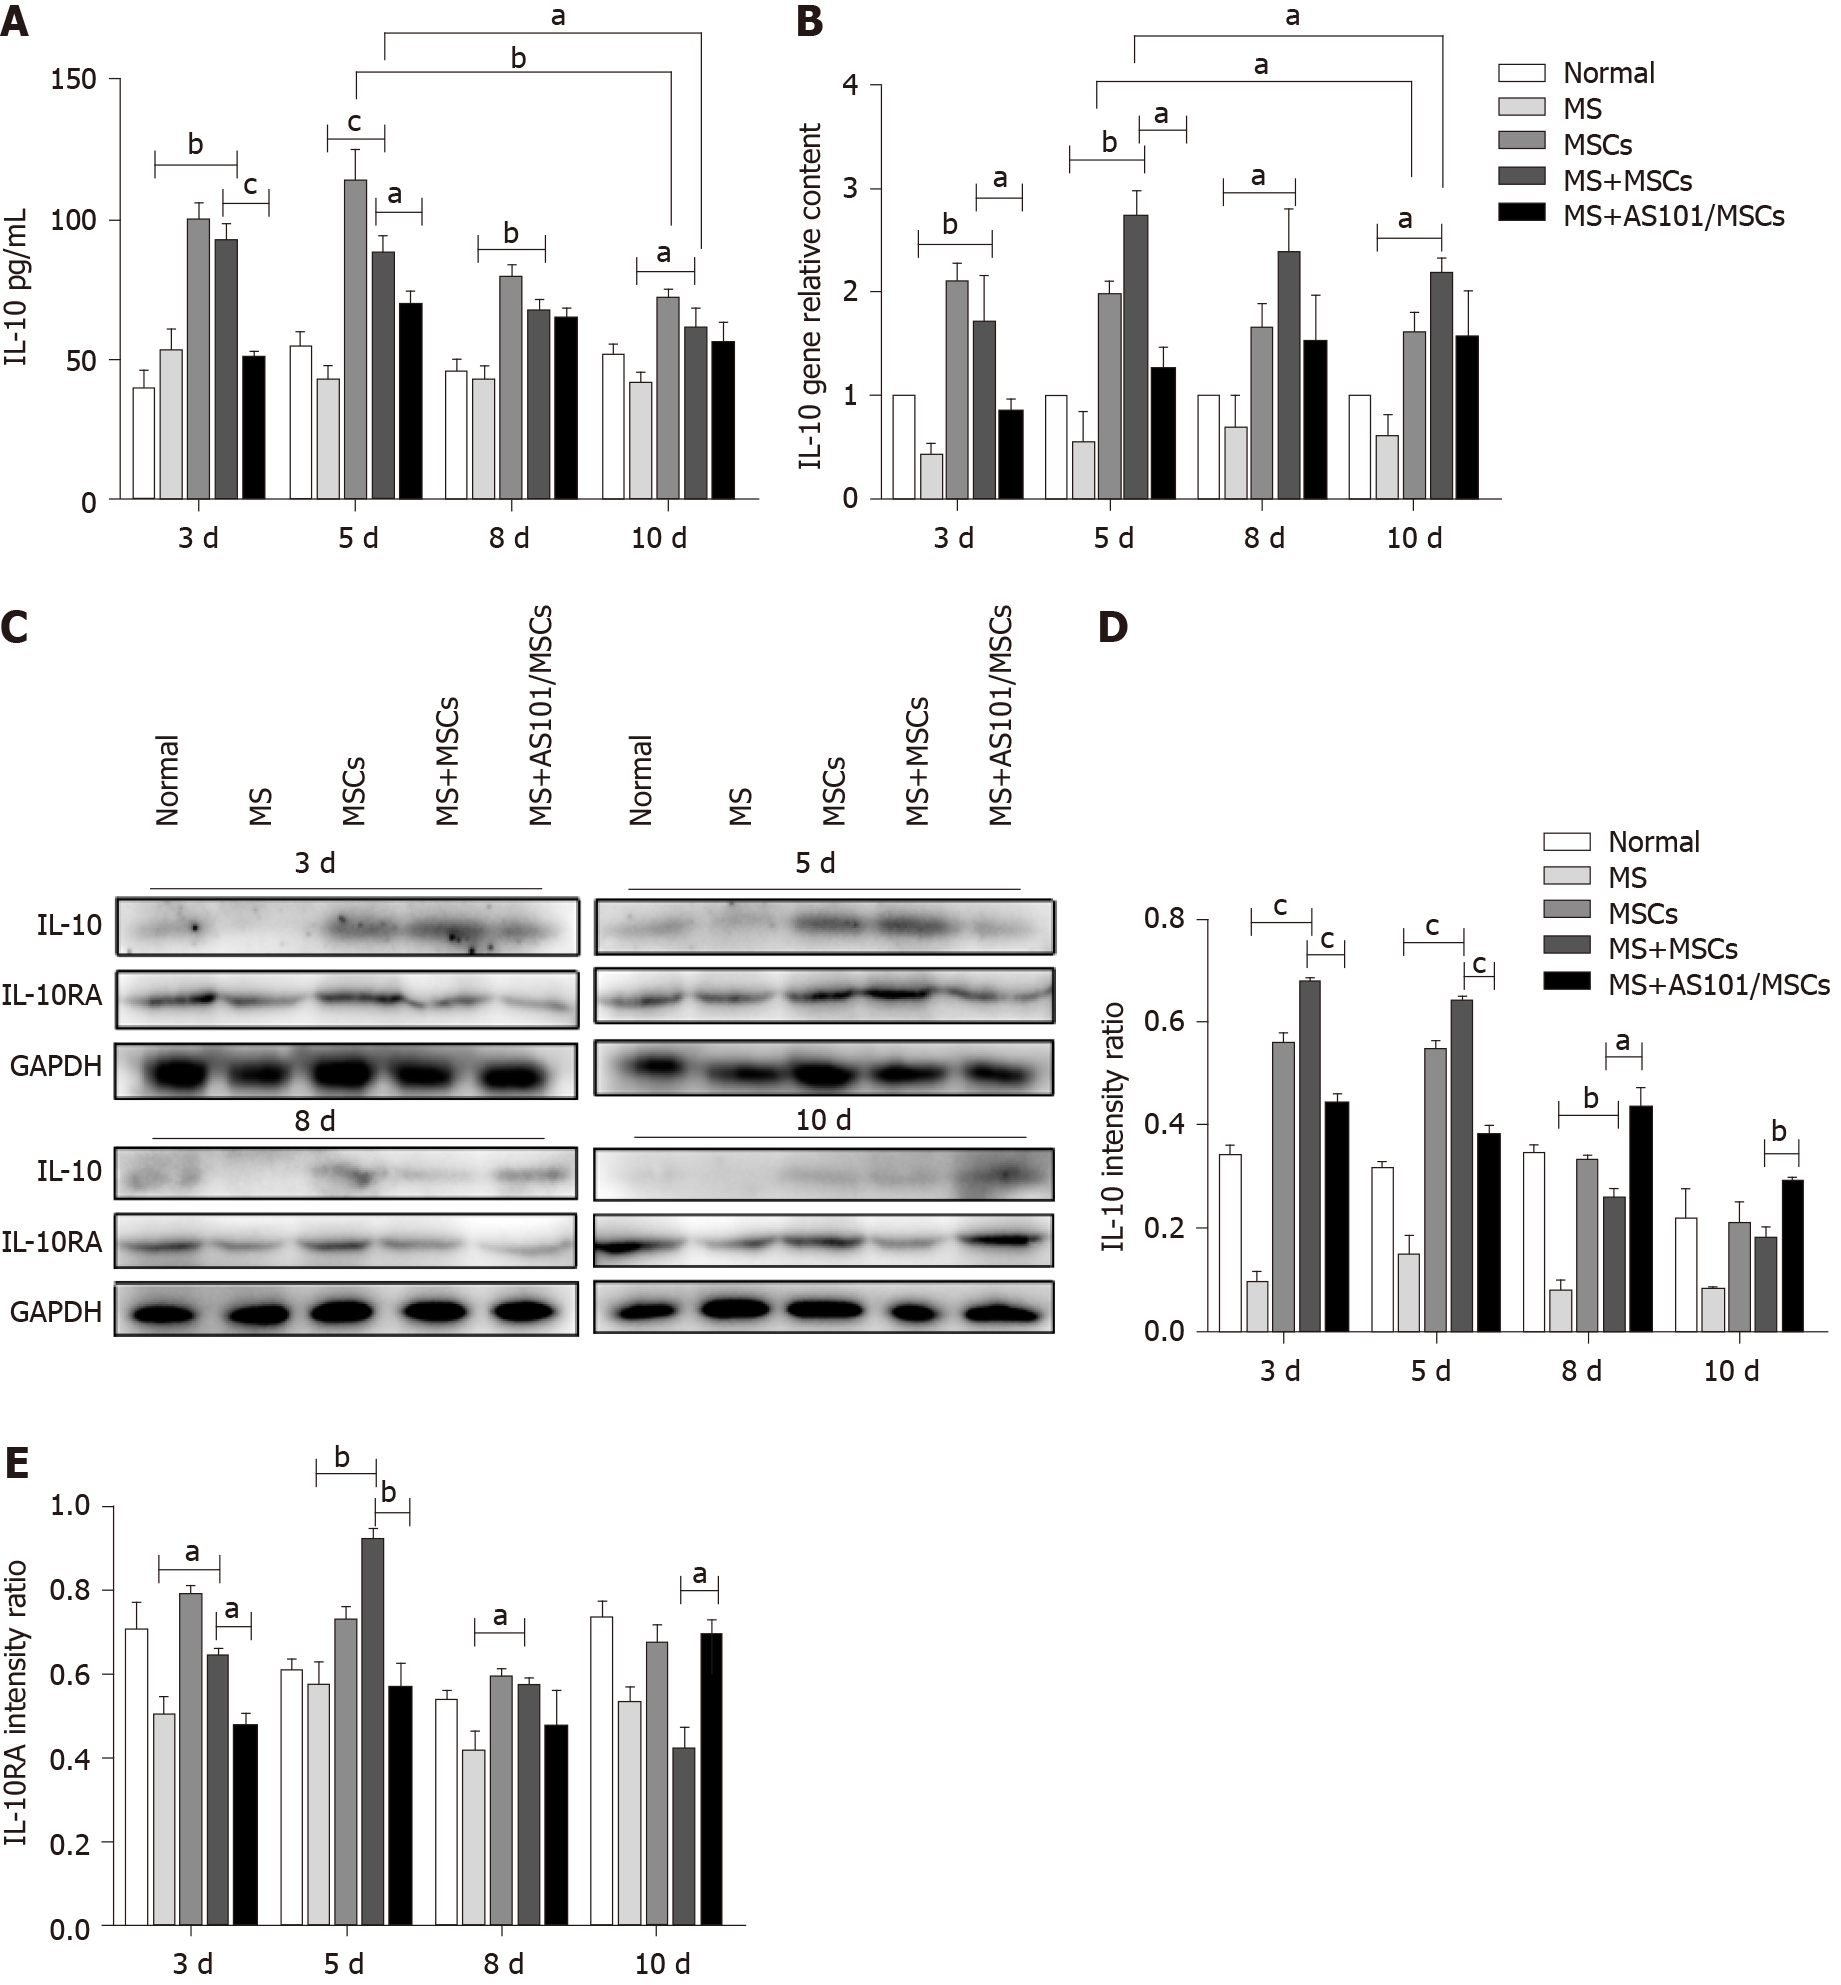
Figure 4 The levels of interleukin-10 and interleukin-10RA in the five groups.
A: Statistical analyses of interleukin-10 (IL-10) levels in the peripheral blood in the five groups (aP < 0.05; bP < 0.01; cP < 0.001; n = 8); B: Statistical analyses of IL-10 mRNA levels in the petrous part of temporal bone tissues of mice at four time points, normalized to mouse Gapdh (aP < 0.05; bP < 0.01; n = 3); C-E: Western blot analysis showing upregulated IL-10 and IL-10RA expression in the petrous part of the temporal bone in mice of the motion sickness + mesenchymal stem cells (MS + MSCs) group compared to the MS group, and downregulated expression in the MS + AS101/MSCs group on days 3 and 5 (aP < 0.05; bP < 0.01; cP < 0.001; n = 3). These experiments were performed three times with similar results. IL: Interleukin; MS: Motion sickness; MSCs: Mesenchymal stem cells; GAPDH: Glyceraldehyde-3-phosphate dehydrogenase.
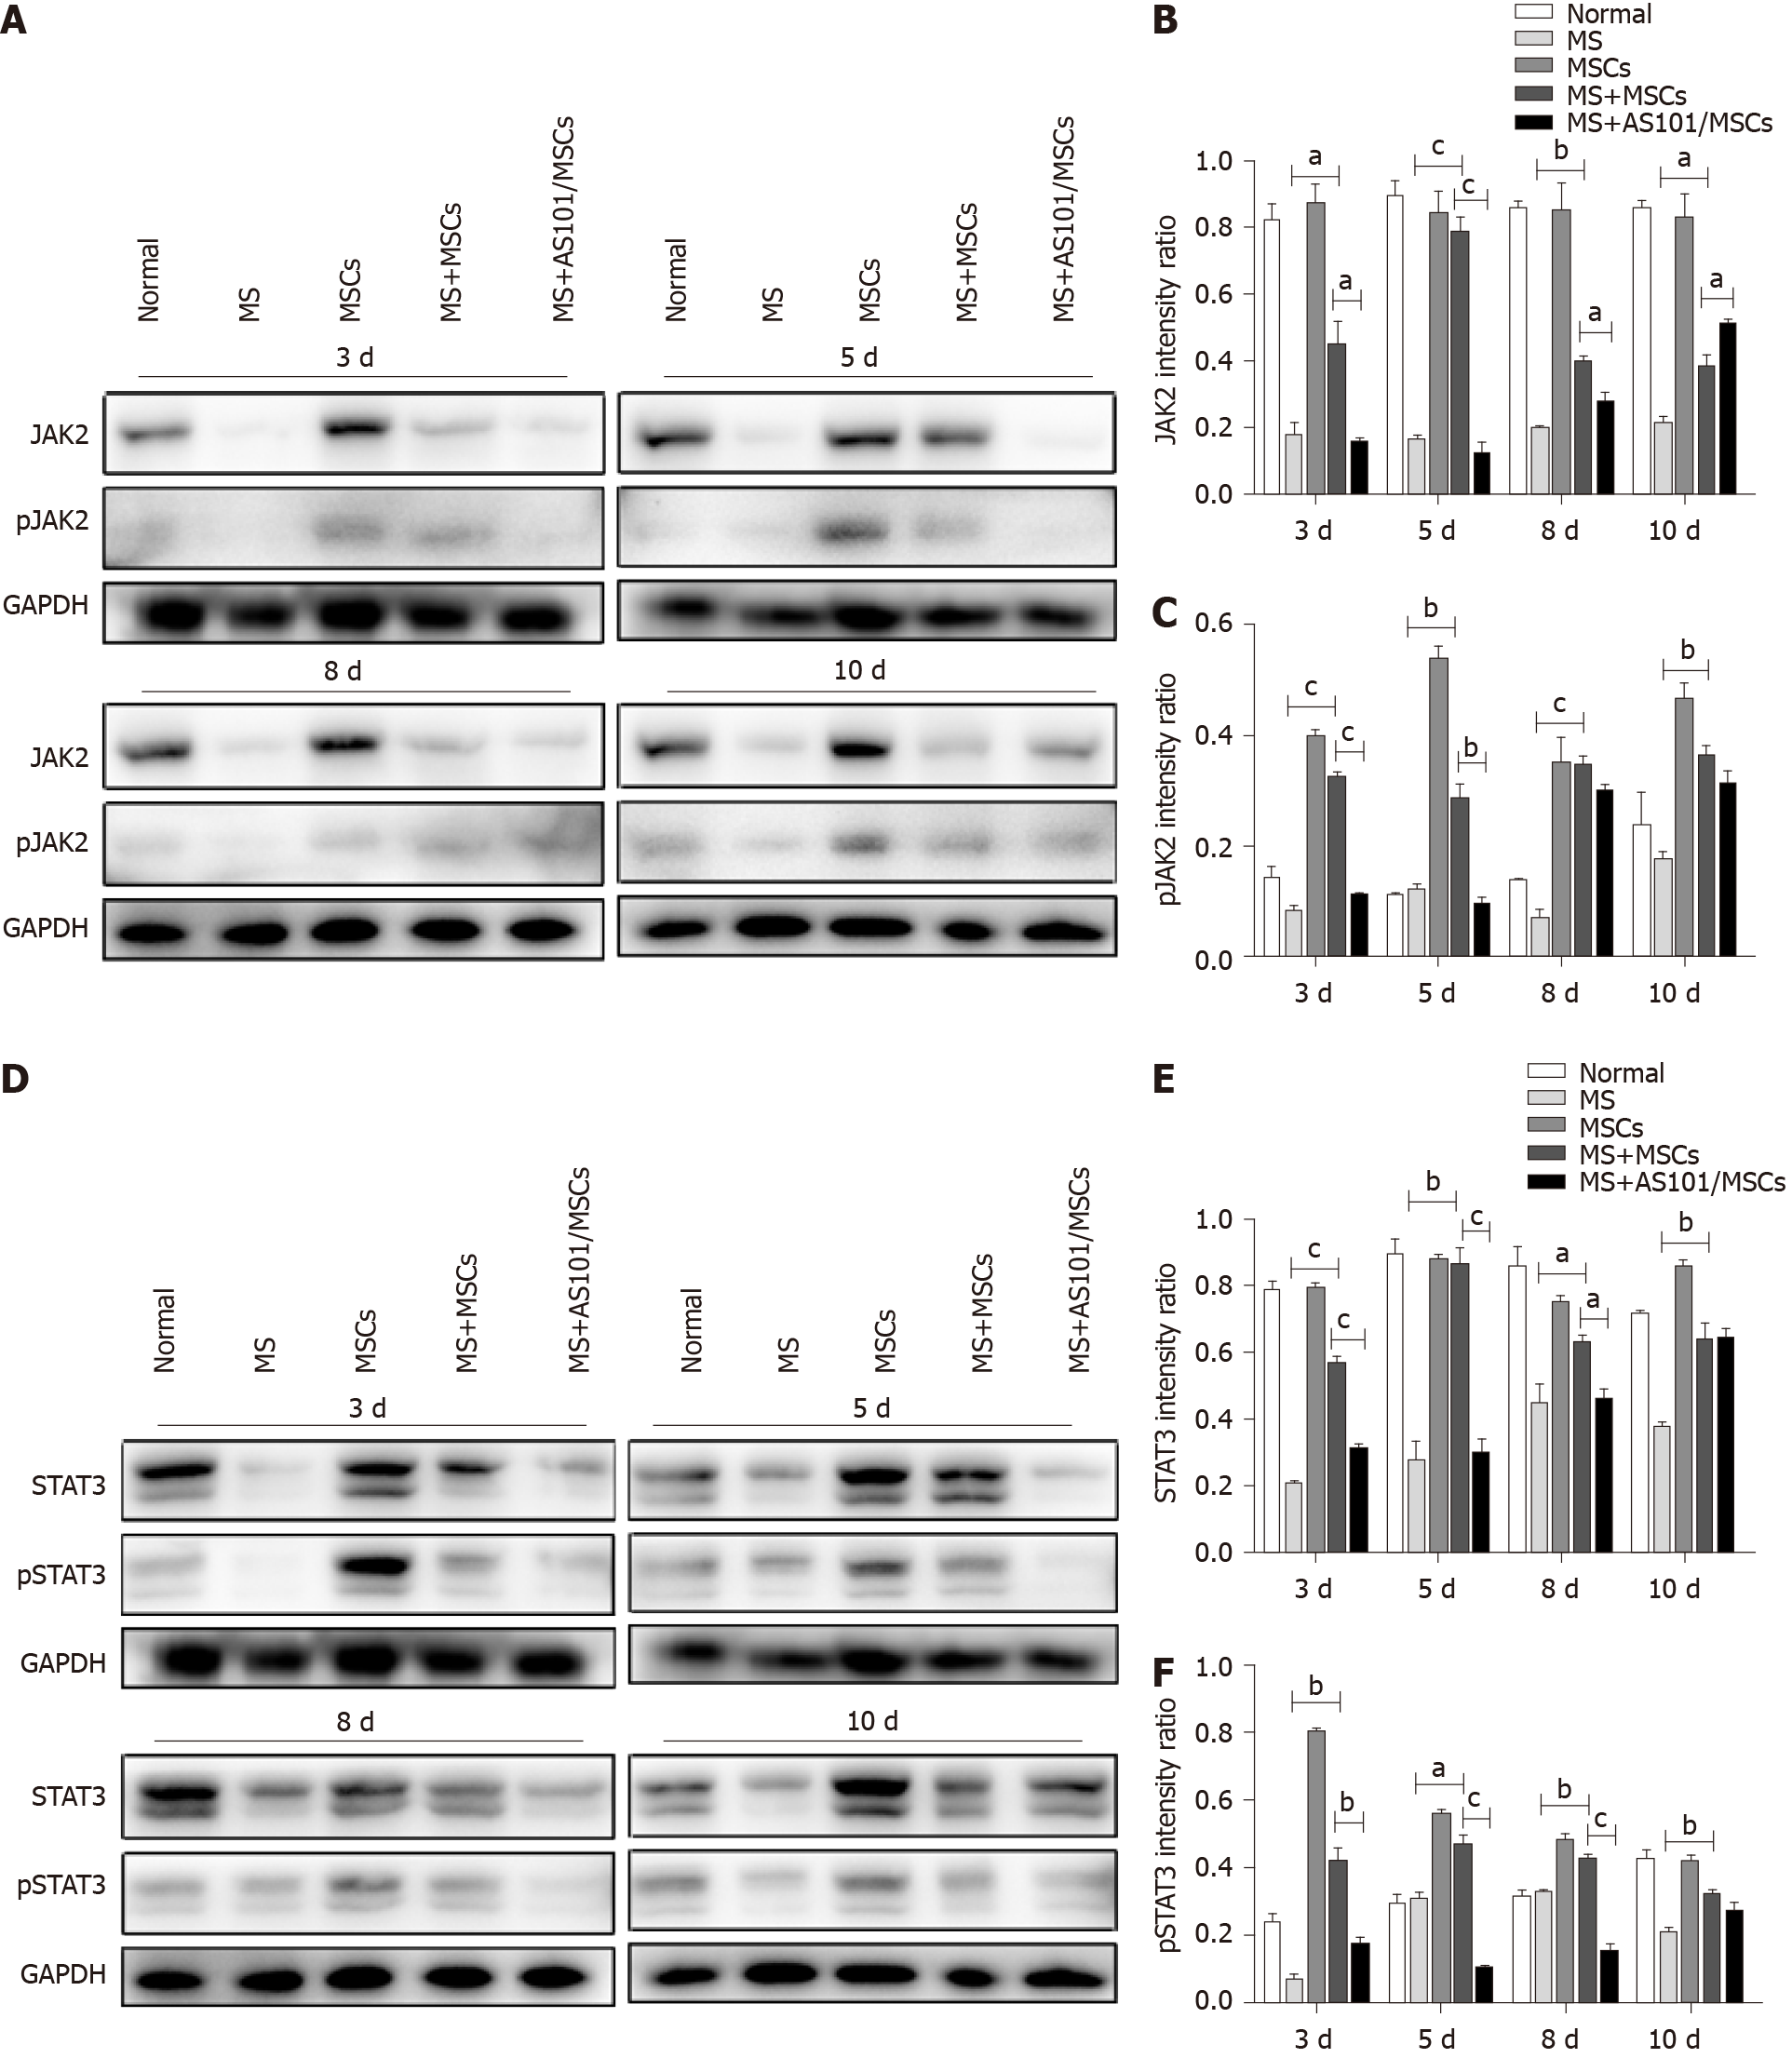
Figure 5 Western blot analysis of JAK2/ pJAK2 and STAT3/pSTAT3 expression.
JAK2/STAT3 and pJAK2/pSTAT3 protein expression in the petrous part of the temporal bone was significantly upregulated in the motion sickness + mesenchymal stem cells (MS + MSCs) group compared to the MS group, and was downregulated in the MS + AS101/MSCs group on days 3 and 5 (aP < 0.05; bP < 0.01; cP < 0.001; n = 3). A-C: JAK2/STAT3; D-F: pJAK2/pSTAT3. These experiments were performed three times with similar results. MS: Motion sickness; MSCs: Mesenchymal stem cells; GAPDH: Glyceraldehyde-3-phosphate dehydrogenase.
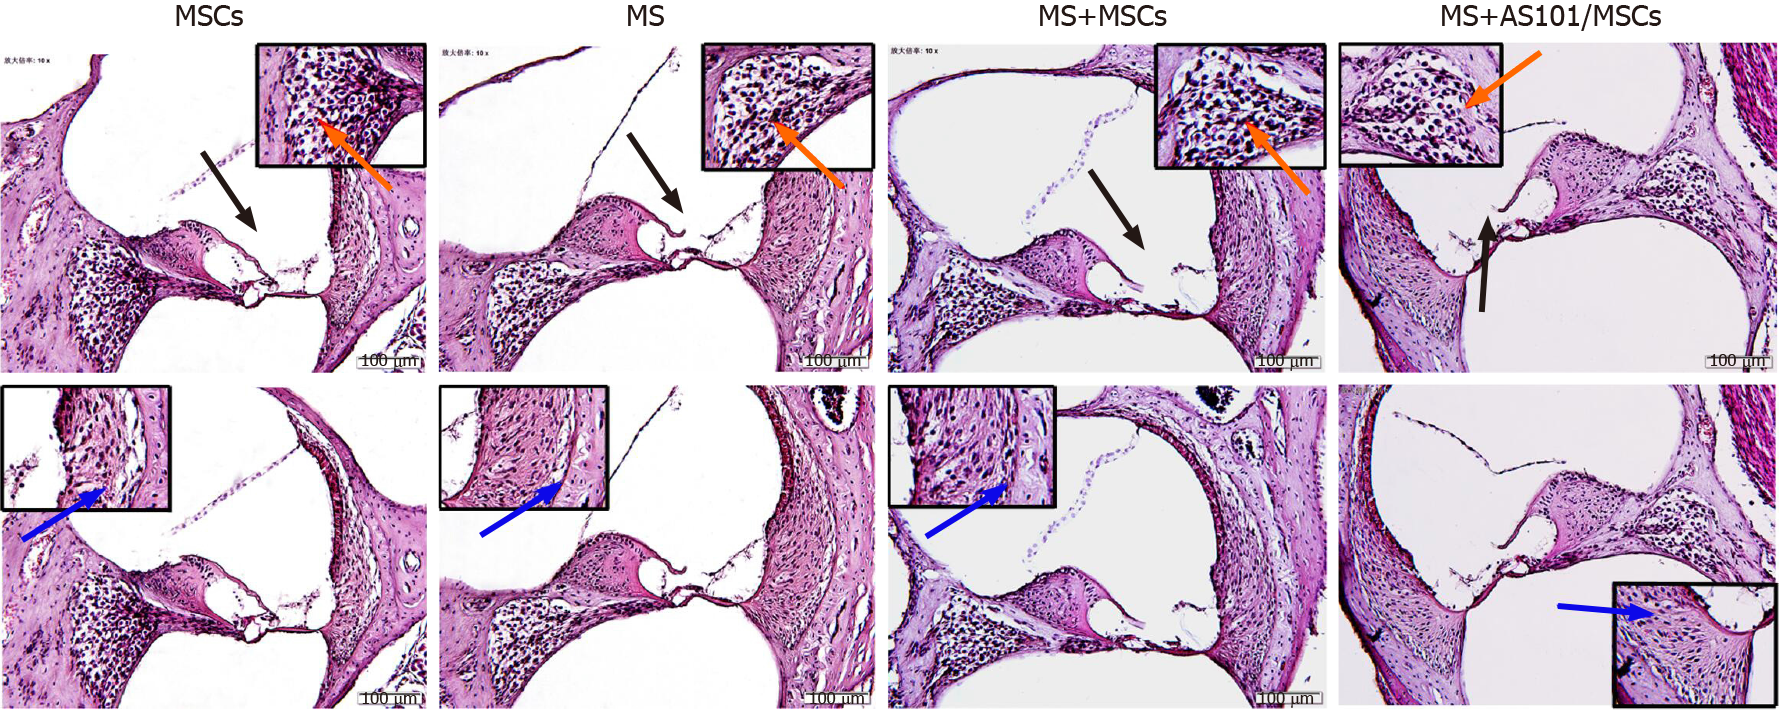
Figure 6 Representative histology images (hematoxylin and eosin staining) of the cochleae in the four groups.
Black arrows indicate the organ of Corti, blue arrows indicate vascular striate cells, and orange arrows indicate spiral ganglion cells. The dotted boxes are featured in the magnified inserts. Images of the four groups are shown in high-power fields (bar, 100 μm). MS: Motion sickness; MSCs: Mesenchymal stem cells.
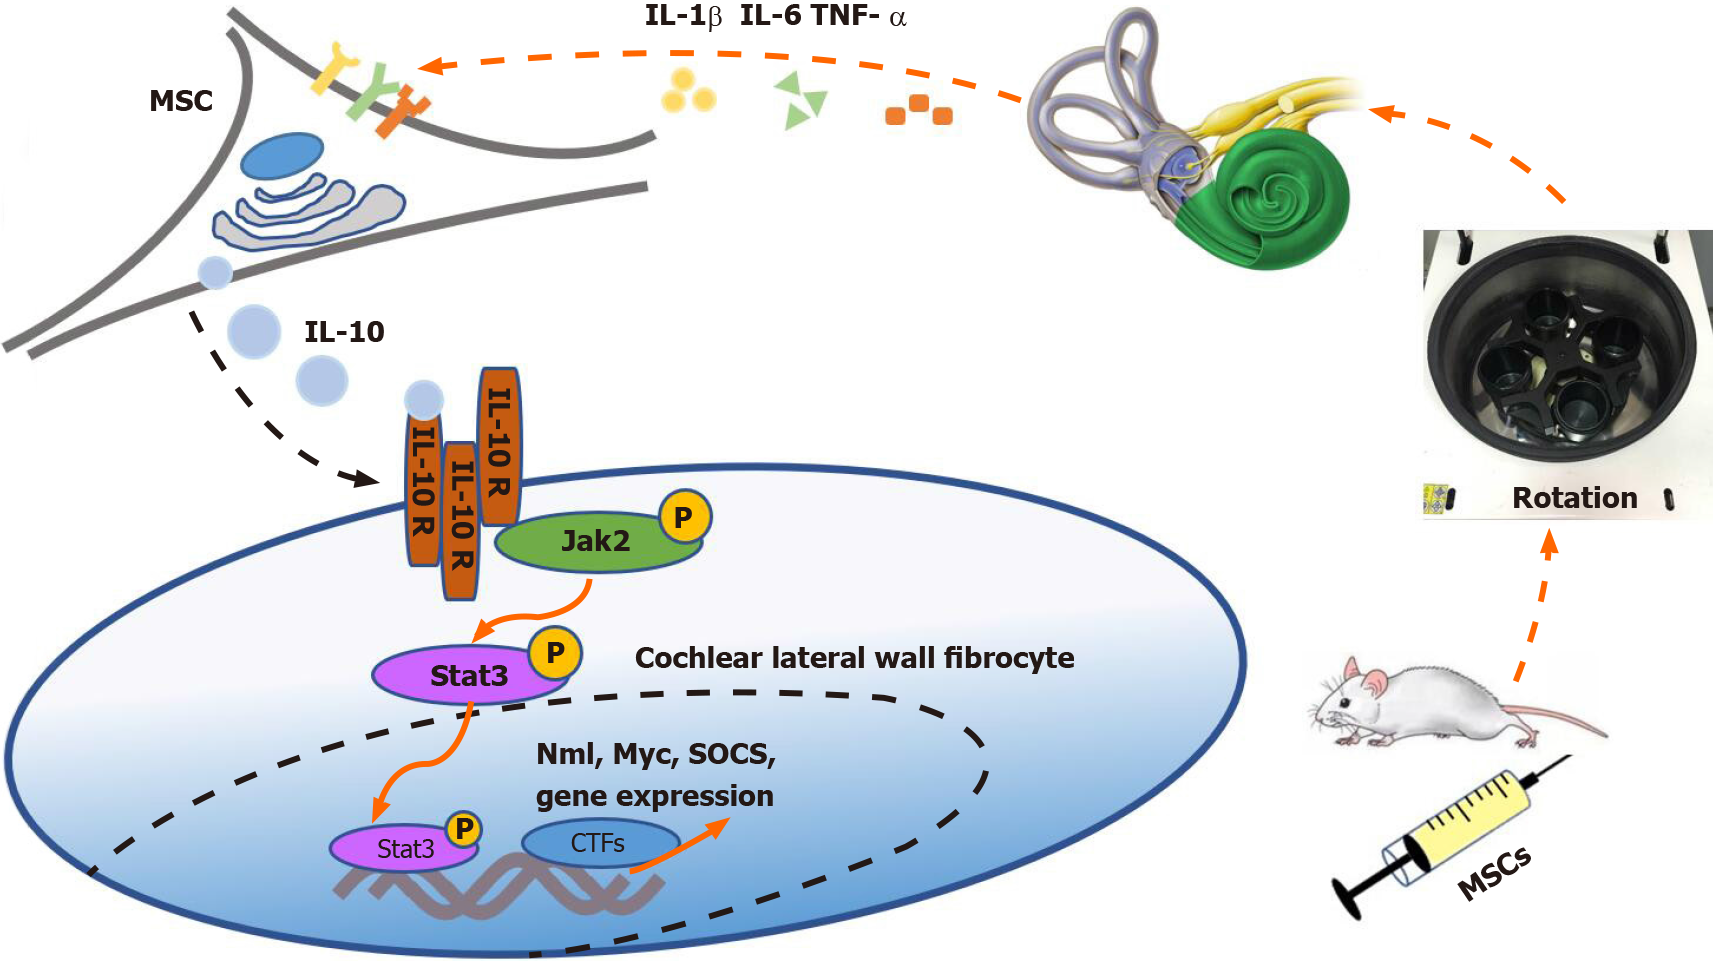
Figure 7 Proposed mechanism of action of mesenchymal stem cells in the vestibular microenvironment.
Mice were first prophylactically infused with mesenchymal stem cells (MSCs). After that, the motion sickness (MS) model was established at specified time points. At this time, pro-inflammatory cytokines in the vestibular environment of mice were released. MSCs were stimulated by these cytokines to secrete interleukin-10 (IL-10). Then, IL-10 receptors on fibrocytes in the cochlear lateral wall were triggered to activate the JAK2/STAT3 signaling pathway. Finally, the sensitivity of the vestibular cortex was reduced. IL: Interleukin; TNF-α: Tumor necrosis factor-alpha; MSCs: Mesenchymal stem cells; SOCS: Suppressor of cytokine signalling; Myc: Myelocytomatosis oncogene; CTFs: C-terminal fragments.
- Citation: Zhu HS, Li D, Li C, Huang JX, Chen SS, Li LB, Shi Q, Ju XL. Prior transfusion of umbilical cord mesenchymal stem cells can effectively alleviate symptoms of motion sickness in mice through interleukin 10 secretion. World J Stem Cells 2021; 13(2): 177-192
- URL: https://www.wjgnet.com/1948-0210/full/v13/i2/177.htm
- DOI: https://dx.doi.org/10.4252/wjSC.v13.i2.177


