Copyright
©The Author(s) 2019.
World J Stem Cells. Feb 26, 2019; 11(2): 100-123
Published online Feb 26, 2019. doi: 10.4252/wjsc.v11.i2.100
Published online Feb 26, 2019. doi: 10.4252/wjsc.v11.i2.100
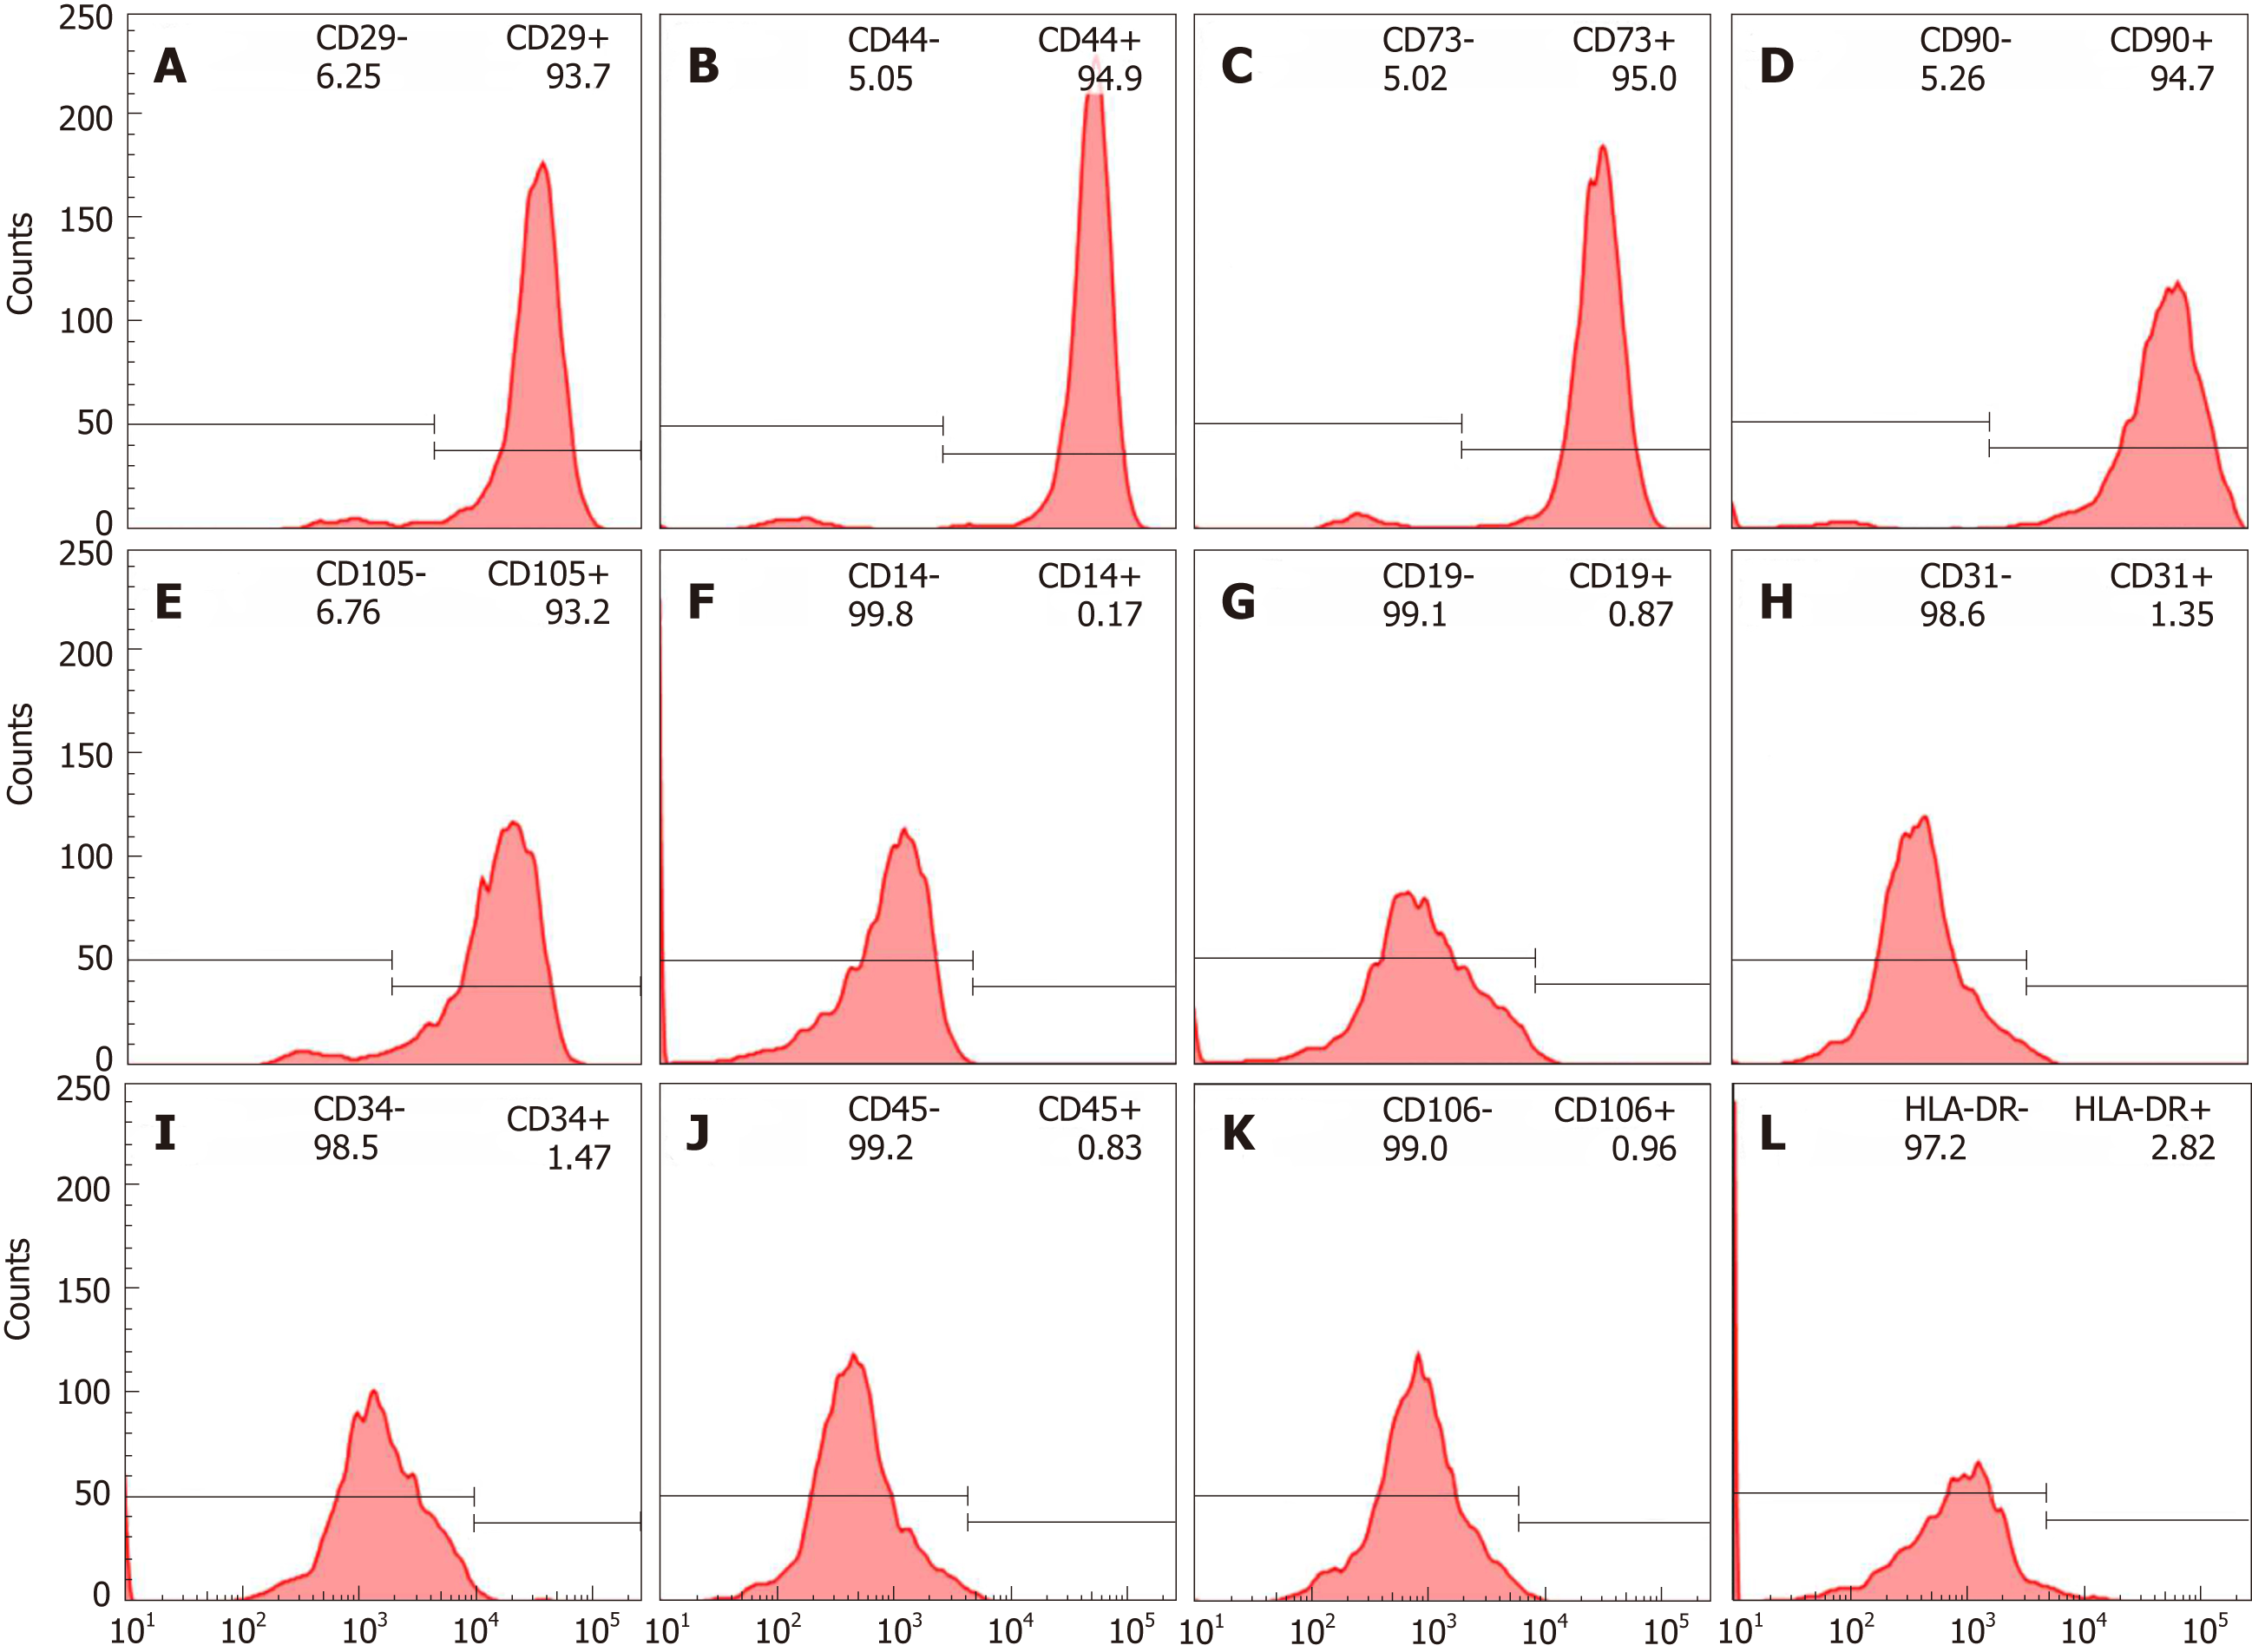
Figure 1 Immunophenotypic characterization of human bone marrow mesenchymal stem cells.
A-D: Positive surface markers CD29, CD44, CD 73, CD90 and CD105; E-K: Negative surface markers CD14, CD19, CD31, CD34, CD45 and CD106; L: Low levels of HLA-DR.
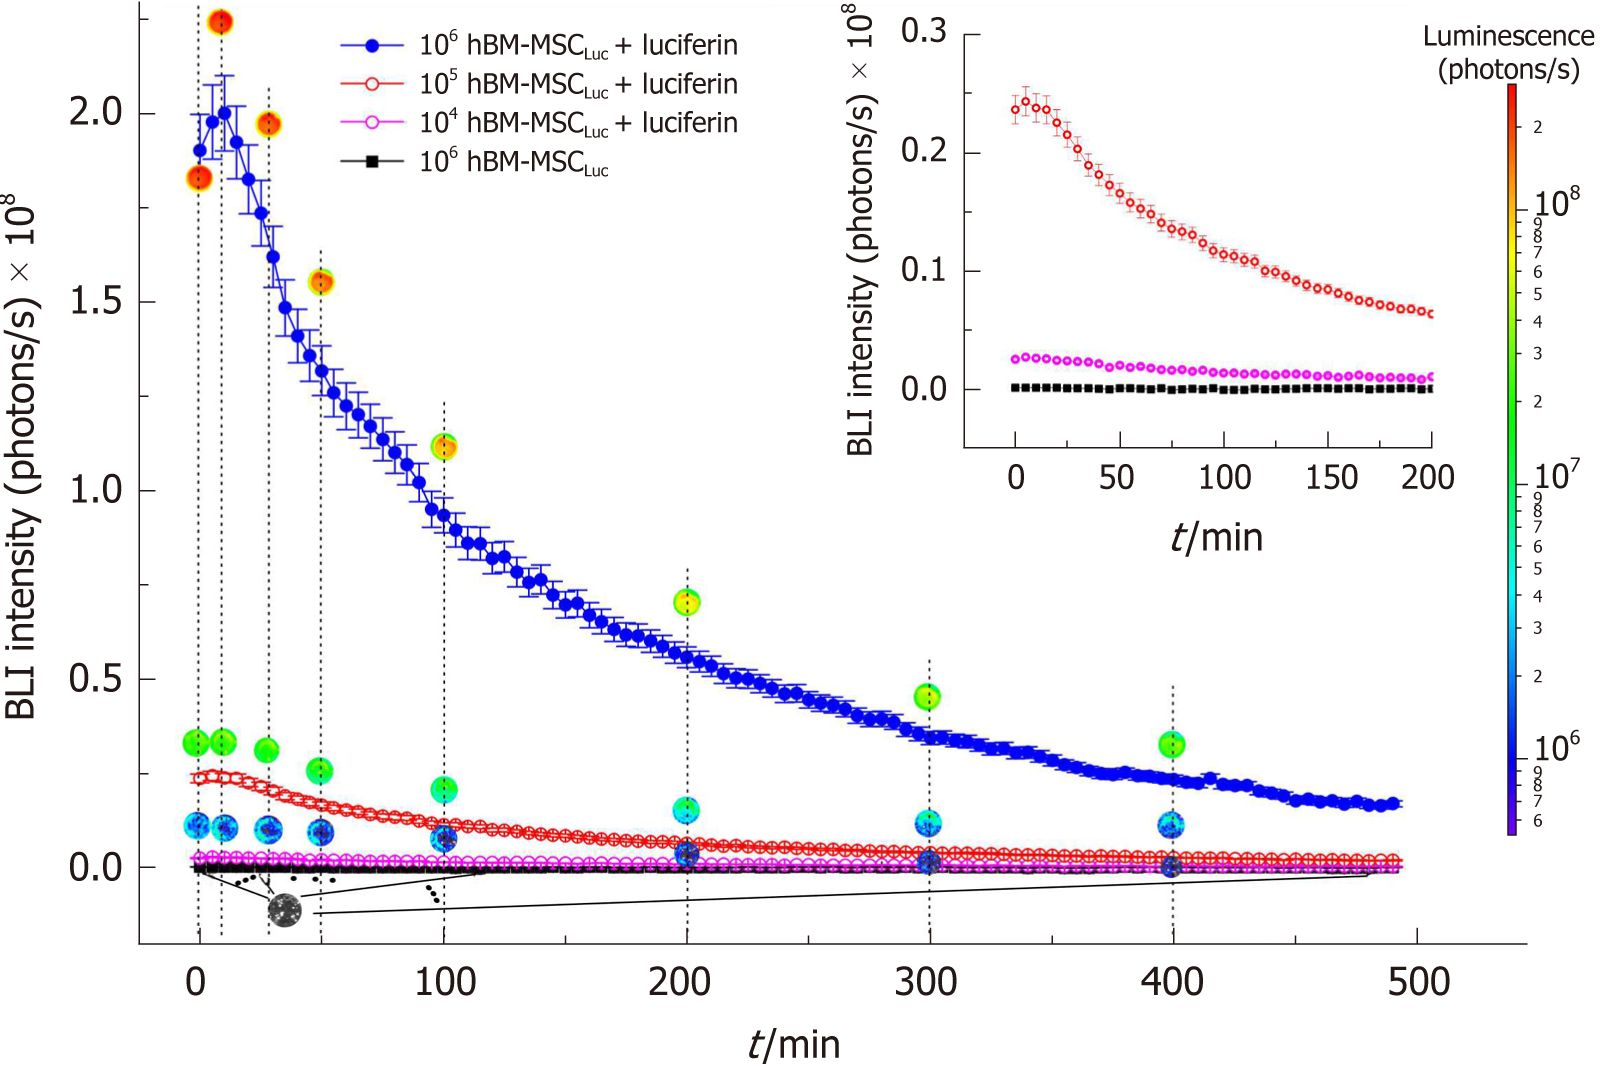
Figure 2 Expression of the bioluminescence signal as a function of number of human bone marrow mesenchymal stem cellsLuc over 490 min.
The 104, 105, and 106 hBM-MSCLuc groups with luciferin addition and the 106 hBM-MSCLuc group without luciferin addition are represented by curves in pink, red, blue and black, respectively. The inset shows the amplified signals of 104 and 105 hBM-MSCLuc with luciferin addition and 106 hBM-MSCLuc without luciferin addition. hBM-MSC: Human bone marrow mesenchymal stem cells.
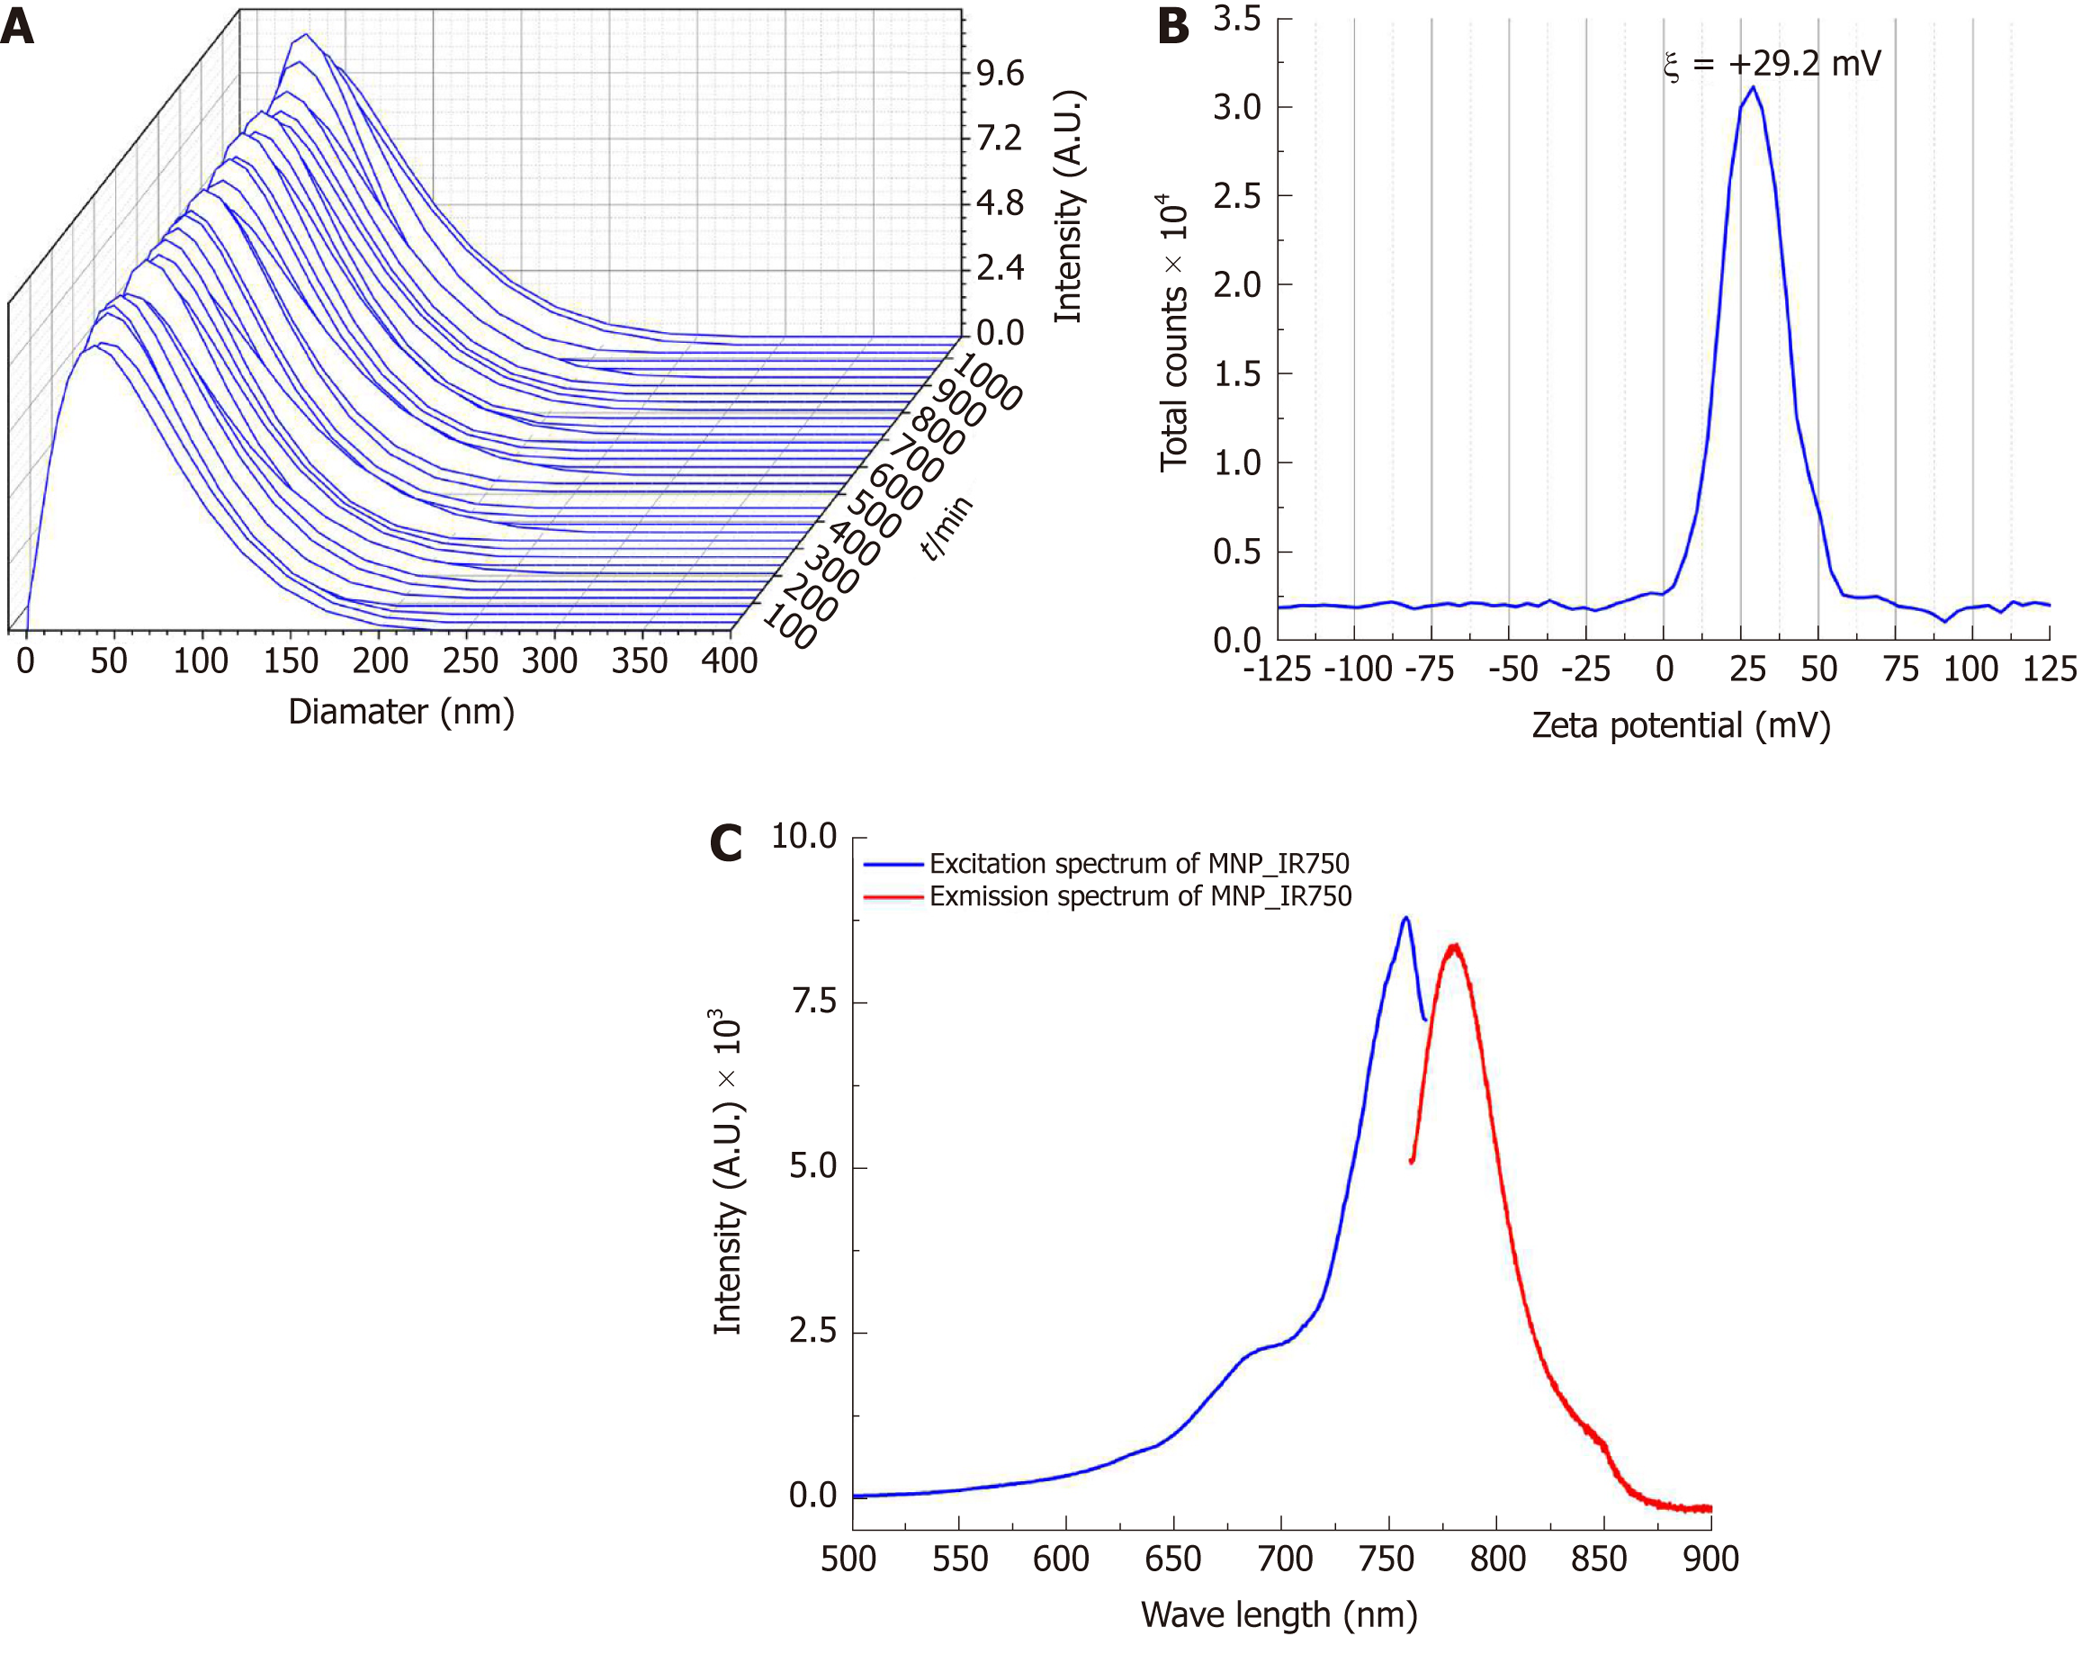
Figure 3 Characterization of the hydrodynamic diameter, zeta potential and optical properties of multimodal nanoparticles-IR750.
A: Curves of the hydrodynamic size distribution of MNP-IR750 over 18 h; B: Spectrum of the surface charge of MNP-IR750 with a zeta potential at pH 7.4 of ξ = +29.2±1.9 mV; C: MNP-IR750 excitation/emission spectrum (blue and red curves, respectively), showing fluorescence intensity peaks of 757.9 and 779.4 nm, respectively. MNP: Multimodal nanoparticles.
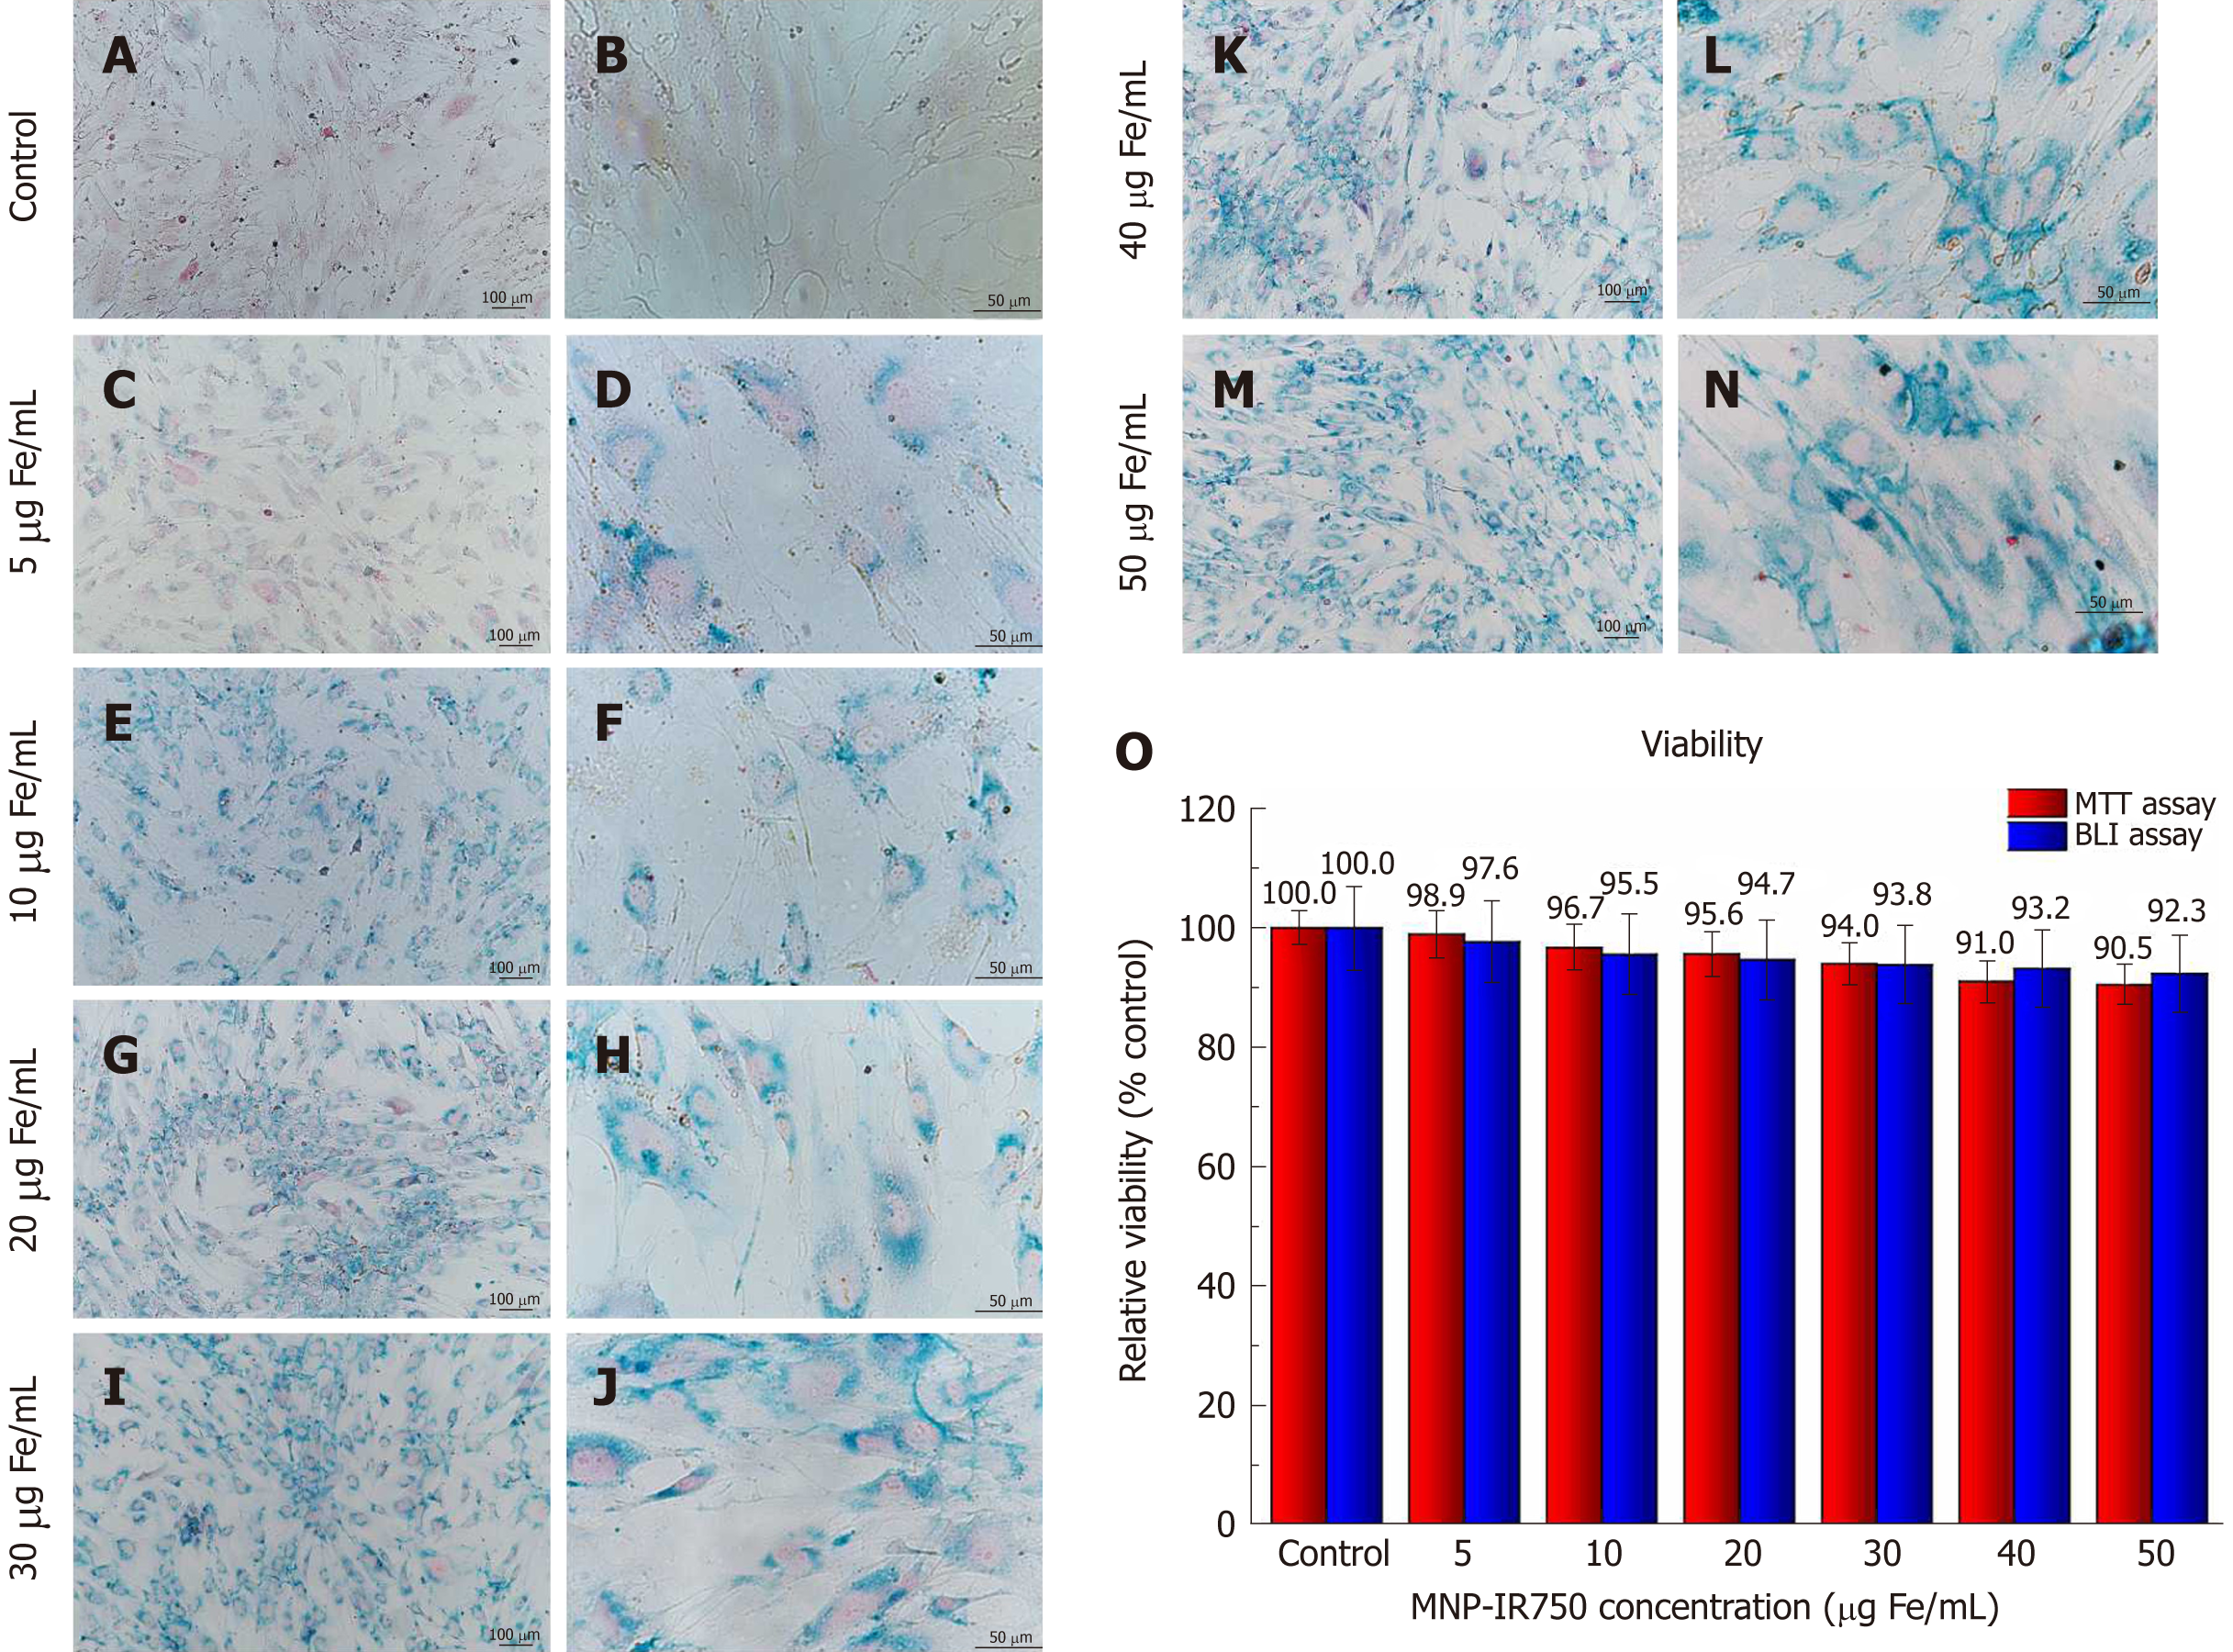
Figure 4 Internalization and viability analysis of human bone marrow mesenchymal stem cellsLuc labeled with multimodal nanoparticles-IR750.
A-N: Optical microscopy images of hBM-MSCLuc labeled with MNP-IR750, shown at 10 × (left column images) and 40 × (right column images); O: Cellular viability of hBM-MSCLuc after labeling in MTT (red bars) and BLI (blue bars) assays. Internalization of MPN-IR750 was performed at the following concentrations: 5, 10, 20, 30, 40 and 50 µg Fe/mL. hBM-MSC: Human bone marrow mesenchymal stem cells; MNP: Multimodal nanoparticles; MTT: The 3-[4,5-dimethylthiazol-2-yl]-2,5 diphenyl tetrazolium bromide; BLI: Bioluminescent images.
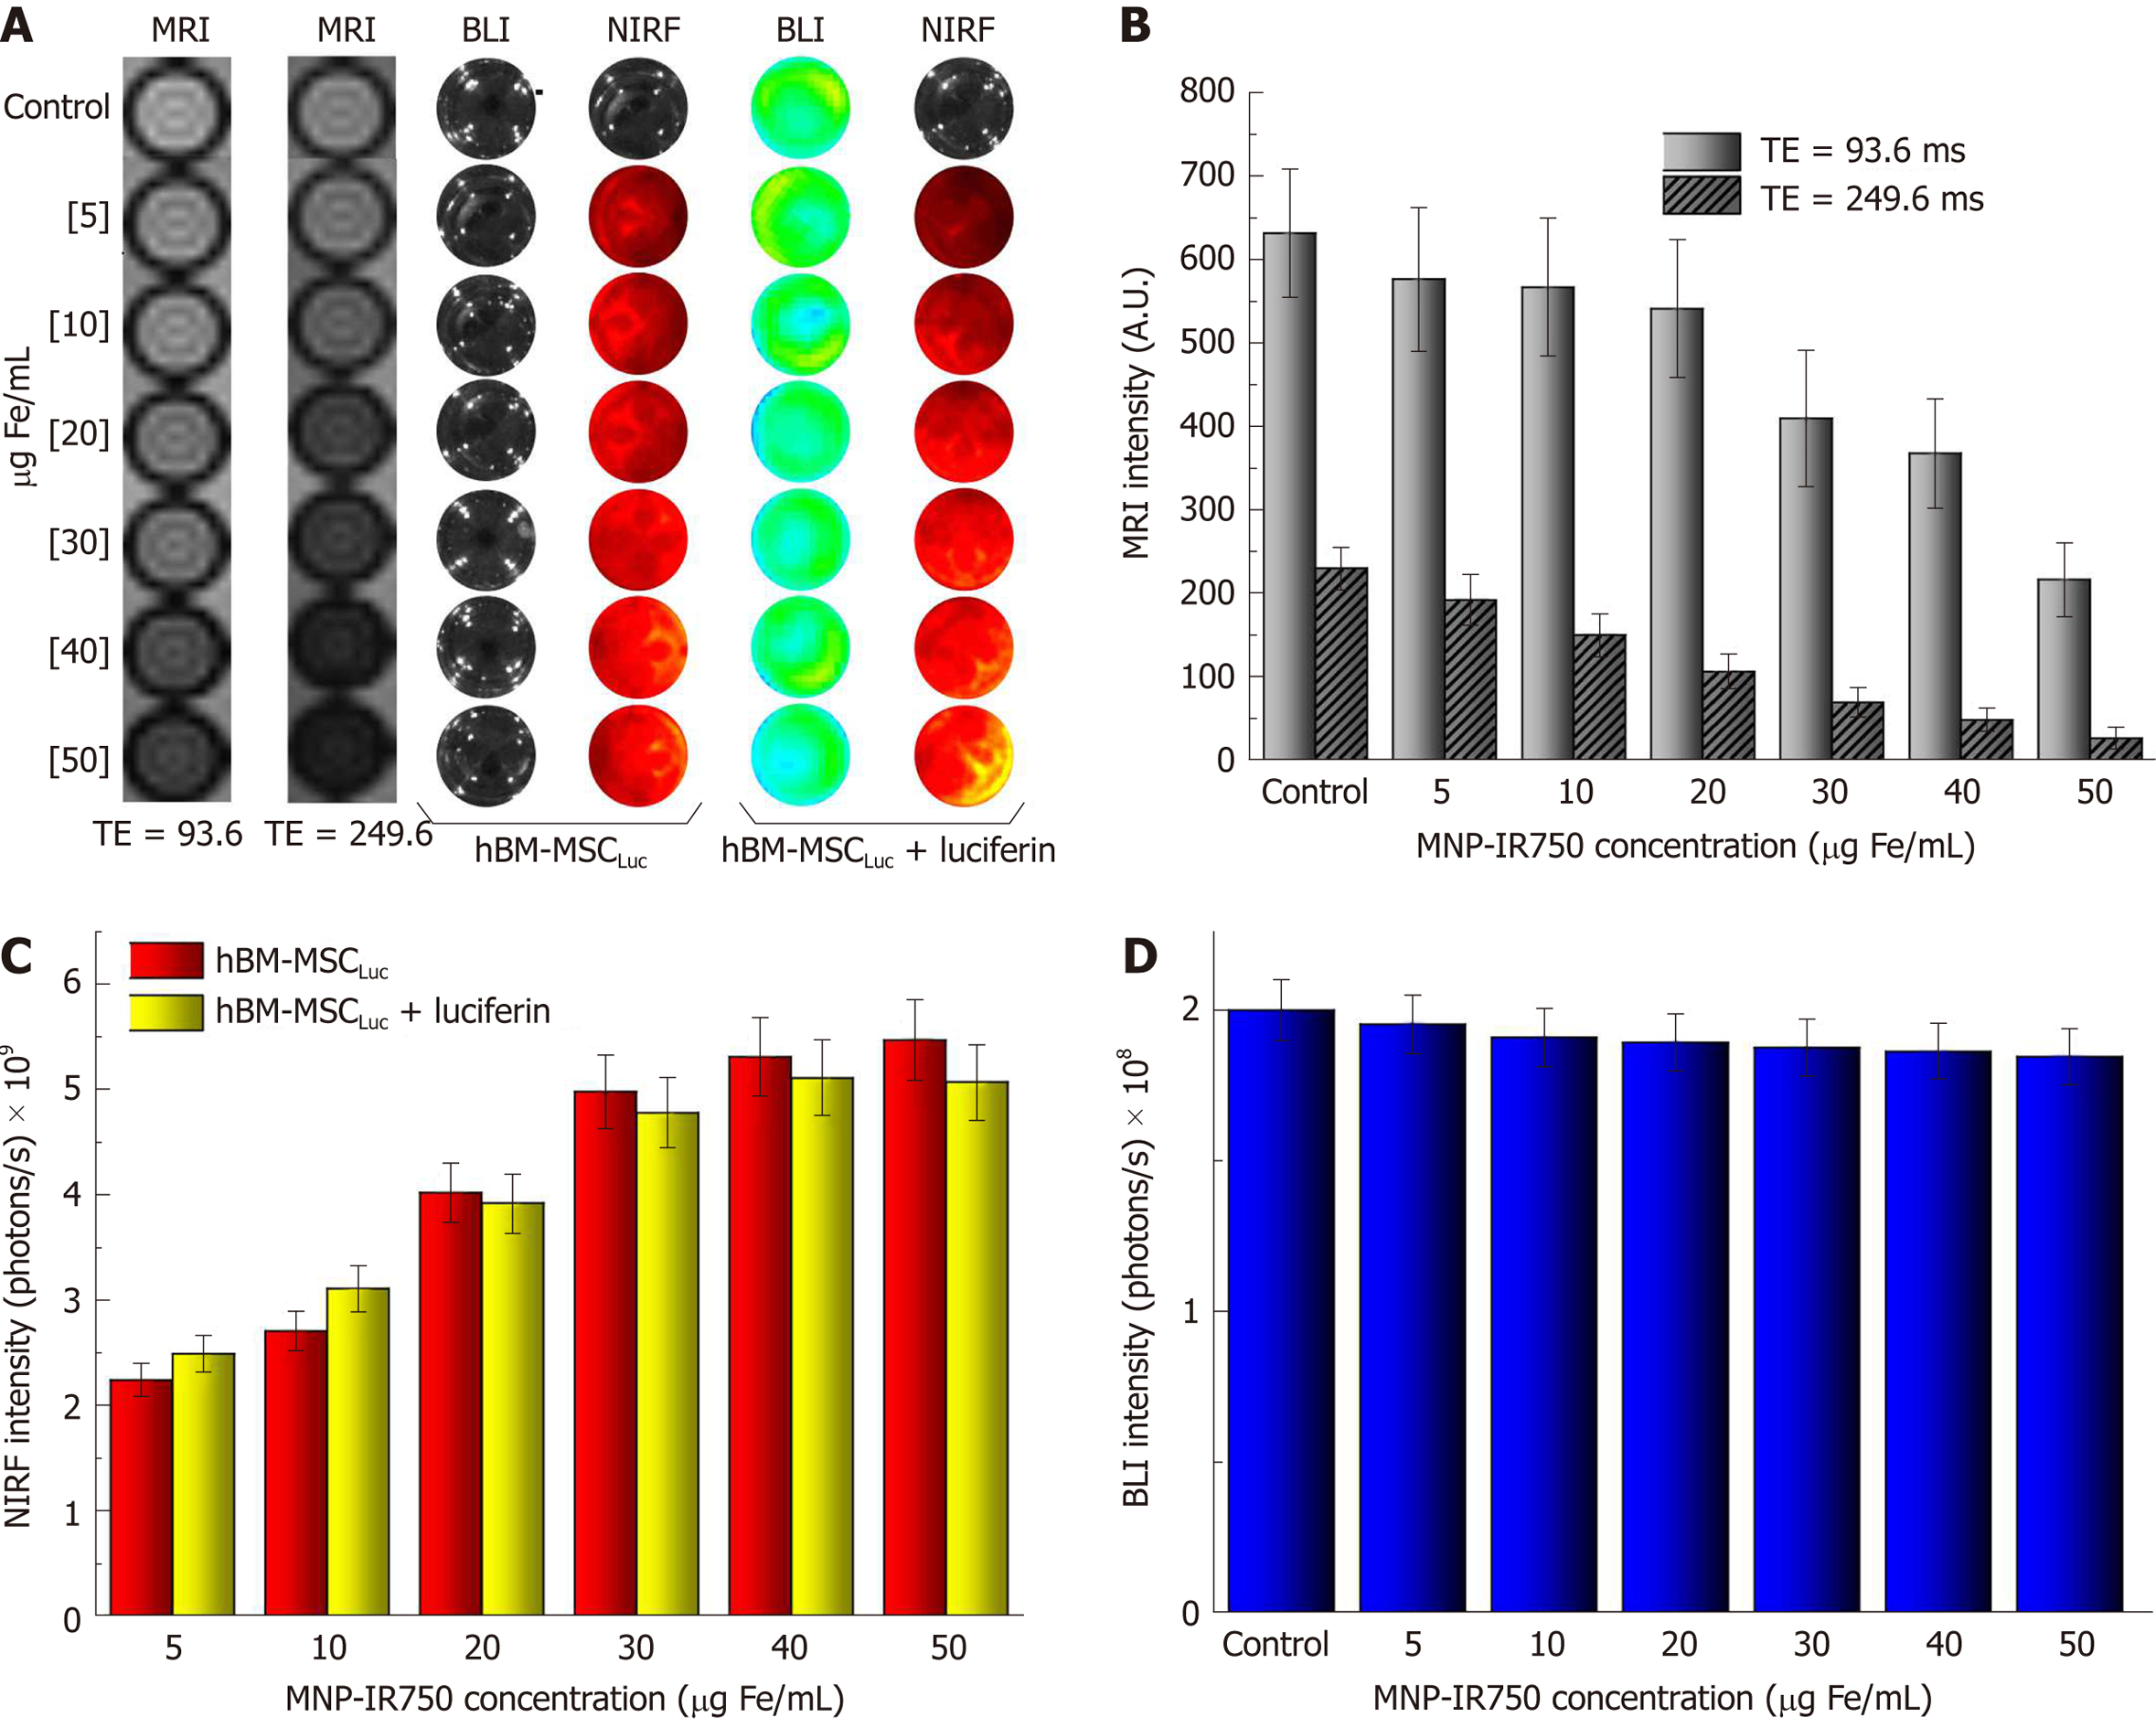
Figure 5 Evaluation of magnetic resonance imaging, near-infrared fluorescence and bioluminescent images intensity signals in vitro.
A: Images of hBM-MSCLuc phantoms, labeled with different concentrations of MNP-IR750, comparing short vs long TEs via MRI and before vs after the addition of luciferin via NIRF and BLI; B: Graphic representation of the MRI signal intensity of all samples acquired with a TE of 93.6 ms (light gray bars) and a TE of 249.6 ms (dark gray bars); C: Graphic representation of the NIRF signal intensity of all samples acquiring before luciferin addition (red bars) and after luciferin addition (yellow bars); D: Graphic representation of BLI signal intensity after luciferin addition in all samples with different concentrations of MNP-IR750. hBM-MSC: Human bone marrow mesenchymal stem cells; MNP: Multimodal nanoparticles; MRI: Magnetic resonance imaging; NIRF: Near-infrared fluorescence; BLI: Bioluminescent images.
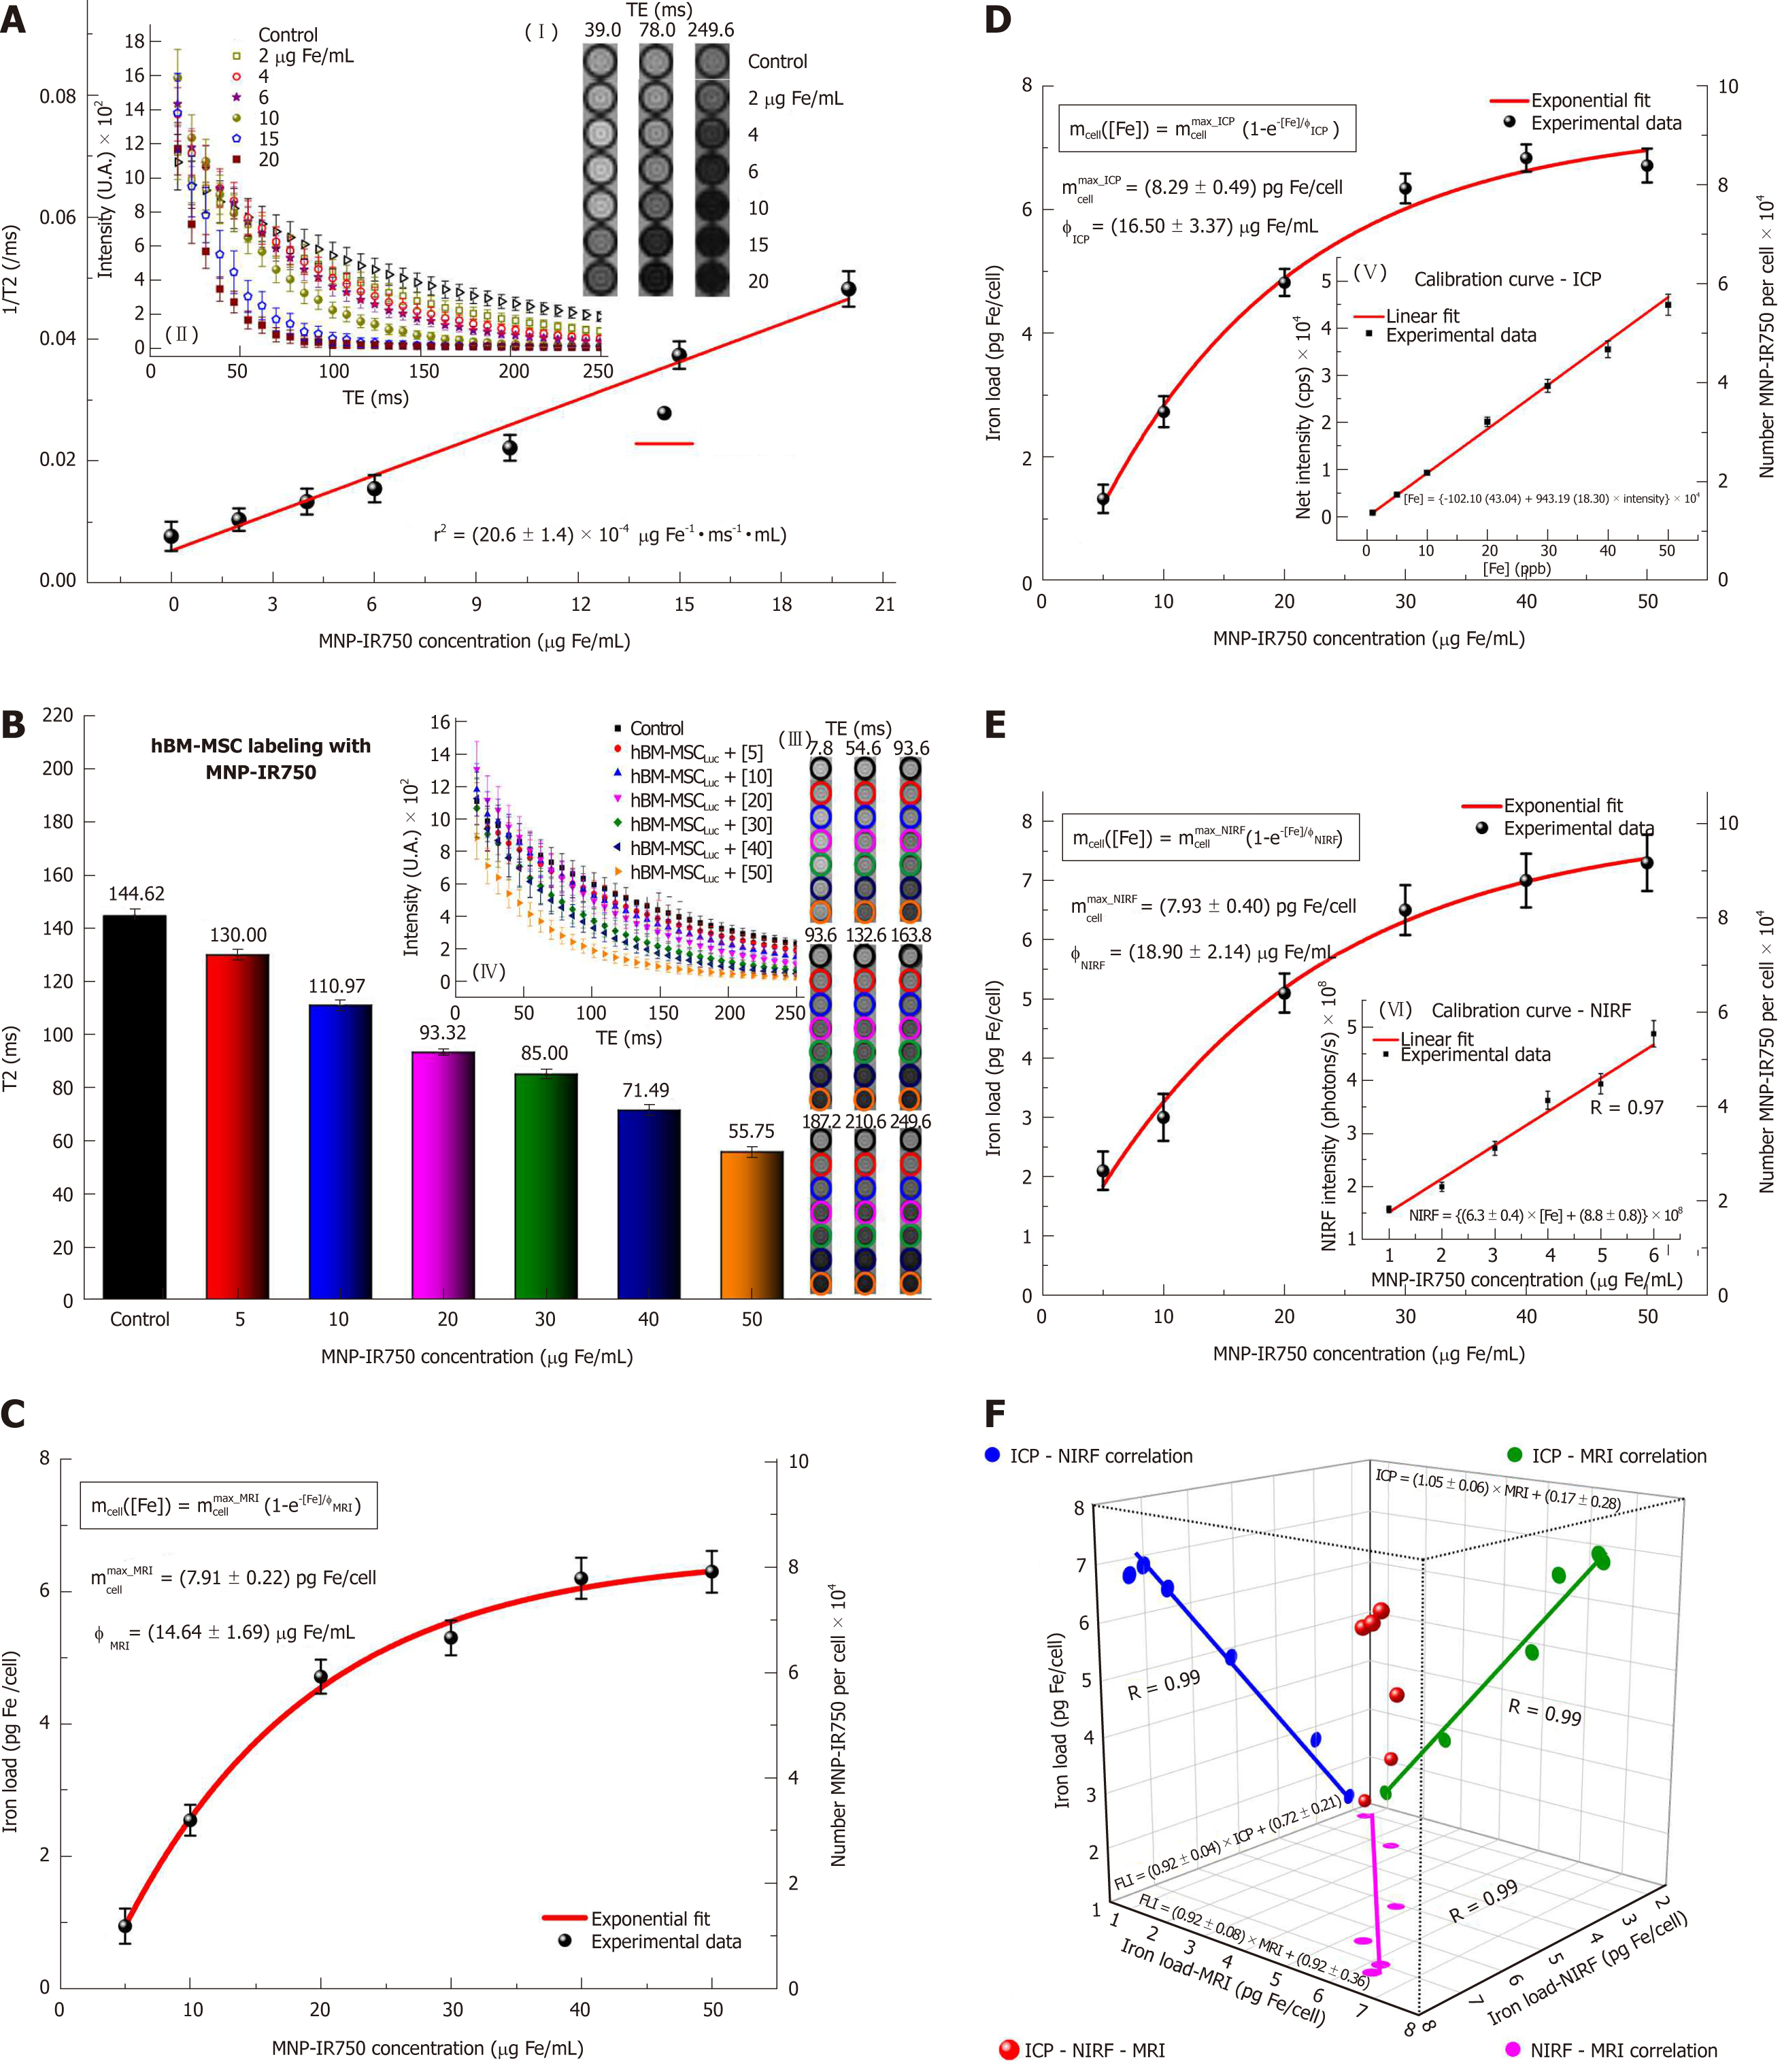
Figure 6 Quantification of multimodal nanoparticles-IR750 internalized by human bone marrow mesenchymal stem cellsLuc using magnetic resonance imaging, inductively coupled plasma-mass spectrometry and near-infrared fluorescence images in vitro.
For quantification via MRI, (A) the r2 values were determined from the intensity signal of MNP-IR750 at different concentrations as a function of TEs (I-II); B: the T2 values of hBM-MSCLuc labeled with MNP-IR750 at different concentrations were determined based on the adjustment of the MRI signal exponential decay curves obtained for the MRI images of ROIs (III-IV); C: the MNP-IR750 load and number internalized per cell as a function of different labeling concentrations were determined via MRI, and these values were adjusted based on an exponential curve, following equation 3 and the parameters determined for this equation; D: the MNP-IR750 load and number internalized per cell as a function of different labeling concentrations were determined via ICP-MS (V) from the calibration curve generated using known MNP-IR750 concentrations, and the values determined via ICP-MS quantification were adjusted based on an exponential curve, following equation 3 and the parameters determined for this equation; E: the MNP-IR750 load and number internalized per cell as a function of different labeling concentrations were determined via NIRF imaging (VI) from the calibration curve generated using known MNP-IR750 concentrations, and the values determined via NIRF quantification were adjusted with an exponential curve, following equation 3 and the parameters determined for this equation; and F: the correlation of the MNP-IR750 load internalized by hBM-MSCLuc was compared between ICP-MS and NIRF (blue dots), ICP-MS and MRI (green dots), NIRF and MRI (pink dots). hBM-MSC: Human bone marrow mesenchymal stem cells; MNP: Multimodal nanoparticles; ICP-MS: Inductively coupled plasma-mass spectrometry; MRI: Magnetic resonance imaging; NIRF: Near-infrared fluorescence; BLI: Bioluminescent images.
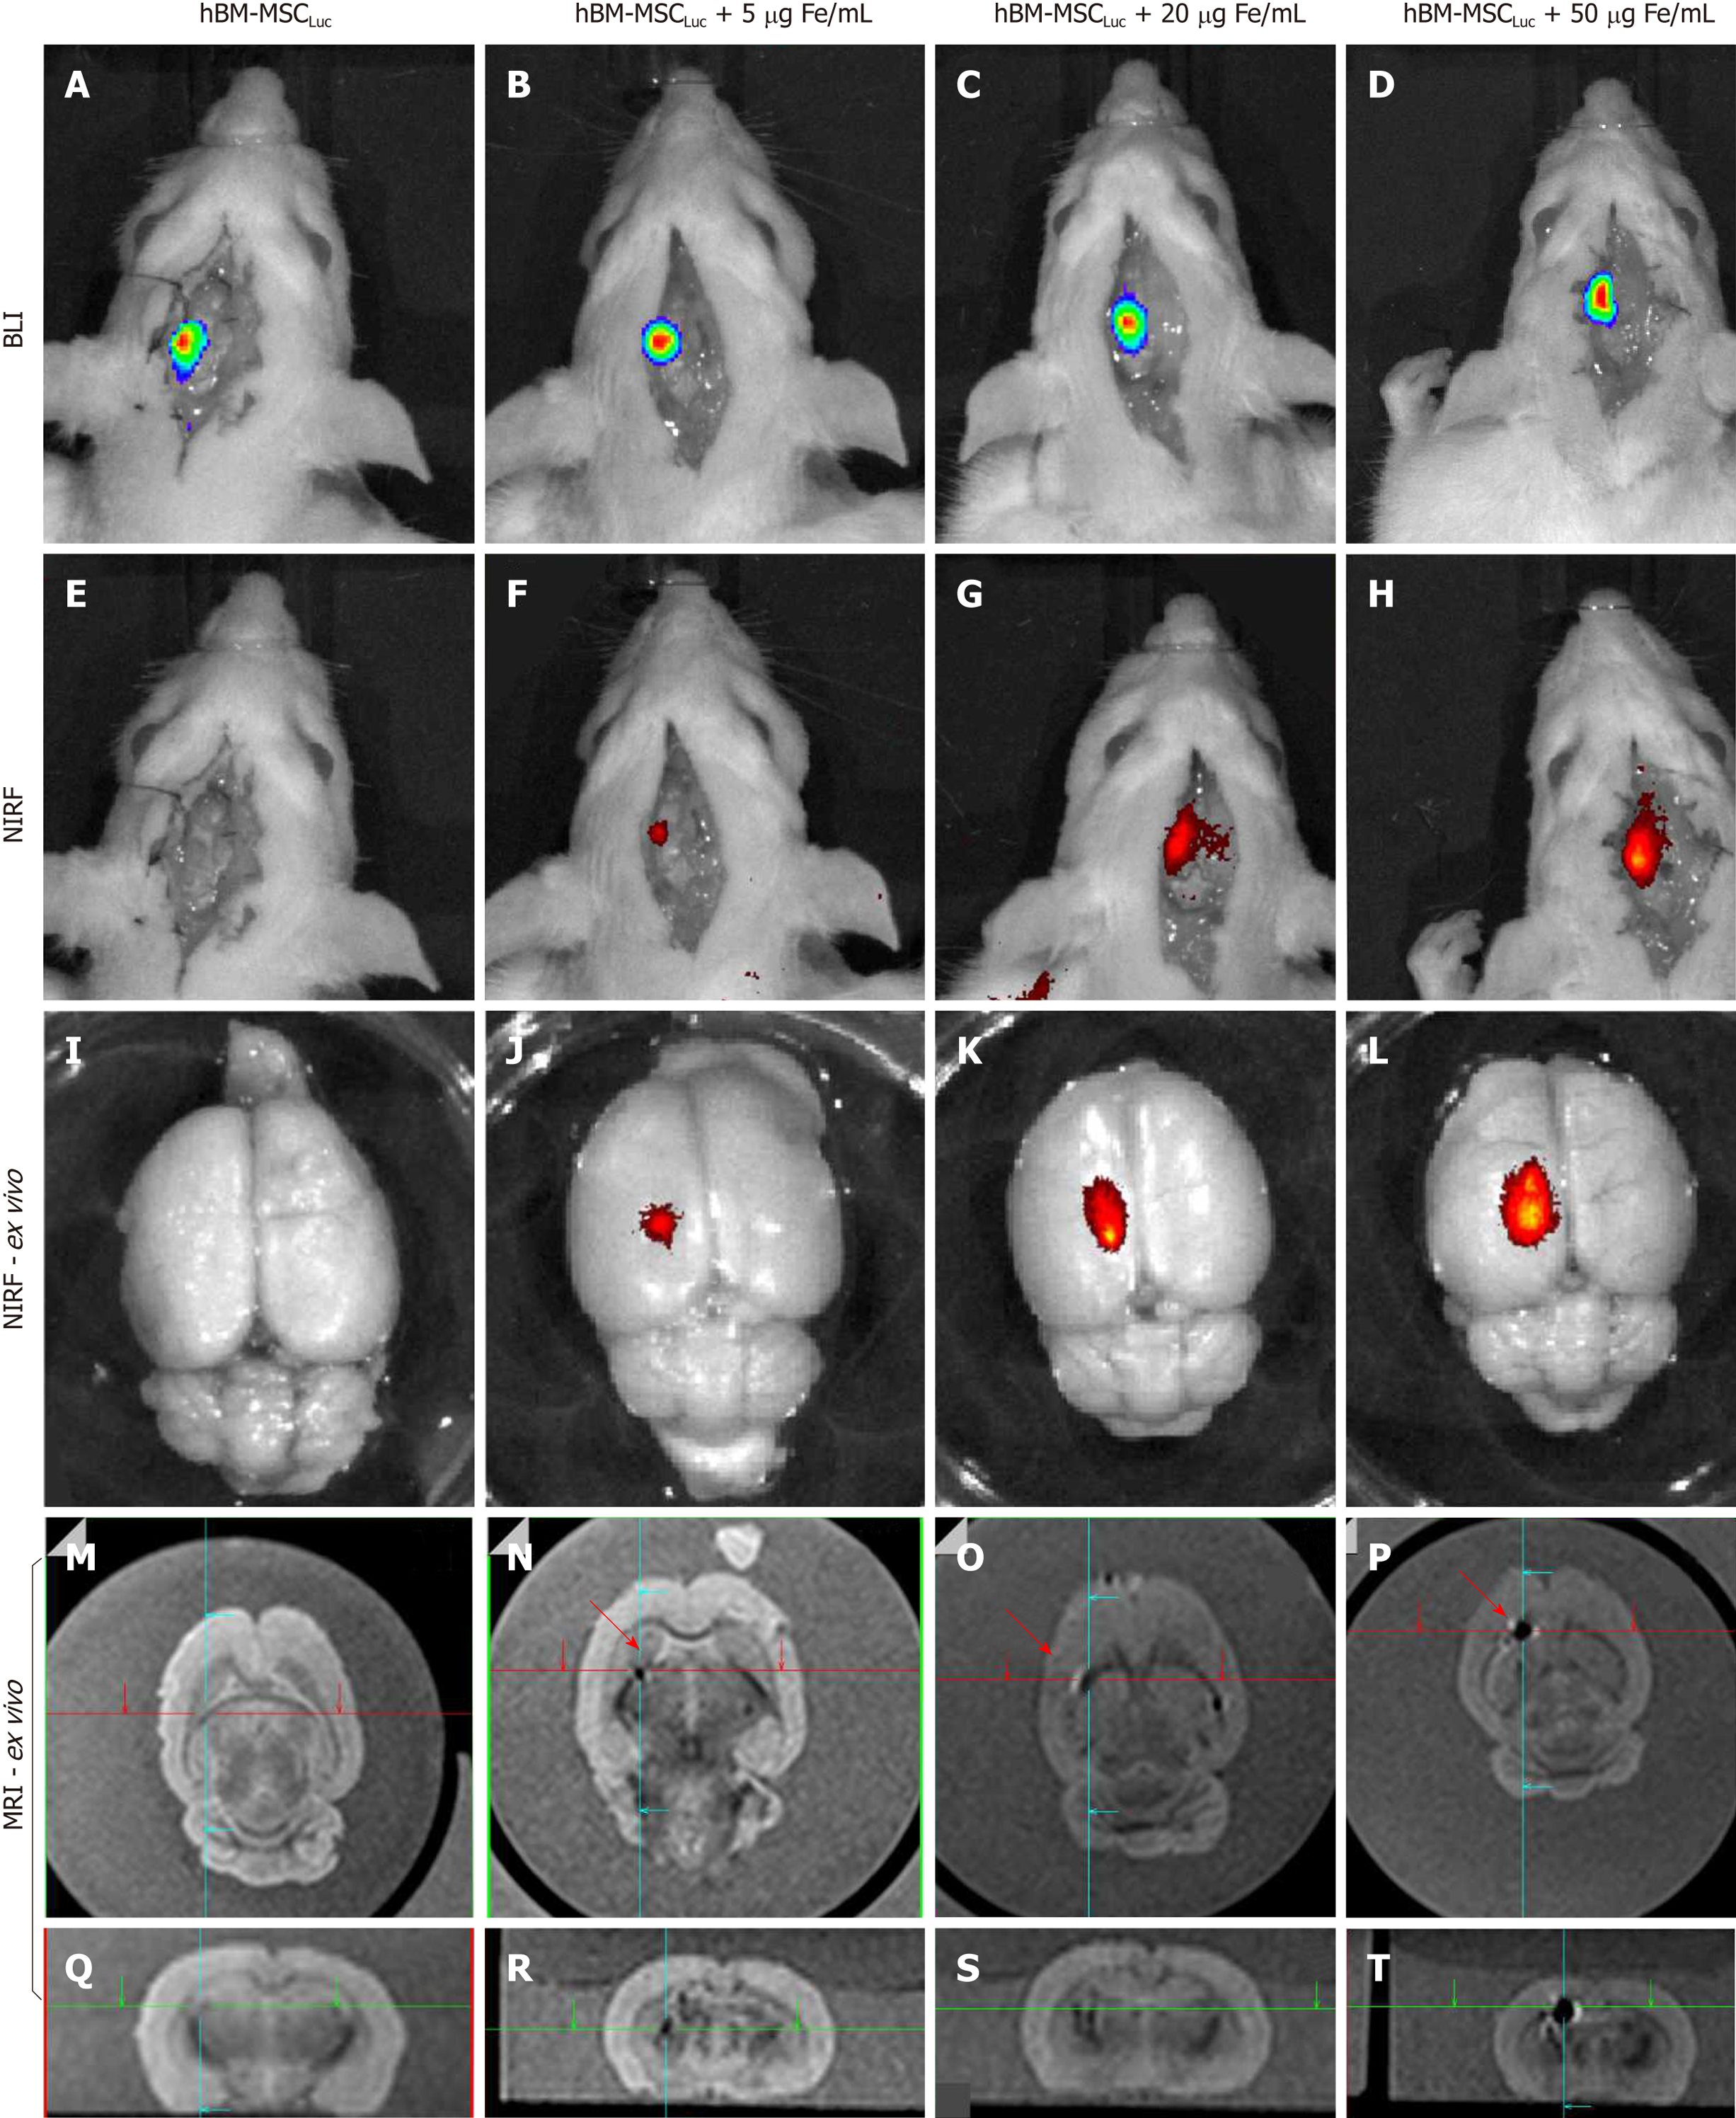
Figure 7 Evaluation of bioluminescent images, near-infrared fluorescence, and magnetic resonance imaging signals of labeled human bone marrow mesenchymal stem cellsLuc implanted in animals (sham groups).
A: BLI image of the sham_control group after luciferin addition; B-D: BLI images after luciferin addition in the sham_S5, sham_S20 and sham_S50 groups; E: NIRF image of the sham_control group; F-H: NIRF images of the sham_S5, sham_S20 and sham_S50 groups; I, L: ex vivo NIRF images of all groups; M-Q: Sagittal and coronal MRI of the sham_control group; N-P: Sagittal MRI of the sham_s5, sham_s20 and sham_S50 groups, showing the position of iron signal detection with red arrows; R-T: Coronal MRI of the sham_s5, sham_s20 and sham_S50 groups, showing the position of iron signal detection with crossing green lines. (n = 7 rats/group). BLI: Bioluminescent images; hBM-MSC: Human bone marrow mesenchymal stem cells; NIRF: Near-infrared fluorescence; MRI: Magnetic resonance imaging.
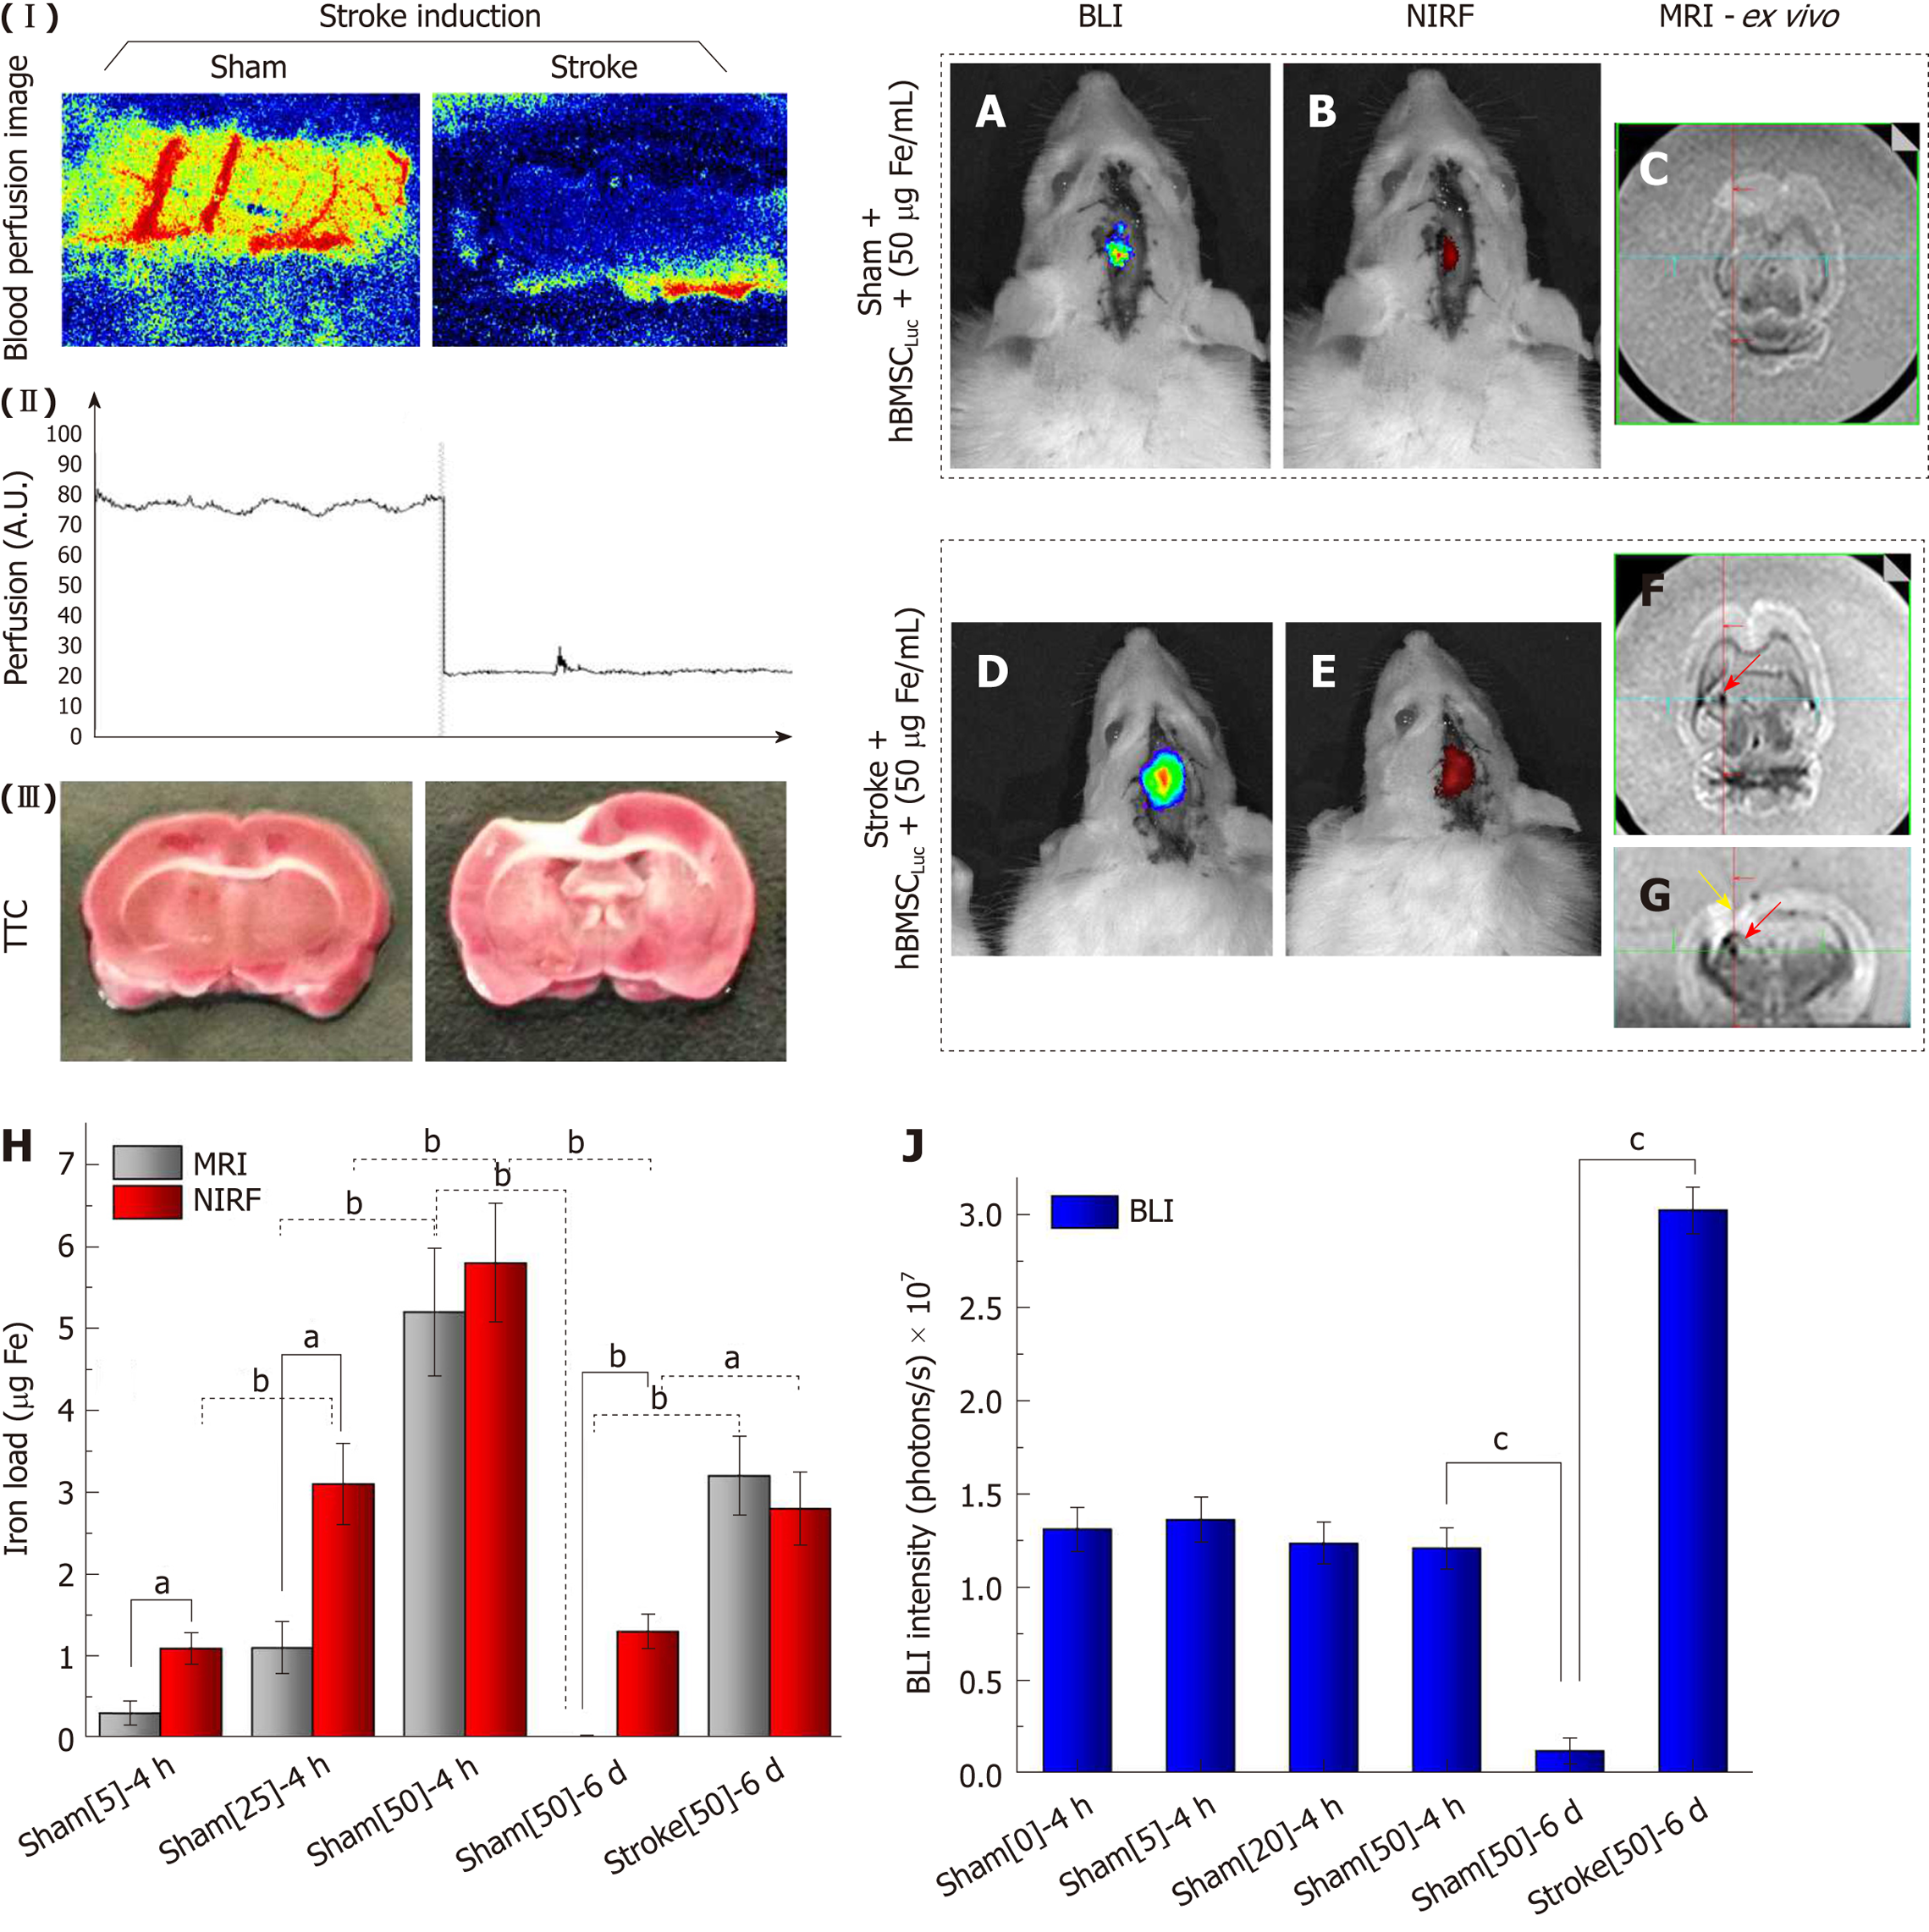
Figure 8 Evaluation of near-infrared fluorescence, bioluminescent images (in vivo) and magnetic resonance imaging signals (ex vivo) after 6 d of stroke induction.
(I) Local blood perfusion images of the basal condition and 30 min after stroke induction by thermocoagulation; (II) graphic representation of local blood perfusion showing the decrease in perfusion from 80 to 20 au, comparing the basal condition to 30 min after stroke induction; (III) TTC staining of the sham and stroke groups performed 120 min after ischemic lesion induction; A, B: In vivo BLI and NIRF images of the sham_50 group; C: Ex vivo MRI results of the sham_50 group; D, E: In vivo BLI and NIRF images of the stroke_50 group; F, G: Ex vivo MRI results of the stroke_50 group (red arrows show the presence of nanoparticles, and a yellow arrow shows the stroke lesion); H: Graphic representation of quantification of the iron load via NIRF (red bars) and MRI (gray bars) in different groups in experiments 1 and 2, aP < 0.05, bP < 0.001, MRI vs NIRF; J: Graphic representation of BLI intensity (blue bars) in different groups in experiments 1 and 2, cP < 0.05, vs sham[50]-6 d (n = 7 rats/group). BLI: Bioluminescent images; NIRF: Near-infrared fluorescence;
- Citation: da Silva HR, Mamani JB, Nucci MP, Nucci LP, Kondo AT, Fantacini DMC, de Souza LEB, Picanço-Castro V, Covas DT, Kutner JM, de Oliveira FA, Hamerschlak N, Gamarra LF. Triple-modal imaging of stem-cells labeled with multimodal nanoparticles, applied in a stroke model. World J Stem Cells 2019; 11(2): 100-123
- URL: https://www.wjgnet.com/1948-0210/full/v11/i2/100.htm
- DOI: https://dx.doi.org/10.4252/wjsc.v11.i2.100


