Copyright
©The Author(s) 2019.
World J Stem Cells. Feb 26, 2019; 11(2): 100-123
Published online Feb 26, 2019. doi: 10.4252/wjsc.v11.i2.100
Published online Feb 26, 2019. doi: 10.4252/wjsc.v11.i2.100
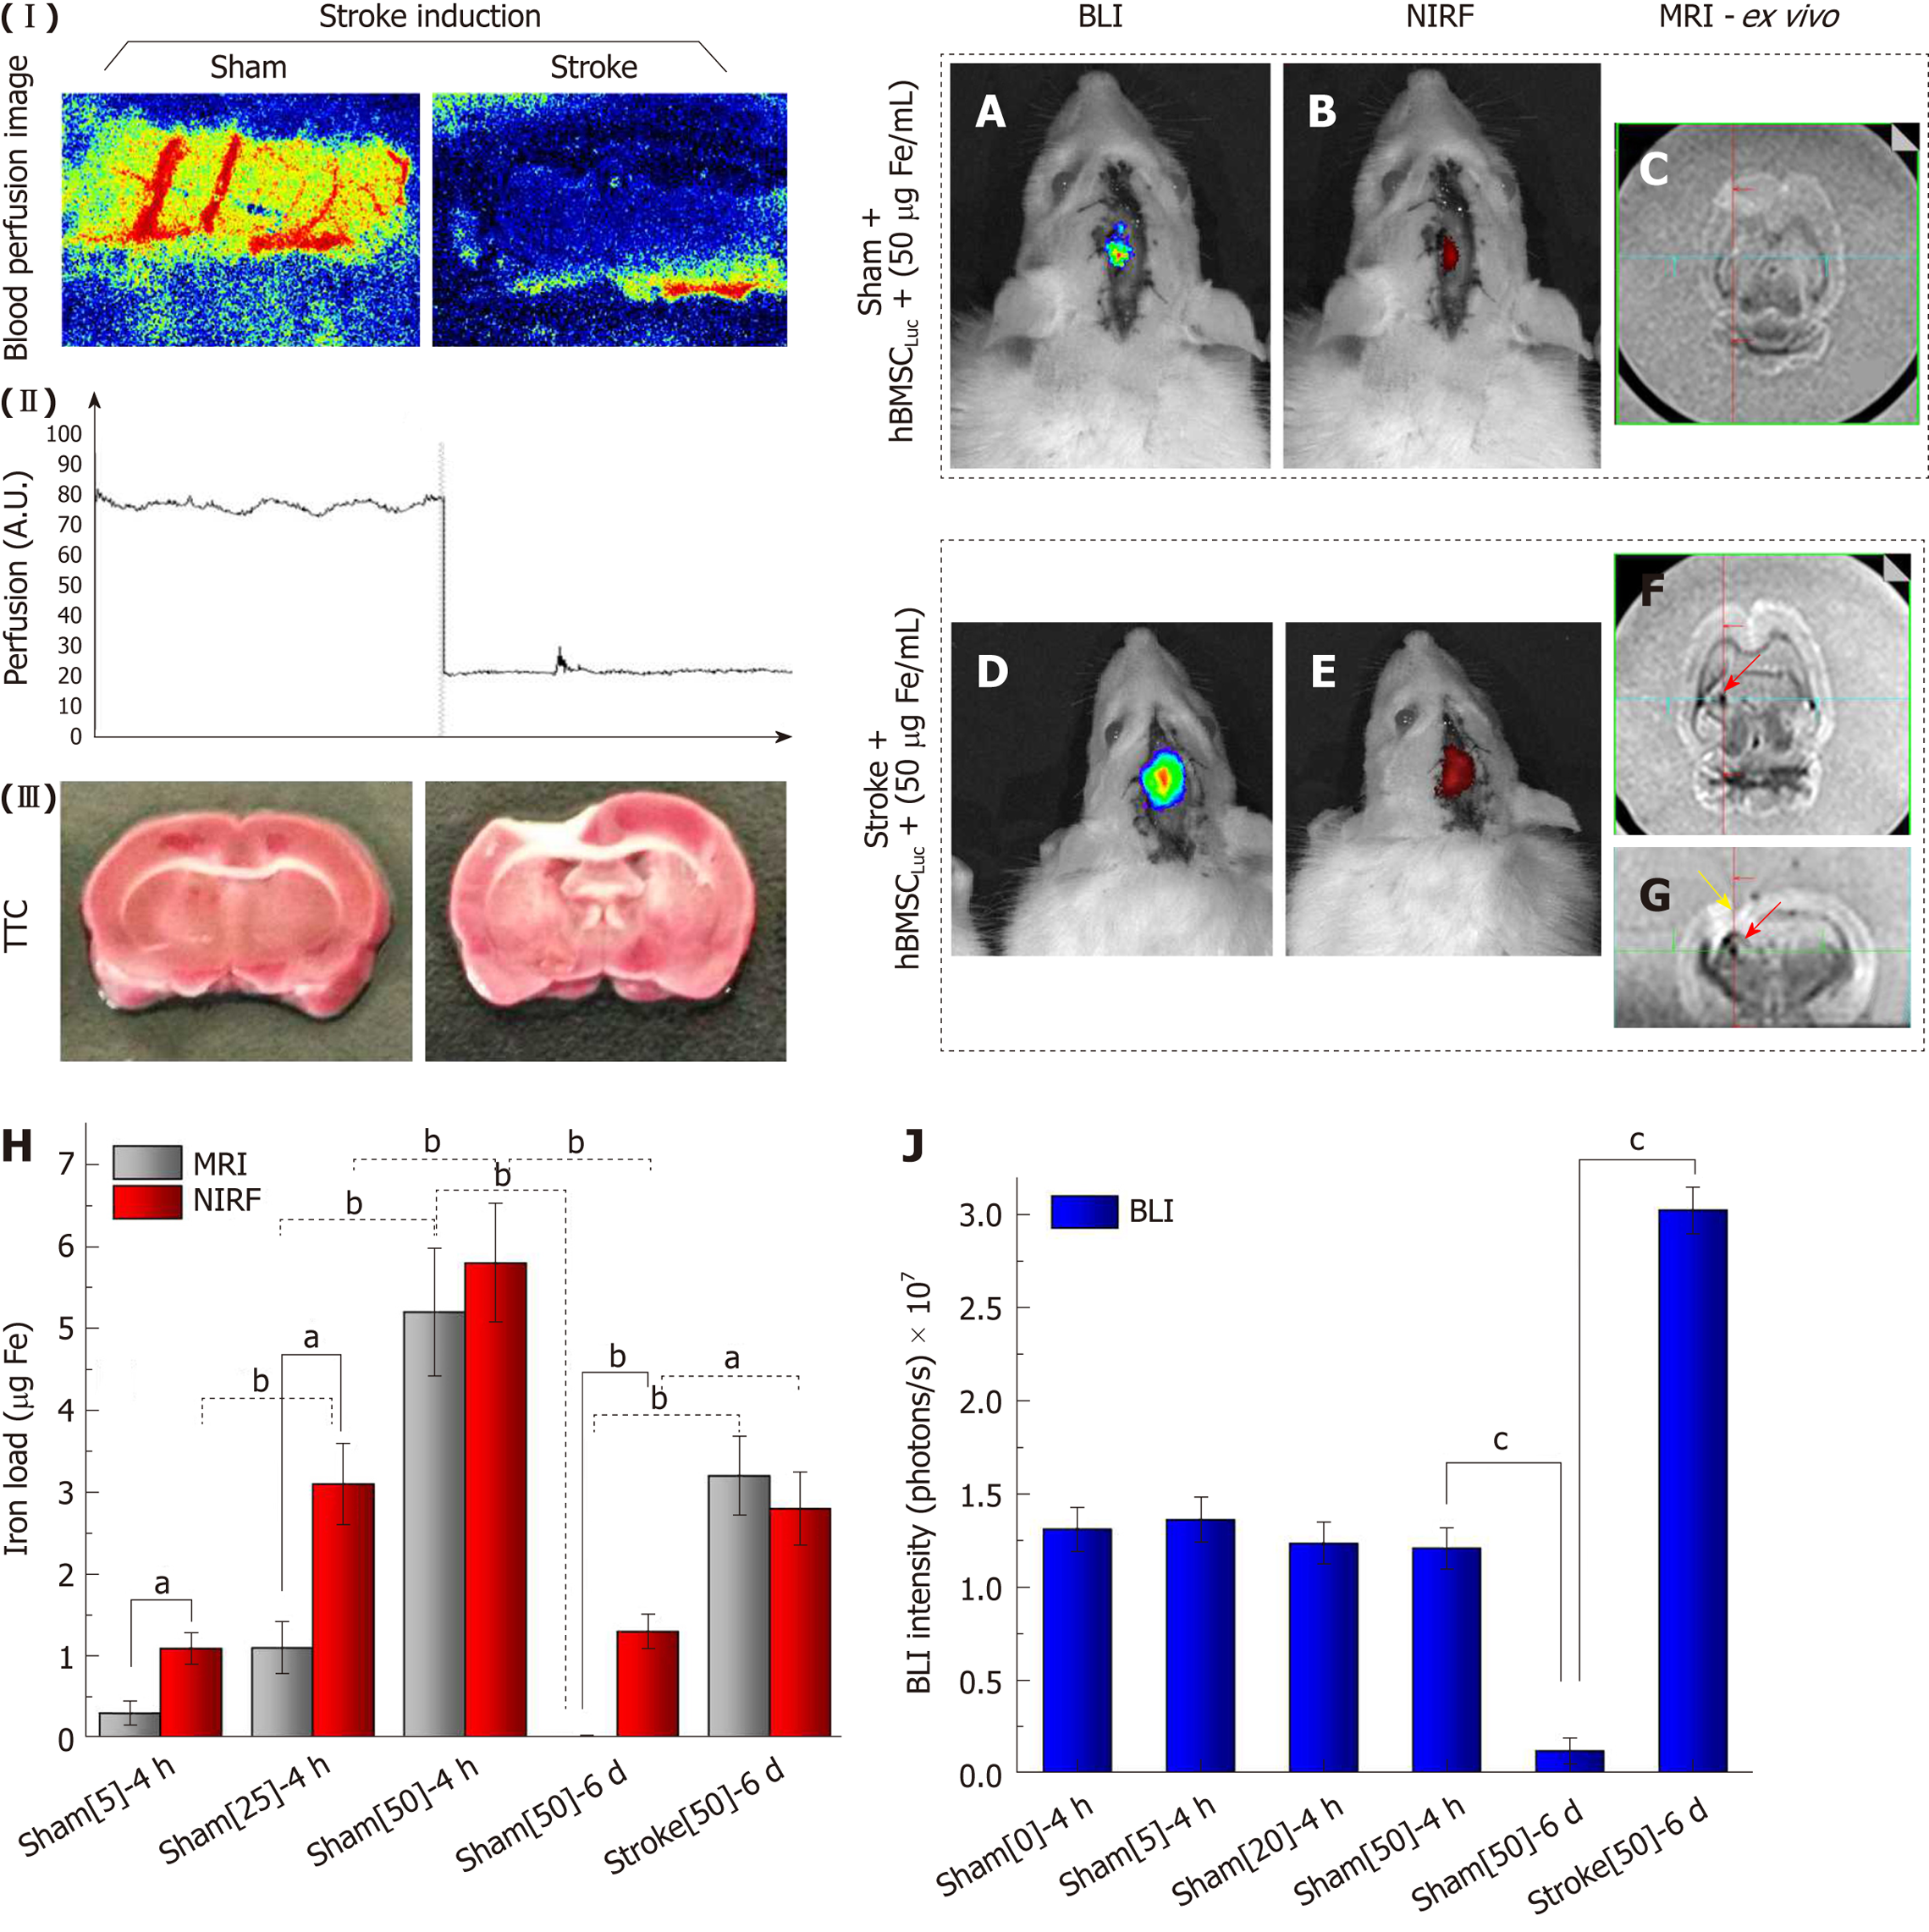
Figure 8 Evaluation of near-infrared fluorescence, bioluminescent images (in vivo) and magnetic resonance imaging signals (ex vivo) after 6 d of stroke induction.
(I) Local blood perfusion images of the basal condition and 30 min after stroke induction by thermocoagulation; (II) graphic representation of local blood perfusion showing the decrease in perfusion from 80 to 20 au, comparing the basal condition to 30 min after stroke induction; (III) TTC staining of the sham and stroke groups performed 120 min after ischemic lesion induction; A, B: In vivo BLI and NIRF images of the sham_50 group; C: Ex vivo MRI results of the sham_50 group; D, E: In vivo BLI and NIRF images of the stroke_50 group; F, G: Ex vivo MRI results of the stroke_50 group (red arrows show the presence of nanoparticles, and a yellow arrow shows the stroke lesion); H: Graphic representation of quantification of the iron load via NIRF (red bars) and MRI (gray bars) in different groups in experiments 1 and 2, aP < 0.05, bP < 0.001, MRI vs NIRF; J: Graphic representation of BLI intensity (blue bars) in different groups in experiments 1 and 2, cP < 0.05, vs sham[50]-6 d (n = 7 rats/group). BLI: Bioluminescent images; NIRF: Near-infrared fluorescence;
- Citation: da Silva HR, Mamani JB, Nucci MP, Nucci LP, Kondo AT, Fantacini DMC, de Souza LEB, Picanço-Castro V, Covas DT, Kutner JM, de Oliveira FA, Hamerschlak N, Gamarra LF. Triple-modal imaging of stem-cells labeled with multimodal nanoparticles, applied in a stroke model. World J Stem Cells 2019; 11(2): 100-123
- URL: https://www.wjgnet.com/1948-0210/full/v11/i2/100.htm
- DOI: https://dx.doi.org/10.4252/wjsc.v11.i2.100


