Copyright
©The Author(s) 2019.
World J Stem Cells. Feb 26, 2019; 11(2): 100-123
Published online Feb 26, 2019. doi: 10.4252/wjsc.v11.i2.100
Published online Feb 26, 2019. doi: 10.4252/wjsc.v11.i2.100
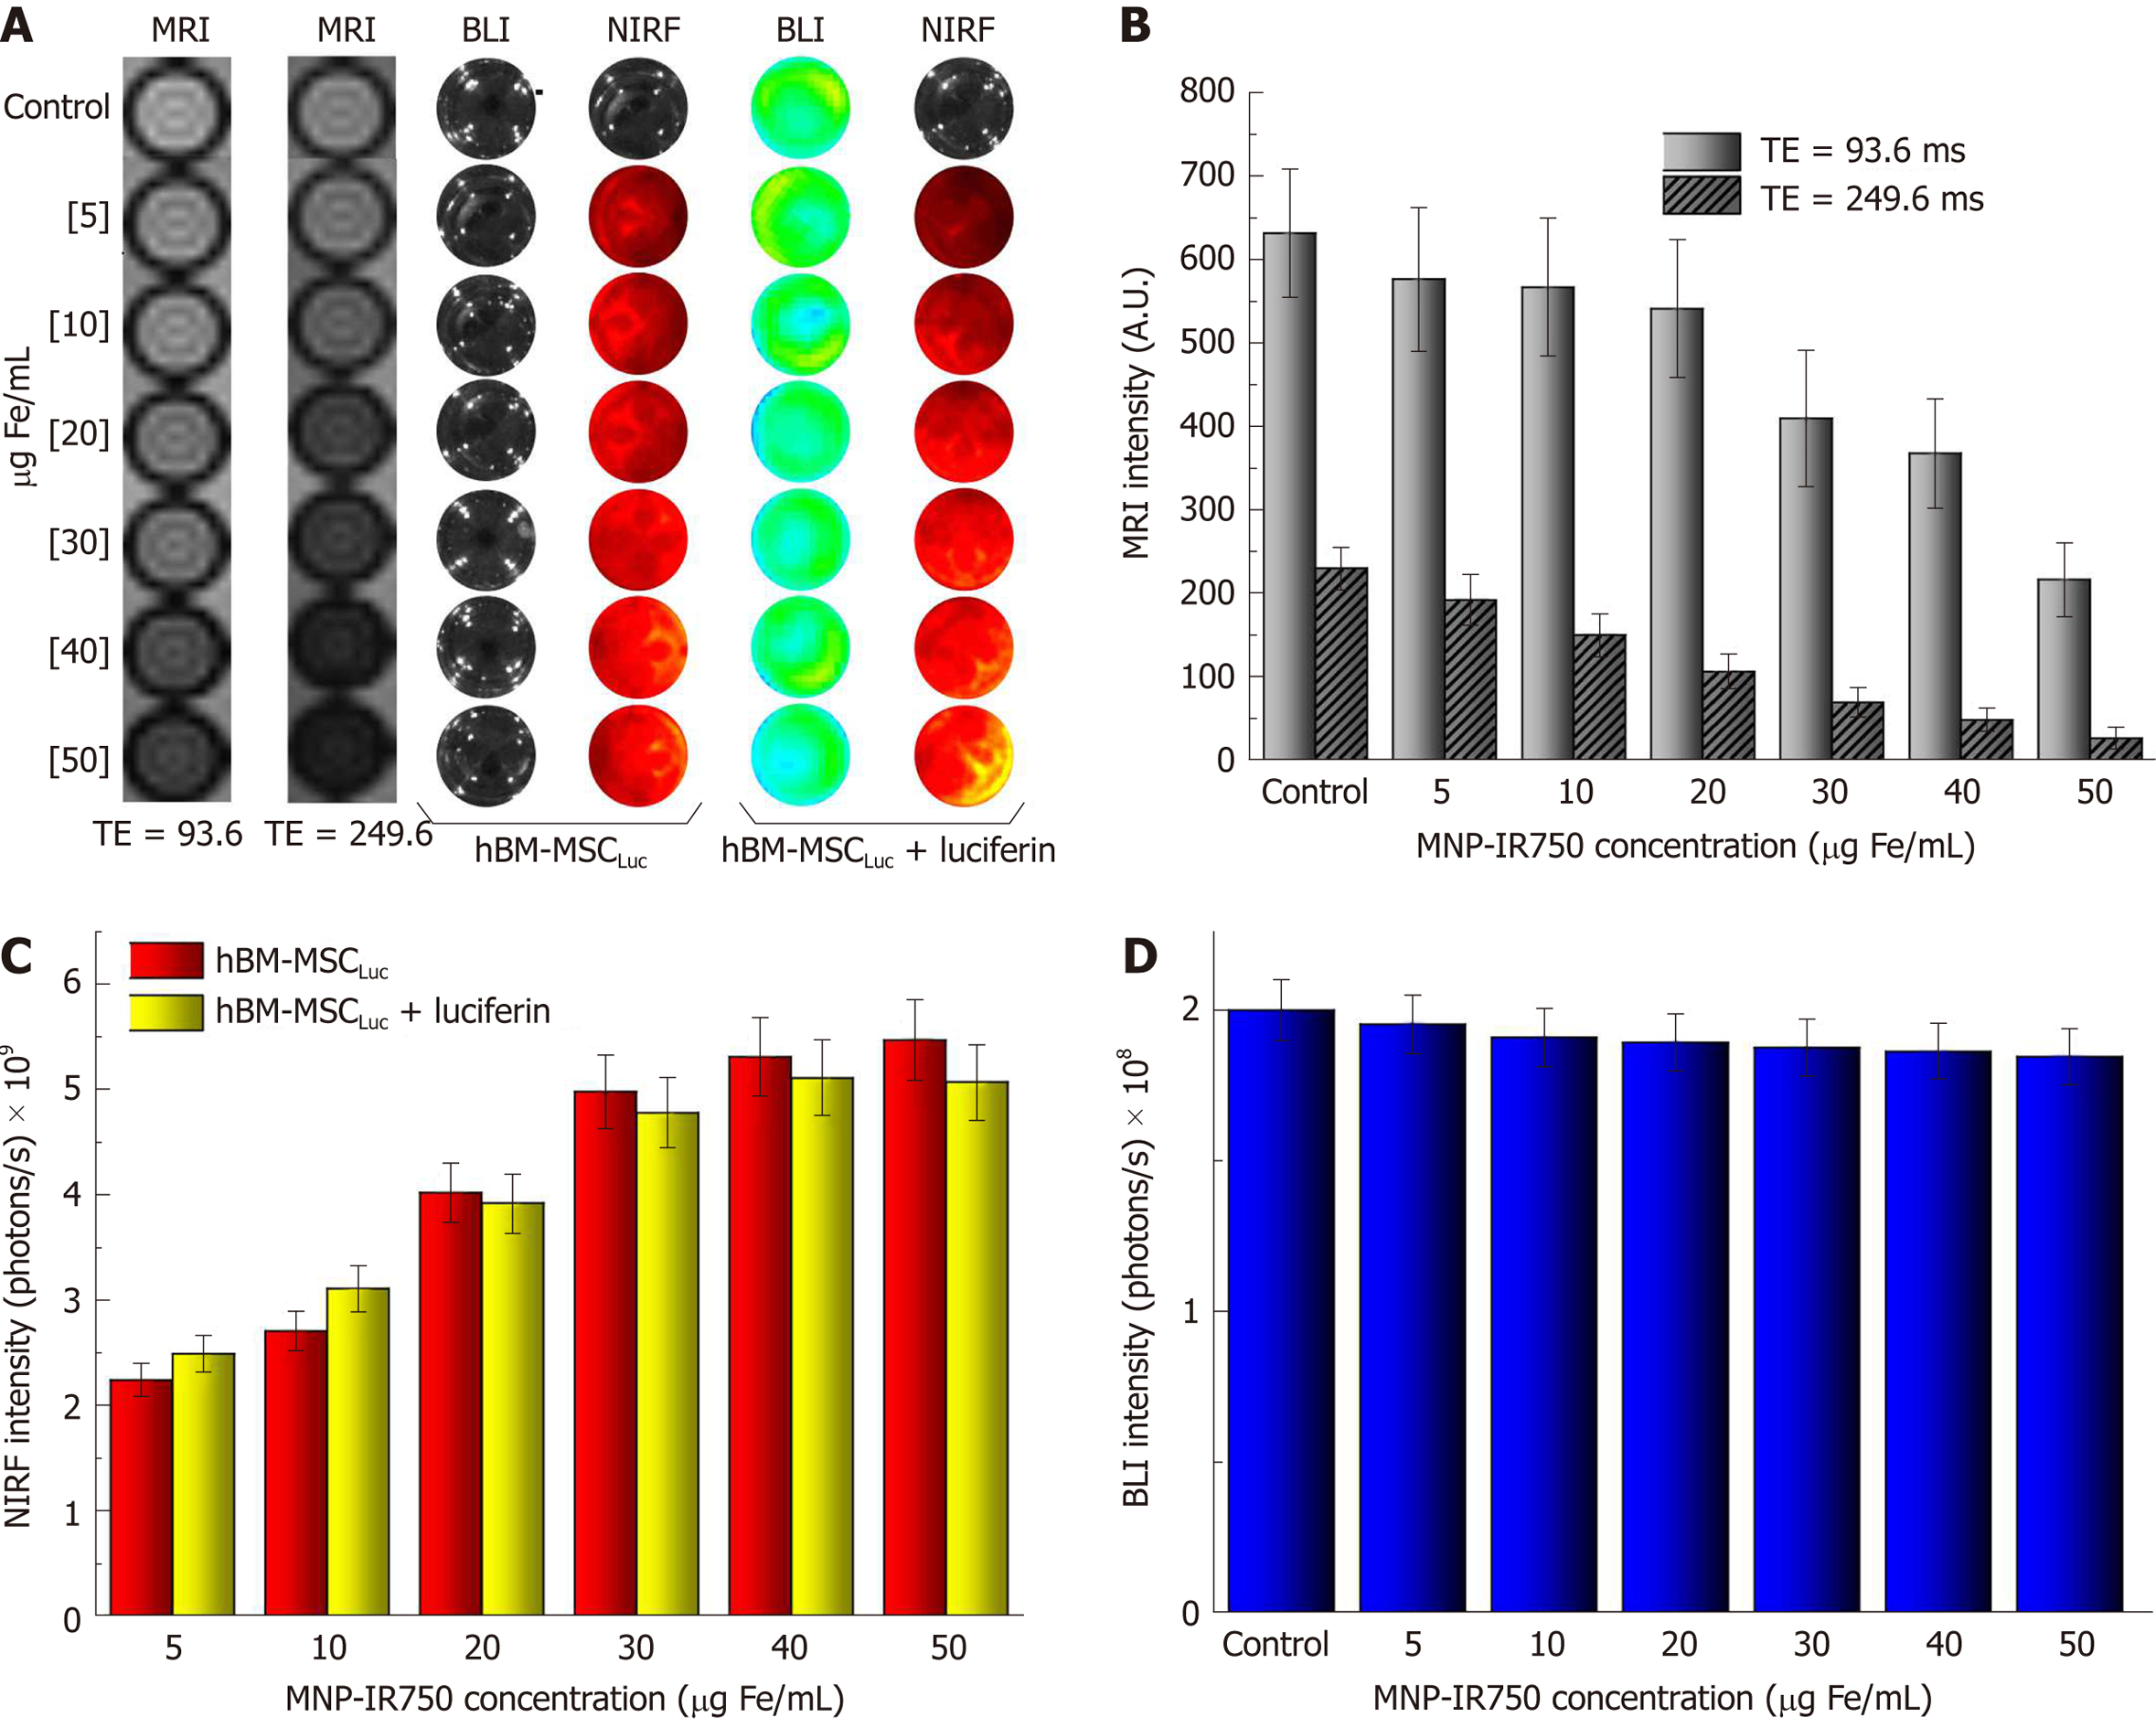
Figure 5 Evaluation of magnetic resonance imaging, near-infrared fluorescence and bioluminescent images intensity signals in vitro.
A: Images of hBM-MSCLuc phantoms, labeled with different concentrations of MNP-IR750, comparing short vs long TEs via MRI and before vs after the addition of luciferin via NIRF and BLI; B: Graphic representation of the MRI signal intensity of all samples acquired with a TE of 93.6 ms (light gray bars) and a TE of 249.6 ms (dark gray bars); C: Graphic representation of the NIRF signal intensity of all samples acquiring before luciferin addition (red bars) and after luciferin addition (yellow bars); D: Graphic representation of BLI signal intensity after luciferin addition in all samples with different concentrations of MNP-IR750. hBM-MSC: Human bone marrow mesenchymal stem cells; MNP: Multimodal nanoparticles; MRI: Magnetic resonance imaging; NIRF: Near-infrared fluorescence; BLI: Bioluminescent images.
- Citation: da Silva HR, Mamani JB, Nucci MP, Nucci LP, Kondo AT, Fantacini DMC, de Souza LEB, Picanço-Castro V, Covas DT, Kutner JM, de Oliveira FA, Hamerschlak N, Gamarra LF. Triple-modal imaging of stem-cells labeled with multimodal nanoparticles, applied in a stroke model. World J Stem Cells 2019; 11(2): 100-123
- URL: https://www.wjgnet.com/1948-0210/full/v11/i2/100.htm
- DOI: https://dx.doi.org/10.4252/wjsc.v11.i2.100


