Copyright
©The Author(s) 2018.
World J Stem Cells. Jan 26, 2018; 10(1): 1-14
Published online Jan 26, 2018. doi: 10.4252/wjsc.v10.i1.1
Published online Jan 26, 2018. doi: 10.4252/wjsc.v10.i1.1
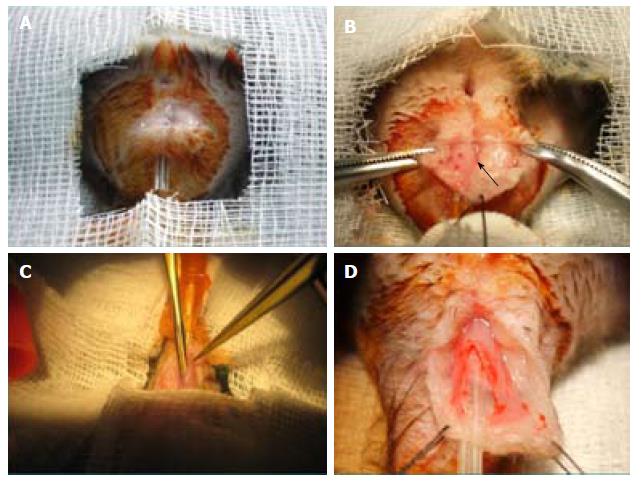
Figure 1 Sphincter anal injury model.
A: An arciform 10-mm to 15-mm anterior perianal incision (3 mm to 5 mm from the anal verge) was performed; B: Adipose tissue was dissected sideways to expose 20 mm of conduit until visualization of the thin, darker line of the external sphincter was achieved (arrow); C: An incision was made in the muscular layer until submucosa herniation, then submucosal dissection progressed in a longitudinal fashion, downward (until the anal verge or near the marking stitch) and upward (until 10 mm had been completed); D: Final aspect of sphincter section.
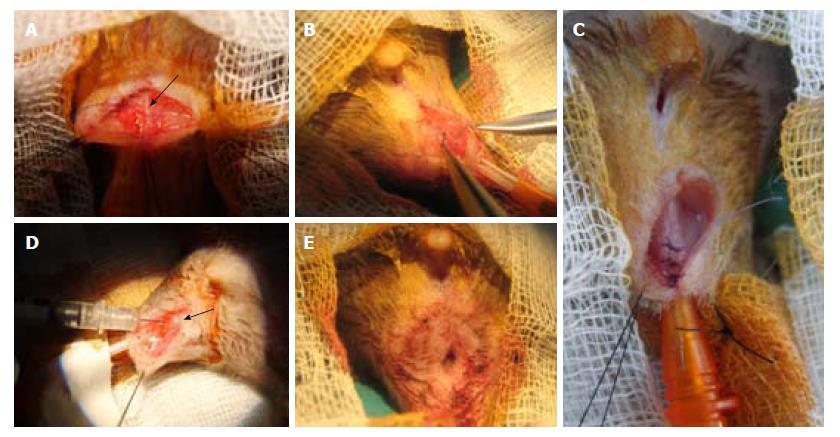
Figure 2 Sphincter repair and cell therapies.
A–C: If immediate sphincter repair was programmed, it was performed with 3 to 4 stitches of 6/0 interrupted suture; A: If biosuture was used, sometimes a bubble formed on the outer aspect of the muscle (arrow); D: If an injection was given, two injections on each side of the muscle incision were done; generally, bubble formation was observed; E: Finally, the incision was closed with 6/0 interrupted sutures, burying the knots in the depth. More details about surgical and cell therapy techniques are provided in the text.
Figure 3 Basal anal manometry.
A and B: Anal pressure data demonstrate spontaneous rhythmic contractions in the form of “plateaus”, with multiple peaks. At least 30 min were registered and a segment of 12 min with the highest stability was selected. For these tracings selections, we calculated the area-under-the-contraction waveforms vs time curve related to the registry baseline. In A, it is the area between the purple and the red lines. To detect minor changes, we selected the six best contractions; for each one of these we determined (B): total duration (D), time to peak (Tmax), pressure range (range, R), and number of peaks. A mean value of these variables was calculated in each registry.
Figure 4 Biosuture samples.
With the described protocol, cellular distribution over the suture was heterogeneous (A and B) and sutures were not fully covered; instead, there were “lumps” with clustered ASCs in the supernatant. After surgical use (C), some ASCs remained adhered and partially covering the suture, mainly in the proximal two-thirds of the suture. ASC: Adipose-derived stem cell.
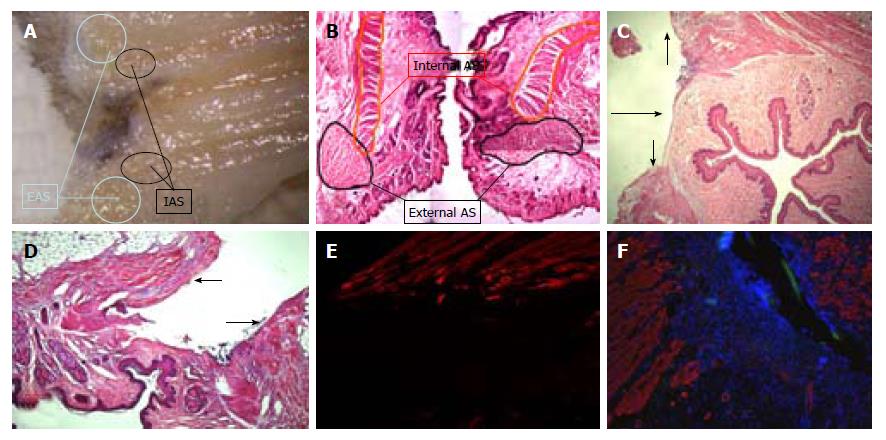
Figure 5 Anatomy and injury model study.
Sometimes it is difficult to identify the external anal sphincter (see Figure 2), but it is present and included in the section as can be seen in A: A sagittal section; or in B: Coronal hematoxylin and eosin reconstruction (10 ×). The described model implies section of internal anal sphincter (C: Hematoxylin and eosin 10 ×) and external anal sphincter (D: Hematoxylin and eosin 10 ×). This was also evidenced on immunofluorescence staining at 10 × (E belongs to a non-repaired rat and F to a biosuture group rat; suture strains can be seen with green autofluorescence). EAS: External anal sphincter; IAS: Internal anal sphincter; AS: Anal sphincter.
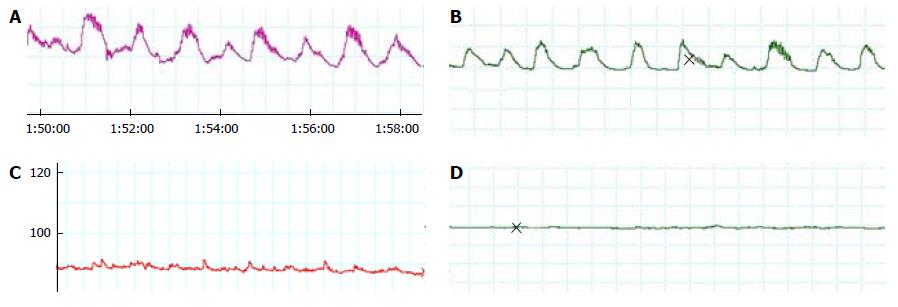
Figure 6 Functional studies (anal manometry).
A and B: Once the time for registry stabilization (30 to 60 min) was surpassed, spontaneous, rhythmic contractions in the form of “plateaus” with multiple fasciculations (peaks) appeared; C and D: Postoperatively, findings were consistent with a total sphincter lesion, the activity disappeared and was substituted by a gentle oscillation of basal line, without a recognizable pattern and irrespective of the applied treatment. To visualize the values of registries analyzed parameters see Table 1.
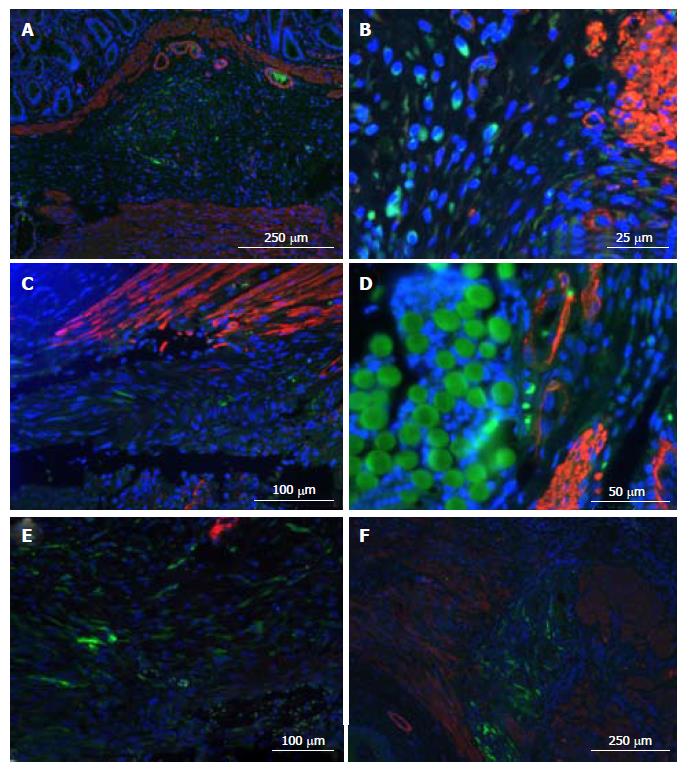
Figure 7 Immunolocalization of ASCs at surgical site.
Cell nuclei were stained with DAPI (blue), ASCs with eGFP (green), and muscle with α-actin (red). On injected animals, ASCs tended to form “conglomerates” in the submucosa and were able to survive at least 7 d (A: G1 group rat sacrificed at 7 d). ASCs appeared in injury foci, even though they were deposited at some distance (e.g., in “conglomerates”): In muscle section margins (B: G2 sacrificed at 7 d and C: G1 sacrificed at 1 d). In the biosuture group, ACSs also surround the suture (D: G2 sacrificed at 4 d). ASCs also appeared in the tissue that filled the space between muscle section margins (E: G3 group rat sacrificed at 4 d and F: G1 group rat sacrificed at 7 d). ASC: Adipose-derived stem cell; eGFP: Enhanced green fluorescent protein.
- Citation: Trébol J, Georgiev-Hristov T, Vega-Clemente L, García-Gómez I, Carabias-Orgaz A, García-Arranz M, García-Olmo D. Rat model of anal sphincter injury and two approaches for stem cell administration. World J Stem Cells 2018; 10(1): 1-14
- URL: https://www.wjgnet.com/1948-0210/full/v10/i1/1.htm
- DOI: https://dx.doi.org/10.4252/wjsc.v10.i1.1


