Published online Apr 15, 2003. doi: 10.3748/wjg.v9.i4.851
Revised: November 26, 2002
Accepted: December 3, 2002
Published online: April 15, 2003
AIM: To carry out a comparative study on ultrastructure and molecular biological changes of chronic gastritis (CG), gastric cancer (GC) aand gastric precancerous lesions.
METHODS: By the use of histochemical staining, SEM with EDAX, TEM with EDAX, image analysis technique, RIA and chemiluminescence method, gastric mucosa of 168 patients were synchronously analyzed in morphology, trace elements, DNA, cAMP, SOD, 3H-TdR LCT and serum LPO were also done.
RESULTS: The incidence of epithelial nucleoplasmic ratio > 1, lobulated nuclei, inter-chromatin aggregation of granules, nucleolar hypertrophy, and the content of DNA, Zn, Cu in nuclei and serum LPO of each group were showed as belows: normal control group (0.0, 0.0, 6.7, 0.0, 12.6 ± 2.7, 7.6 ± 0.4, 58.4 ± 0.3, 2.6 ± 0.6), CSG group (5.7, 2.9, 7.4, 2.9, 15.2 ± 3.1, 8.1 ± 0.5, 58.9 ± 0.5, 4.2 ± 0.7), CAG group (31.3, 29.7, 45.3, 42.2, 16.5 ± 3.1, 8.6 ± 0.4, 59.3 ± 0.5, 4.5 ± 0.6), CA group (100.0, 100.0, 72.2, 50.0, 30.7 ± 8.2, 8.8 ± 0.3, 59.5 ± 0.4, 6.8 ± 1.6), ATP++ group (61.5, 38.5, 23.1, 38.5, 23.5 ± 8.9, 8.3 ± 0.4, 59.1 ± 0.4, 5.1 ± 1.2), IM++ + ATP++ group (77.8, 55.5, 33.3, 44.4, 25.1 ± 7.2, 8.4 ± 0.5, 59.5 ± 0.4, 6.5 ± 1.1), IM+++ + ATP++ group (100.0, 100.0, 75.0, 62.5, 28.5 ± 9.1, 8.9 ± 0.5, 59.7 ± 0.4, 7.6 ± 0.7), IMIIb group (100.0, 62.5, 75.0, 50.0, 27.3 ± 10.3, 8.6 ± 0.3, 59.5 ± 0.4, 6.1 ± 0.9); whereas the content of Zn, Cu in mitochondria and cAMP, SOD in gastric mucosa, and 3H-TdR LCT of each group were showen as belows: normal control group (9.2 ± 0.5, 58.3 ± 0.3, 15.9 ± 1.5, 170.5 ± 6.1, 1079.7 ± 227.4), CSG group (8.6 ± 0.5, 57.8 ± 0.3, 14.6 ± 1.8, 163.3 ± 5.6, 867.3 ± 240.5), CAG group (8.3 ± 0.4, 57.5 ± 0.3, 13.4 ± 1.8, 161.2 ± 4.3, 800.9 ± 221.8), CA group (8.9 ± 0.4, 57.1 ± 0.3, 10.2 ± 3.9, 152.2 ± 3.8, 325.7 ± 186.8), ATP++ group (9.1 ± 0.4, 57.0 ± 0.3, 12.4 ± 1.8, 161.5 ± 3.8, 642.9 ± 174.3), IM++ + ATP++ group (8.6 ± 0.4, 56.9 ± 0.3, 12.0 ± 2.3, 152.2 ± 2.5, 326.3 ± 160.3), IM+++ + ATP++ group (8.5 ± 0.3, 56.8 ± 0.2, 10.4 ± 0.9, 147.4 ± 2.6, 316.1 ± 170.7), IMIIb group (8.6 ± 0.3, 56.9 ± 0.3, 11.9 ± 1.9, 150.0 ± 2.8, 318.9 ± 145.8), there were significant differences between groups (P < 0.05-0.01).
CONCLUSION: There was a significant difference between CG and GC in their ultrastructure and molecular biology. Only on the condition of changes of internal environment in combination with the harmful effect of external environment, chronic atrophic gastritis can then develop into gastric cancer. Hence it might have similar epithelial cell ultrastructure and molecular biological changes in ATP++, IMIIb and cancer, hence there were similar patterns of occurrence, development and transformation. Recognition of this trend might help to explore problems of prevention and cure.
- Citation: Yin GY, Zhang WN, Shen XJ, Chen Y, He XF. Ultrastructure and molecular biological changes of chronic gastritis, gastric cancer and gastric precancerous lesions: a comparative study. World J Gastroenterol 2003; 9(4): 851-857
- URL: https://www.wjgnet.com/1007-9327/full/v9/i4/851.htm
- DOI: https://dx.doi.org/10.3748/wjg.v9.i4.851
We conducted histochemical staining, detection of cAMP, SOD and DNA of gastric mucosa of 168 patients with chronic gastritis (CG) or gastric cancer (GC); SEM and TEM with EDAX were used to synchronously determine ultrastructures and trace elements and image analysis technique was used to determine nuclear DNA. 3H-TdR LCT and serum LPO were also cared out. Following was the comparative study.
168 patients definitely diagnosed as suffering from CSG, CAG and GC were our subjects of study. According to “The standards for the classification of chronic gastritis, for gastrofiberscopic diagnosis and for histopathological diagnosis of atrophic gastritis”, gastric mucosa tissue slices underwent HE staining and ABPH2.5/PAS, Hid/ABPH2.5 and HiD/ABPH2.5 histochemical staining. ATP was classified into low-grade, middle-grade and heavy-grade and IM into IM Ia, IM Ib, IM IIa, IM IIb. 68 cases were definitely diagnosed as CSG, including 43 males, 25 females, average age 43 years, average course of disease 4a, 26 cases without IM or ATP; 31 cases with concomitant or solitary IM-19 cases low-grade, 10 cases middle-grade and 2 cases heavy-grade; 9 cases with solitary ATP-8 cases low-grade, 1 case middle-grade; 2 cases with IM and concomitant ATP, IM and ATP were both middle-grade. 64 cases were definitely diagnosed as CAG, including 37 males, 27 females, average age 47 years average course of disease 6a, 3 cases without IM or ATP; 39 cases with concomitant solitary IM (17 cases low-grade, 4 cases middle-grade and 18 cases heavy-grade); 8 cases with solitary ATP (2 cases low-grade, 6 cases middle-grade.) 14 cases with IM concomitant ATP (12 cases middle-grade IM, 2 cases heavy-grade IM, 8 cases low-grade ATP, 6 cases middle-grade ATP). 36 cases were definitely diagnosed as GC, including 22 males, 14 females, average age 52 years, average course of disease, 2a, all with IM or ATP. 12 cases with solitary IM (6 cases low-grade, 3 cases middle-grade, 3 cases heavy-grade); 7 cases with solitary ATP (1 case low-grade, 6 cases middle-grade); 17 cases with IM concomitant ATP (5 cases middle-grade IM, 12 cases heavy-grade IM; 7 cases low-grade ATP, 9 cases middle-grade ATP, 1 case heavy-grade ATP). Of the 45 healthy volunteers who underwent gastroscopy and biopsy, 15 cases had basically normal gastric mucosa tissues, including 6 males 9 females, average age 37, and they were referred to as normal control (NC) group.
Under gastroscopy, three pieces of gastric mucosa were taken from the focal and nonfocal areas in antral region and body of stomach as specimens for section preparation, SEM, TEM, detection of DNA, cAMP and SOD. Blood was taken for 3H-TdRLCT and LPO. For the observation of gastric mucosa ultrastracture and determination of its trace elements[1-4], 501B SEM with 9100/60 EDAX was used to observe the three pieces of specimens of each patient, under the direct vision of SEM, the EDAX probe automatically detected the samples within 0.1-0.01 mm2 range all the elements under 12 in atomic number and automatically calculated the weight percentage (WT%) of each element in element series. 15 points were fixed in the three pieces of mucosa of every patient to carry out 15 detections, and the average WT% of each element was taken as its actual WT%. In every detection, 21 elements such as Na, Mg, Al, Si, P, S, K, Ca, Fe, Cu, Zn, Ti, Cr etc were detected, and weight percentage (WT%) of each element between elements of gastric mucosa was calculated.
By using EM430 TEM with 9100/60 EDAX, three pieces of mucosa specimens of every patient were magnified in unison by five magnifying powers (3600, 7200, 14000, 19000, 29000) to randomly take the pictures of the panoramagram, local area and organelle and to detect the atomic number percentage (AT%) of each nuclear and mitochondrial element between trace elements[5-10]. After gastric mucosa cell smear was stained by Feulgen staining, IBAS 2000 image analysis technique was adopted to detect IOD, which is taken as the relative content of nuclear DNA[7,8]. RIA was adopted to detect the content of gastric mucosa cAMP (Pmol/g); chemiluminescence method was adopted to detect the activity of SOD (u/g)[4]. 3H-TdRLCT. (Bq/L whole blood) was carried out; thiobarbituric acid development process was adopted to detect serum LPO (umol/L)[4].
χ2 and t test.
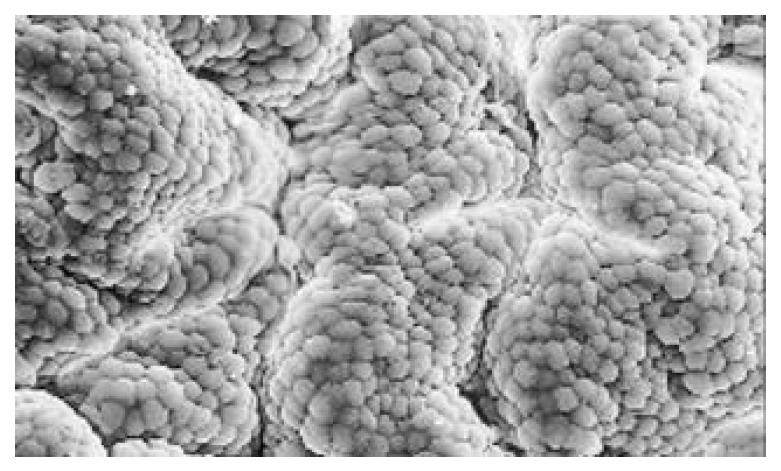
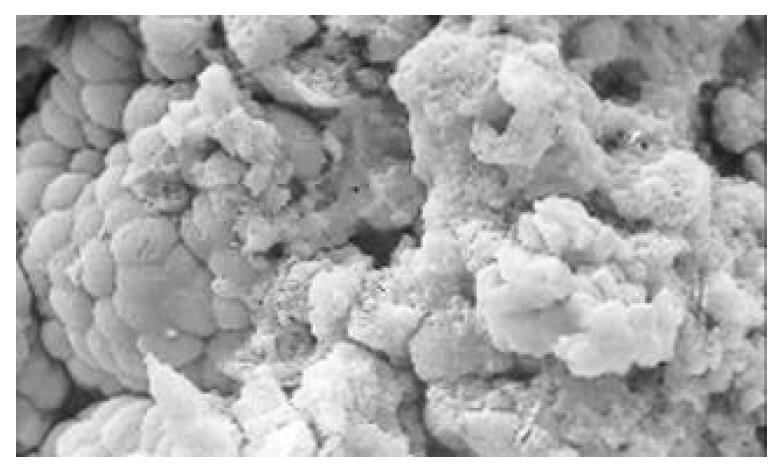
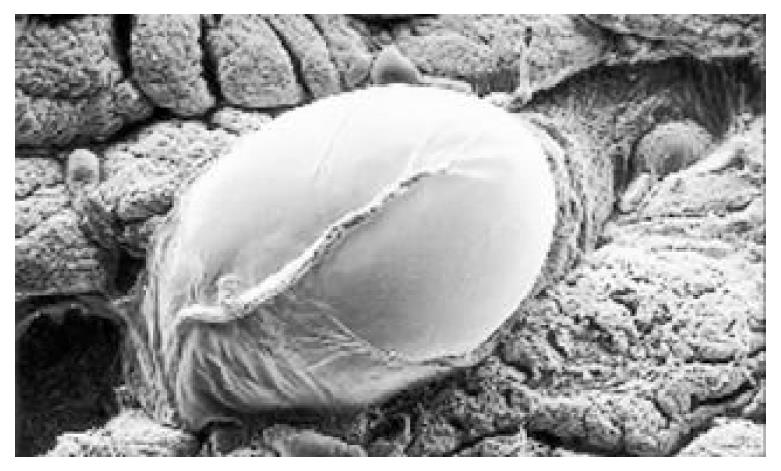
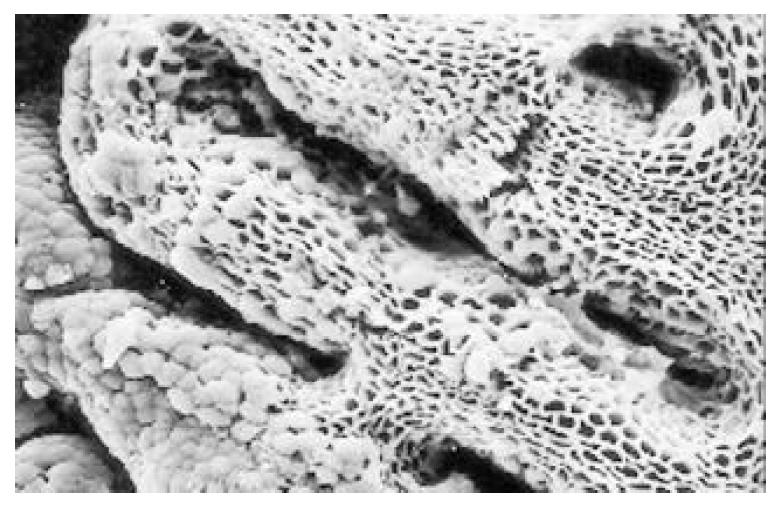
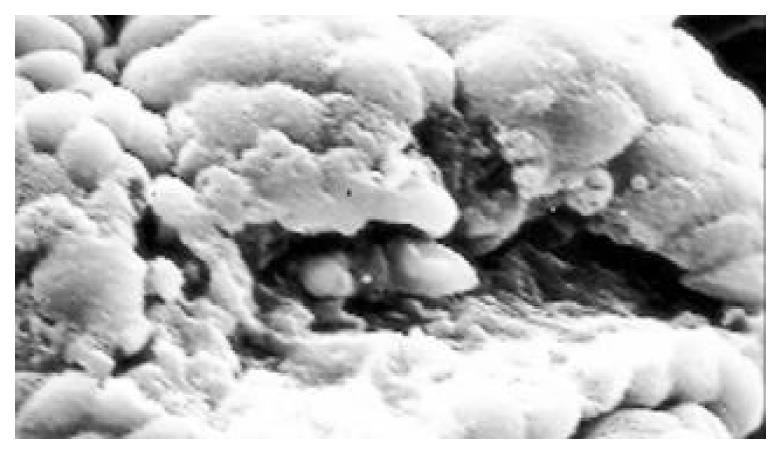
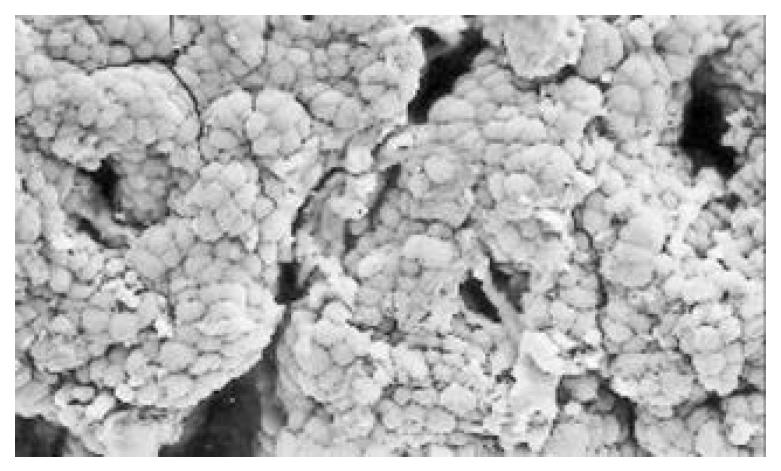
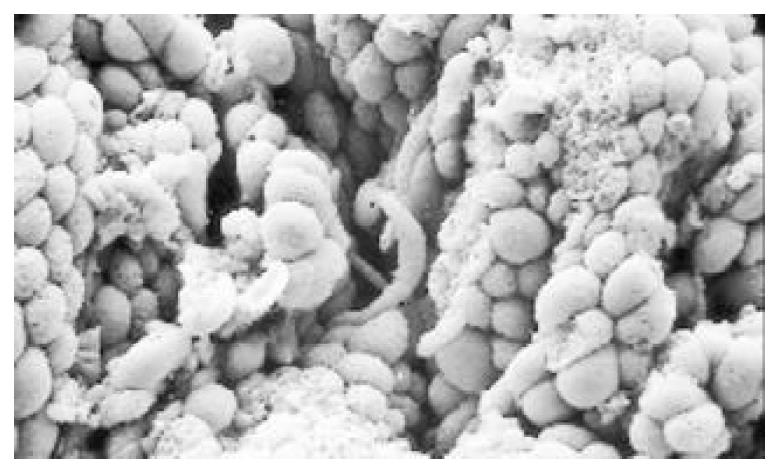
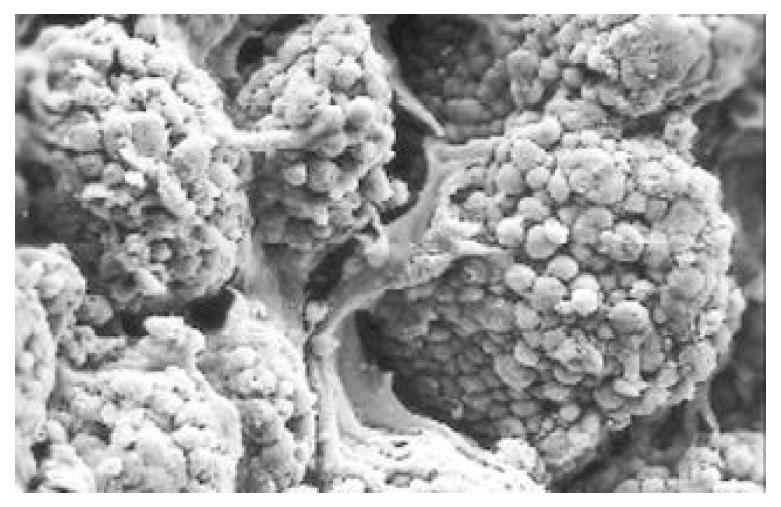
Between NC group. CSG group. CAG group and CA group, there were significant differences in the incidence rate and degree of different types of IM and ATP in glands propria of gastric mucosa (P < 0.05-0.001, Table 1). The surface of normal gastric mucosa was isolated by crisscross small groves into many lesser gastric areas, assuming convolution shape (Figure 1). In these areas, there were many gastric pits (the mouths of gastric glands), which were shaped like craters. The concave walls had round or oval epithelial cells of almost the same size. In CSG gastric mucosa there were scattered denatured, diabrotic and necrotic exfoliated epithelical cells, on whose surface S-shape Helicobacter pylori (HP) were found (Figure 2). Massive epithelial cells became diabrotic, anabrotic and exfoliated forming micro ulcers. The ulcers spred out from their centers, with adjacent cells crushed, destructed in irregular shapes and arrangement. In CSG gastric mucosa, cyst was found accidentally (Figure 3), the epithelial cells of crater walls were atrophic and denatured, of different sizes and deranged; the cells became diabrotic and necrotic and had inflammatory cell infiltration and the glands propria of the serious cases were shaped like grid framework structure (Figure 4). The surfaces of the epithelial calls of IM gastric mucosa were thickly coated, villi were invisible and the intercellular boundaries were not clear (Figure 5). SEM was not able to definitely indentify gastric mucosa ATP, but only able to distinguish whether cells were hyperplastic or not. Degeneration, hyperplasia or cellular regeneration occured in gastric mucosa. The hyperplastic cells are of different sizes and states and the active memberanes were shaped like lesser tubercles (Figure 6, Figure 7, Figure 8). The cells of gastric cancer were different sizes and shapes, deranged, characterized by obvious heteromorphic nature, conglobated and shaped like grapes or cauliflower. There were nearby or basal infiltration, destruction and ulceration of cancer cells, which have developed into ulcers.
| Groups | n | IM classification | Grading of ATP | |||||||||
| Ia | Ib | IIa | IIb | ATP+ | ATP++ | IM++ + ATP+ | IM++ + ATP++ | IM+++ + ATP+ | IM+++ + ATP++ | IM+++ + ATP+++ | ||
| NC | 15 | 2 (13.3) | 1 (6.7) | |||||||||
| CSG | 68 | 16 (23.5) | 8 (11.8) | 6 (8.8) | 3 (4.4) | 8 (11.8) | 1 (1.5) | 2 (2.9) | ||||
| CAG | 64 | 16 (25.0)b | 11 (17.2)b | 13 (20.3)d | 13 (20.3)d | 2 (3.1)d | 6 (9.4)d | 7 (10.9) | 5 (7.8)c | 1 (1.5) | 1 (1.6) | |
| CA | 36 | 4 (11.1) | 9 (25.0)c | 16 (44.4)df | 1 (2.8)d | 6 (16.7)d | 3 (8.3) | 2 (5.6)c | 4 (11.1)f | 7 (19.4) f | 1 (2.8) | |
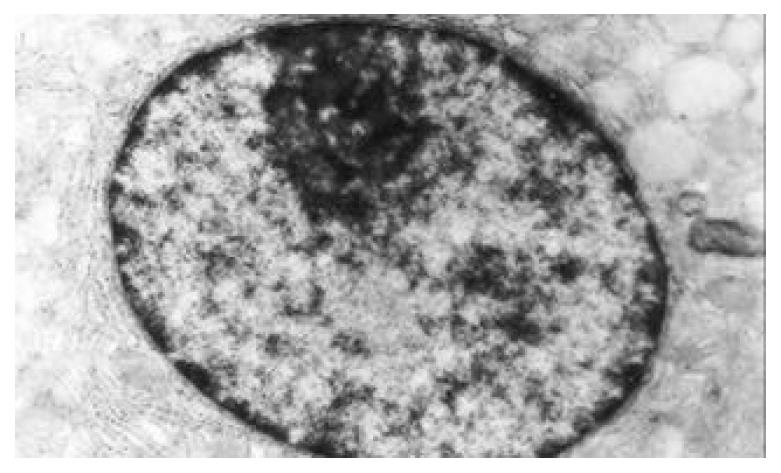
The mucous cells on epithelial cell surface of relatively normal gastric mucosa were columna epithelial cells covering endogastric surfaces and inside wall of gastric pit. Their free surfaces had short micro villi; the mucous neck cells were distributed over the necks of gastric glands, and on the tops of these cells were a few short thick micro villi. Chief cells were distributed over the bodies and bottoms of gastric glands; parietal cells were big and conic and their conical tops turned towards gland cavities; the endocrine cells lied between chief cells and parietal cells and they were small, and their nuclei are round or oval, the nuclei envelopes are slightly bent, lobulated nuclei were few, the nucleocyotoplasmic ratio was less than 1.
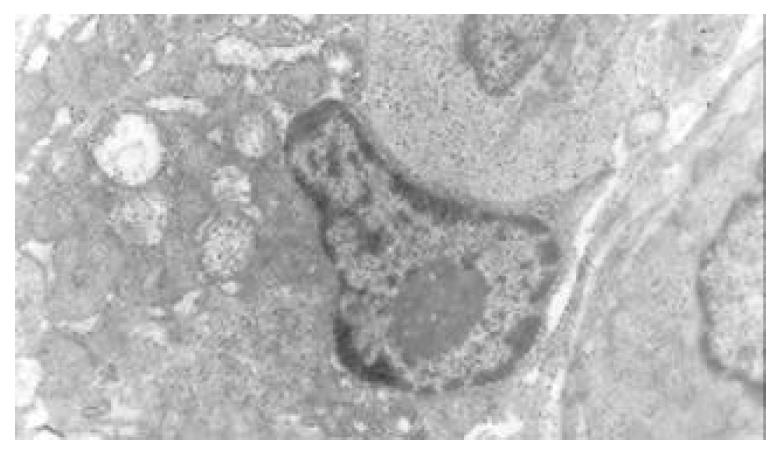
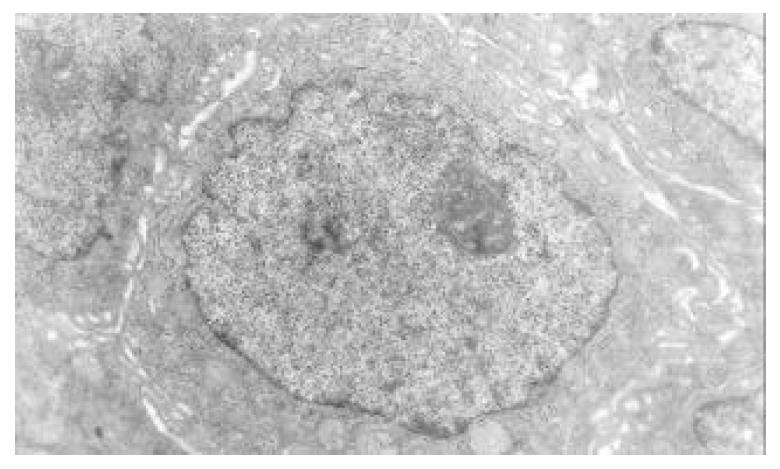
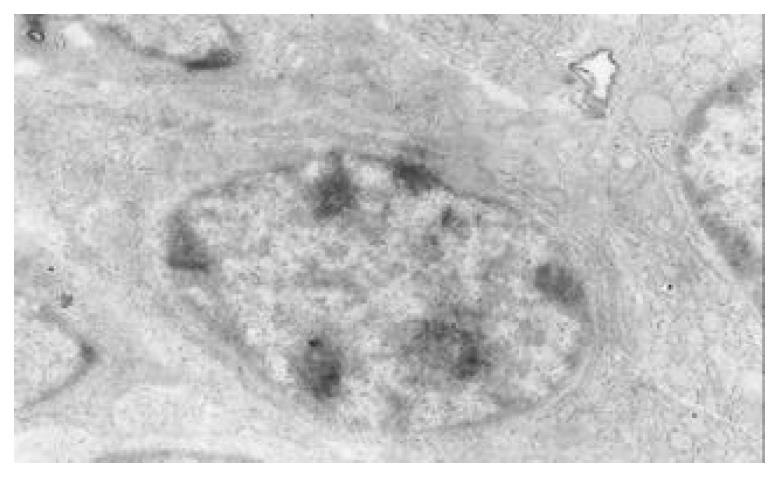
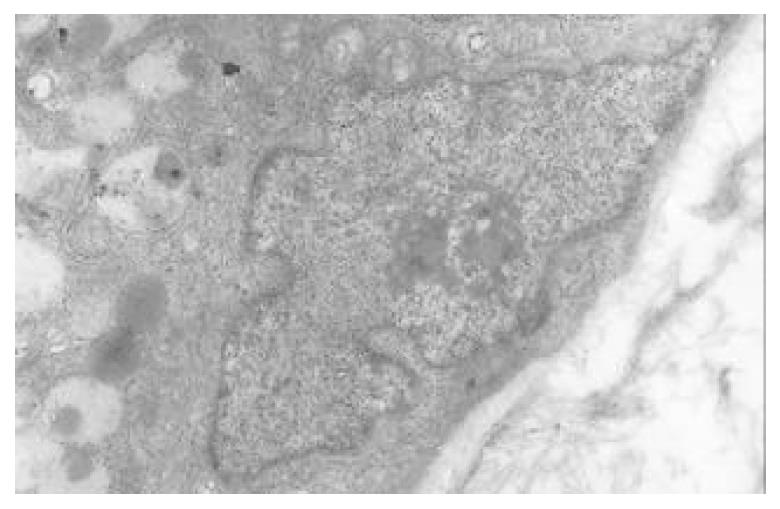
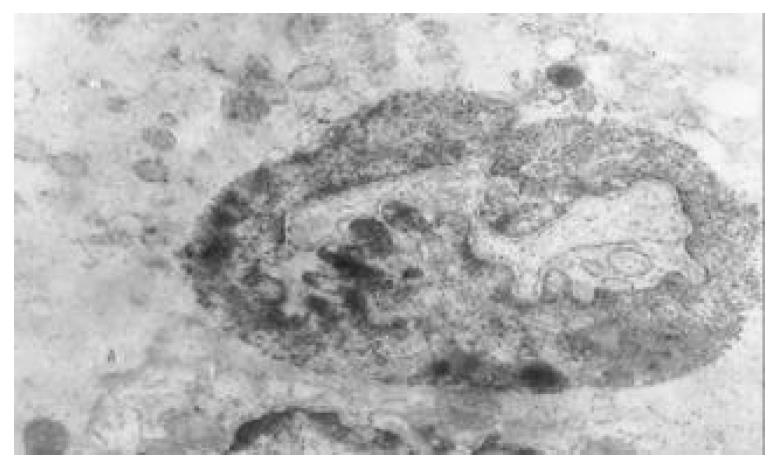
The nuclear chromatins were scattered, or associated with nucleoli or along nuclear perimeters. The light bright zones between heterochromatins in the nucleoli are euchromatins; the nucleoli had high electron density without capsule. Mitochondria were round or oval, scattering around nuclei. The mitochondria consisted of outer membrane, inner membrane, outer ventricle, inner ventricle and cristae. Crista, the inward folded inner membrane, was a hollow canal leading to outer ventricle. Some mitochondrial cristae directly led to cytoplasms. Cristae were generally in tabular arrangement, parallel to each other and vertical to mitochondrial long axes. In cytoplasms were many parallel rough surfaced endoplasmic reticuluas (RERs), secretory granules, well-developed Golgi’s bodies and scattered mitochondria. The free surfaces of epithelial cells of CG gastric mucosa had dropped micro villi; the intercellular space expanded and cell conjuctions decreased; the karyoplasmic ratio of both ill-differentiated epithelial cells and IM cells was greater than 1, and lobulated nuclei increased; nucleolar granules became thick and nucleoli expanded with irregular margins (Figure 9).
There occured nucleolar margination (Figure 10), multinucleoli (Figure 11) and nucleolar division (Figure 12). The obsolescent epithelial nuclei shrank and the karyoplasmic ratio was still less; the heterochromatins lied densely around nuclei; the electron density was low in the center of nuclei and nuclei were loop in shape. (referred to as chromatin margination); the shrunk nuclei were denticular, in which the electron density was moderately homogeneous and chromatins were not found (referred to as chromatin homogenization). There were mitochondrial swelling, hypertrophy, pyknosis, hyaline degeneration as well as vacuolar degeneration. The deformed mitochrondrias were in C-shape or U-shape. There were zigzag, longitudinal, sparse and pyknosis cristae, and deranged cristas. There was an decrease in the number of mitochondrias and their cristae. There were mitochondrial decreases in number, mitochondrial swelling, or crista fragmentation, vacuolar degeneration, and RERs in circular arrangement; the Golgi’s bodies become atrophic and had lost their typical structures; the cytoplasmic incretory granules decreased. There were still greater epithelial cell changes in cancer cells of gastric cancer than in cells of gastric mucosa of chronic gastritis, intranuclear inclusion appeared (Figure 13). There was an increase in peri-chromatinic and interchromatinic granular densification (Figure 14). In euchromatins; there was a significant difference between CSG group and CAG group in nucleolar margination and nucleolar looping (P < 0.05-0.001, Table 2, Table 3); between IM IIb group, ATP++ group, IM++ + ATP++ group and IM+++ + ATP++ group, compared with NC group, CSG group and CAG group, the difference was also significant (P < 0.05-0.001, Table 2, Table 3). There is no significant difference between IM+++ + ATP++ group, IM IIb group and CA group (P > 0.05, Table 2, Table 3).
| Group | n | Appearce | Chromatin | Nucleons | |||
| Nucleoplasmic ratio > 1 | Nucleus lobulated | Margination or homogeneity | Perinuclcar concentrated | Hypertrophy or margination | looping | ||
| NC | 15 | 1 (6.7) | 1 (6.7) | ||||
| CSG | 68 | 5 (5.7) | 2 (2.9) | 7 (10.3) | 5 (7.4) | 2 (2.9) | 2 ( 2.9) |
| CAG | 64 | 20 (1.3)d | 19 (9.7)d | 33 (51.6)bd | 29 (45.3)bd | 27 (42.2)d | 14 (21.9) |
| CA | 36 | 36 (00.0)bf | 36 (00.0)bf | 17 (47.2)d | 26 (72.2)bdf | 18 (50.0)d | 17 (47.2)df |
| IMIIb | 8 | 8 (100.0)b | 5 (62.5) h | 5 (62.5)b | 6 (75.0)b | 4 (50.0) | 3 (37.5) |
| ATP++ | 13 | 8 (61.5)hi | 5 (38.5)hj | 4 (30.8)bgj | 3 (23.1)bhj | 5 (38.5) | 1 (7.7)hj |
| IM++ + ATP++ | 9 | 7 (77.8)hhik | 5 (55.5)hk | 3 (33.3)bgj | 3 (33.3)bhj | 4 (44.4) | 3 (33.3)l |
| IM+++ + ATP++ | 8 | 8 (100.0)ln | 8 (100.0)jkm | 5 (62.5)bkm | 6 (75.0)blm | 5 (62.5) lm | 3 (37.5)l |
| Group | n | Number | Swelling or Ovegrowth (%) | Matrix fading (%) | Vacuolar degeneration (%) | Pyknosis (%) | Crista number | Fragmentation and derangement of cristas (%) |
| NC | 15 | 86.5 ± 27.3 | 3.4 ± 1.6 | 3.0 ± 1.1 | 2.9 ± 1.9 | 1.1 ± 0.8 | 12.8 ± 3.2 | 2.2 ± 1.1 |
| CSG | 68 | 65.4 ± 21.1b | 7.2 ± 3.8b | 7.8 ± 5.0b | 6.4 ± 4.5b | 1.9 ± 0.9b | 8.2 ± 3.2b | 5.8 ± 3.1b |
| CAG | 64 | 52.2 ± 20.8bd | 10.9 ± 4.5bd | 11.7 ± 8.6bd | 11.6 ± 7.7bd | 3.7 ± 1.1bd | 6.9 ± 3.5bc | 8.9 ± 3.7bd |
| CA | 36 | 38.8 ± 31.5bde | 12.9 ± 4.2bde | 15.6 ± 5.4bdf | 14.6 ± 5.8bde | 3.9 ± 0.6bd | 8.1 ± 1.9bde | 10.5 ± 2.7bde |
| IMIIb | 8 | 36.8 ± 30.8b | 13.8 ± 3.2b | 14.1 ± 4.3b | 12.5 ± 3.9b | 3.3 ± 0.8bg | 9.3 ± 2.1b | 7.6 ± 1.1bh |
| ATP++ | 13 | 49.1 ± 27.9b | 11.3 ± 2.9b | 8.3 ± 3.5bh | 9.3 ± 4.7b | 1.9 ± 0.5bhj | 11.3 ± 1.8hi | 5.2 ± 1.2bhj |
| IM++ + ATP++ | 9 | 41.3 ± 30.8b | 12.8 ± 2.1b | 12.1 ± 2.8bg | 11.2 ± 3.7b | 2.3 ± 0.3bhjk | 11.0 ± 1.5ahi | 6.2 ± 1.3bhi |
| IM+++ + ATP++ | 8 | 35.4 ± 31.5b | 13.3 ± 4.3b | 15.2 ± 5.3bl | 12.8 ± 4.3b | 3.9 ± 0.5bbln | 8.4 ± 2.1bln | 8.6 ± 1.0bhln |
The content of nuclear Zn and Cu increased progressively in the sequence of NC group, CSG group, CAG group and CA group; the content of mitochondrial Zn and Cu decreased progressively in the same sequence. There was significant differences between these groups (P < 0.05-0.001, Table 4). The content of Zn, Cu, cAMP and SOD in gastric mucosa decreased progressively in the same sequence; the content of DNA increased progressively in the above sequence. There were significant differences between these groups (P < 0.05-0.001, Table 5). The content of 3H-TdRLCT decreased in the sequence of NC group, CSG group, CAG group and CA group; content of serum LPO increased in the same sequence; there was significant difference between these groups (P < 0.05-0.001, Table 6). Between IM IIb group, ATP++ group, IM++ + ATP++ group and IM+++ + ATP++ group, NC group, CSG group and CAG group, there was also significant difference (P < 0.05-0.001, Table 4, Table 5, Table 6). Between IM+++ + ATP++ group, IM IIb group and CA group, There was no significant difference (P > 0.05, Table 4, Table 5, Table 6).
| Group | n | Nuclear | Mitochondria | ||
| Zn (AT%) | Cu (AT%) | Zn (AT%) | Cu (AT%) | ||
| NC | 15 | 7.6 ± 0.4 | 58.4 ± 0.3 | 9.2 ± 0.5 | 58.3 ± 0.3 |
| CSG | 68 | 8.1 ± 0.5b | 58.9 ± 0.5b | 8.6 ± 0.5b | 57.8 ± 0.3b |
| CAG | 64 | 8.6 ± 0.4bd | 59.3 ± 0.5bd | 8.3 ± 0.4bd | 57.5 ± 0.3bd |
| CA | 36 | 8.8 ± 0.3bde | 59.5 ± 0.4bde | 8.9 ± 0.4bde | 57.1 ± 0.3bde |
| IMIIb | 8 | 8.6 ± 0.3b | 59.5 ± 0.4b | 8.6 ± 0.3b | 56.9 ± 0.3b |
| ATP++ | 13 | 8.3 ± 0.4bhi | 59.1 ± 0.4bhi | 9.1 ± 0.4i | 57.0 ± 0.3b |
| IM++ + ATP++ | 9 | 8.4 ± 0.5bg | 59.5 ± 0.4bk | 8.6 ± 0.4bl | 56.9 ± 0.3b |
| IM+++ +ATP++ | 8 | 8.9 ± 0.5bl | 59.7 ± 0.4b | 8.5 ± 0.3bgl | 56.8 ± 0.2bh |
| Group | n | Zn (WT%) | Cu (WT%) | DNA (IOD) | cAMP (pmol/g) | SOD (u/g) |
| NC | 15 | 4.1 ± 1.0 | 5.2 ± 0.8 | 12.6 ± 2.7 | 15.9 ± 1.5 | 170.5 ± 6.1 |
| CSG | 68 | 2.8 ± 1.9b | 4.0 ± 1.5a | 15.2 ± 3.1b | 14.6 ± 1.8b | 163.3 ± 5.6b |
| CAG | 64 | 2.0 ± 1.8bc | 3.4 ± 1.5bd | 16.5 ± 3.1bc | 13.4 ± 1.8bc | 161.2 ± 4.3bc |
| CA | 36 | 1.5 ± 1.2bde | 2.8 ± 0.9bde | 30.7 ± 8.2bdf | 10.2 ± 3.9bdf | 152.2 ± 3.8bdf |
| IMIIb | 8 | 1.7 ± 0.9b | 3.5 ± 0.9b | 27.3 ± 10.3b | 11.9 ± 1.9b | 150.0 ± 2.8b |
| TP++ | 13 | 2.7 ± 1.3bhi | 4.4 ± 0.9ahi | 23.5 ± 8.9bg | 12.4 ± 1.8bg | 161.5 ± 3.8aj |
| IM++ + ATP++ | 9 | 2.3 ± 1.5b | 4.1 ± 0.9bh | 25.1 ± 7.2b | 12.0 ± 2.3b | 152.2 ± 2.5bl |
| IM+++ + ATP++ | 8 | 1.5 ± 0.8bkm | 2.9 ± 0.8bhin | 28.5 ± 9.1b | 10.4 ± 0.8bil | 147.4 ± 2.6bhln |
| Group | n | LPO (umol/L) | 3H-TdRLCT (Bq/L) |
| NC | 15 | 2.6 ± 0.6 | 1079.7 ± 227.4 |
| CSG | 68 | 4.2 ± 0.7b | 867.3 ± 240.5b |
| CAG | 64 | 4.5 ± 0.6bc | 800.9 ± 221.8bc |
| CA | 36 | 6.8 ± 1.6bdf | 325.7 ± 186.8bdf |
| IMIIb | 8 | 6.1 ± 0.9b | 318.9 ± 145.8b |
| ATP++ | 13 | 5.1 ± 1.2bhi | 642.9 ± 174.3bhj |
| IM++ + ATP++ | 9 | 6.5 ± 1.1b | 326.3 ± 160.6bk |
| IM+++ + ATP++ | 8 | 7.6 ± 0.7bgjlm | 316.1 ± 170.7bl |
Chronic gastritis, CAG in particular, is generally acknowledged as precancer ous state. However, not all CAGs are likely to develop into gastric cancer because there is significant difference between chronic gastritis and gastric cancer in the ultrastructure and molecular biology of gastric mucosa. In the grading and classification of IM, grading of ATP of gastric mucosa, incidence rate of epithelial karyoplasmic ratio > 1, incidence rate of perichromatinic granular densification and of nucleolar hypertrophy, the number of mitochondria and cristae as well as the incidence rate of mitochondrial deqeneration; as well as in the quantitative changes of nuclear DNA, Zn, Cu, cAMP, SOD and serum LPO and 3H-TdRLCT, there were significant differences between NC group, CSG group, CAG group, CA group, IM IIb group, ATP++ group, IM++ + ATP++ group and IM+++ + ATP++ group (P < 0.05-0.0001); There was no significant difference between IM+++ + ATP++ group, IM IIb group and CA group (P > 0.05). There are similar epithelial ultrastructures and molecular biochemical changes in ATP++, IM IIb and CA. Consequently they should have similar law of occurrence, development and transformation, which might contribute to the exploration of prevention and treatment of the disease.
Clinically, only a few chronic gastritis patients’ gastric mucosa epithelial cells are likely to develop into cancer cells, but it is essential that there should be a process which causes genetic variation of cells, the key of which is the quantitative changes of epithelial nuclear DNA. The DNA molecular is coded with nucleotide sequence fragments of special genetic codes, every fragment is a functional group, referred to as gene. The gene order has great stability. Only when intracellular cAMP declines, cytodifferentiation is disturbed.The metabolism of Zn, Cu in the body is disturbed, which in turn disturbs the enzyme system and inhibits the synthesis and activity of SOD; because of the NADPH oxidation reduction circulation and the catalytic function of xanthine oxidase, a great deal of oxygen free radicals are produced far beyond the cleaning ability of SOD. The excessive accumulated oxygen free radicals react in lipid peroxidation with unsaturated fatty acid of inner and outer membranes of mitochondria, producing LPO. Thus level of serum LPO rises. The inner and outer membranes of mitochondria are destructed, causing decrease and derangement of mitochondrial cristae, mitochondrial degeneration decrease of adenosine triphosphate production, and inadequate energy supply of gastric mucosa epithelial cells. When nuclei take up more Zn and Cu, the protein synthesis is enhaneed nuclear division and hyperplasia are accelerated; through influencing lymphocyte metabolism, the quantitative changes of Zn and cAMP in turn inhibit lymphocyte transformation and result in the decline of 3H-TdRLCT level and immunity of the organism. The above changes of intraorganism environment, only if stimulated by certain external causes such as ionizaing radiation, chemical injuries, infection S-shape HP and virus, are likely to cause the change of sequences in gene group, which is referred to as gene mutation; and genetic codes change accordingly, the changed codes are transferred to heterogenous cell descendants, causing cellular differentiation disturbance and even cancerous change. Human body is an integrity organism, in which the components of tissue and cell, and the bioactive substances including trace elements, enzymes, hormones, immunity and messenger substances exist with a definite content and a definite quantitative ratio. It’s important to measure the “absolute” content of each bioactive substance, but it’s more important to measure quantitative ratio of each bioactive substance because it can explain the trends and laws of variation of the whole body and inner circumstance[9,10]. These ratios in normal body keep in a state of dynamic balance within a definite range. If this balance is broken, pathological phenomena and functional disturbance will arise. The ratio fluctuation of bioactive substances higher or lower than normal value, can lead to a series of ratio variation, and then cause both a definite disease diagnosed by modern medicine and clinical expression of Chinese medical syndrome (a synthesis of symptoms without peculiarity). The composite nature of Chinese medicine treats disease through adjusting the above mentioned pathological ratio is one of it’s therapeutic mechanisms. This is why Chinese medicines have multilevel, multitarget, two-way adjusting effects on human body, and how the medicines regulate pathological ratio. It’s a slow process for Chinese medicines to regulate pathological ratio, so It’s therapeutic effect is slow too. Measuring the “quantitative ratio” of a series of bioactive substances not only will be the research direction of medical science and biological science, but also the research kernel of the basic theory of traditional Chinese medicine[11-13].
Edited by Xu JY
| 1. | Yin GY, Zhang WN, He XF, Chen Y, Shen XJ. Detection of ultra-structural changes and contents DNA, Zn, Cu and LPO in sub-groups of chronic gastritis. Shijie Huaren Xiaohua Zazhi. 2002;10:663-667. |
| 2. | Yin GY, Zhang WN, Shen XJ, Chen Y, He XF. Ultrastructural and molecular diological changes of chronic gastritis and gastric cancer: a comparative study. Shijie Huaren Xiaohua Zazhi. 2002;10:668-672. |
| 3. | Yin GY, Zhang WN, He XF, Chen Y, Shen XJ. Alterations of ultrastructures, trace elements, cAMP and cytoimmunity in sub-groups of chronic gastritis. Shijie Huaren Xiaohua Zazhi. 2002;10:673-676. |
| 4. | Yin GY, Zhang WN, He XF, Chen Y, Yin YF, Shen XJ. Histocytepathological study on gastric mucosa of spleen deficiency syndromes. Zhongguo Zhongxiyi Jiehe Zazhi. 1999;19:660-663. |
| 5. | Yin GY, Xu FC, Zhang WN, Li GC, He XF, Chen Y, Shen XJ. The effect of weikangfu on cytopathology of gastric mucosa tissue when treating gastric precancerosis lesion of patients with spleen deficiency syndromes. Zhongguo Zhongxiyi Jiehe Zazhi. 2000;6:241-243. |
| 6. | Yin GY, Zhang WN, Xu FC, He XF, Chen Y, Shen XJ. Effect of Weikangfu chongji on ultrastructure of precancerosis gastric mucosa of patients with spleen deficiency Syndromes. Zhongguo Zhongxiyi Jiehe Zazhi. 2000;20:667-670. |
| 7. | Yin GY, Zhang WN, Xu FC, Chen Y, He XF, Li GC, Shen XJ. Study on the modern pathophysiologic basis of the syndrome classification of spleen deficiency with chronic gastritis and of (treatment) verification of clinical syndromes and prescriptions. Jiangsu Yiyao Zazhi. 2001;27:46-47. |
| 8. | Yin GY, He XF, Yin YF, Du YQ, Jiao JH. Study on mitochondrial ultrastructure, trace elements and correlative factors of gastric mucosa in patients with spleen deficiency syndrome. Zhongguo Zhongxiyi Jiehe Zazhi. 1996;15:719-723. |
| 9. | Yin GY, Zhang WN, Xu FC, He XF, Chen Y, Shen XJ. Effect of weikangfu chongji on epithelial cellular ultrastructure of precancerotic gastric mucosa of patients with spleen deficiency syndrome. Jiangsu Yiyao Zazhi. 2000;26:514-517. |
| 10. | Yin GY, Zhang WN, Xu FC, He XF, Chen Y, Li GC, Shen XJ. Effect of weikangfu on Zn, Cu and DNA in precancerosis gastric mucosa epithelial nuclei and mitochondria of patients with spleen deficiency syndromes. Zhongguo Zhongxiyi Jiehe Zazhi. 2000;8:221-224. |
| 11. | Yin GY, Zhang WN, Shen XJ, Chen Y, He XF. Ultrastructure and molecular biological changes of chronic gastritis, gastric cancer and gastric precancerous lesions: a comparative study. World J Gastroenterol. 2003;9:851-857. [PubMed] |
| 12. | Yin GY, He XF, Zhang WN, Chen Y. Relationship between the classification of spleen deficiency and the quantitative changes of bio-active substances in mitochondria of gastric mucosa epithelical cell nuclei. Zhongguo Zhongxiyi Jiehe Zazhi. 1999;7:145-148. |
| 13. | Yin GY, Zhang WN, Li GC, Huang JR, Chen Y, He XF, Shen XJ. Therapeutic effect of weikangfu on gastric precancerosis disordddeer with spleen deficiency syndrome and its effect of gastric mucosal zinc, copper, cyclic adenosine monophosphate, superoxide dismutase,lipid peroxide and 3H-TdR lymphocyte conversion test. Zhongguo Zhongxiyi Jiehe Zazhi. 2000;20:176-179. |


