Published online Apr 15, 2003. doi: 10.3748/wjg.v9.i4.804
Revised: July 18, 2002
Accepted: July 25, 2002
Published online: April 15, 2003
AIM: To propose a simple and effective method suitable for analyzing the angle and distribution of 2-dimensional collagen fiber in larger sample of small intestine and to investigate the relationship between the angles of collagen fiber and the pressure it undergoes.
METHODS: A kind of 2-dimensional visible quantitative analyzing technique was described. Digital image-processing method was utilized to determine the angle of collagen fiber in parenchyma according to the changes of area analyzed and further to investigate quantitatively the distribution of collagen fiber. A series of intestinal slice’s images preprocessed by polarized light were obtained with electron microscope, and they were processed to unify each pixel. The approximate angles between collagen fibers were obtained via analyzing the images and their corresponding polarized light. The relationship between the angles of collagen fiber and the pressure it undergoes were statistically summarized.
RESULTS: The angle of collagen fiber in intestinal tissue was obtained with the quantitative analyzing method of calculating the ratio of different pixels. For the same slice, with polarized light angle’s variation, the corresponding ratio of different pixels was also changed; for slices under different pressures, the biggest ratio of collagen fiber area was changed either.
CONCLUSION: This study suggests that the application of stress on the intestinal tissue will change the angle and content of collagen fiber. The method of calculating ratios of different pixel values to estimate collagen fiber angle was practical and reliable. The quantitative analysis used in the present study allows a larger area of soft tissue to be analyzed with relatively low cost and simple equipment.
- Citation: Zeng YJ, Qiao AK, Yu JD, Zhao JB, Liao DH, Xu XH, Hans G. Collagen fiber angle in the submucosa of small intestine and its application in gastroenterology. World J Gastroenterol 2003; 9(4): 804-807
- URL: https://www.wjgnet.com/1007-9327/full/v9/i4/804.htm
- DOI: https://dx.doi.org/10.3748/wjg.v9.i4.804
Several G.I. diseases can change the collagen fiber structure in the G.I. tract[1-4]. The collagen fiber content and its distribution outside the cell are closely related to some diseases. For example, systemic sclerosis (scleroderma) will replace smooth muscle and deposit large amounts of collagen instead. Gastrointestinal sclerdema is a common clinical disorder; however, due to its complicated etiology, most of them are not easily diagnosed and all the patients with such disease manifested distinct collagen fiber transformations. Early collagen fiber transformations are swelling and homogenization and then become thickened, sclerosed and arranged in a close order[5-9]. Collagen synthesis is increased especially the ratio of fine collagen fibers; at the same time, the smooth muscle fiber bundles become homogeneous, sclerosed and atrophic. There are changes occurred in the orientation of collagen fibers[10-13]. Obstructive diseases could also change the collagen structure and content[14-16]. In normal tissue the submucosal layer consist almost entirely of collagen, which is called the skeleton of the small intestine, and it is well known that the fibers run in a cross-cross pattern with 30 degrees angle in longitudinal direction[17-20]. The directional distribution of collagen fibers has a very important role in studying the function and self-repair of soft tissue[21].
The application of digital image-processing technology in medicine field has offered an accurate, simple, convenient and rapid method for the measurement and analysis of large amounts of medical images, especially for the quantitative analysis of smaller pictures, such as microscopic images. At the present time, the techniques for the quantitatively analyzing the distribution of collagen fibers consist mainly of several kinds as follows: that is, the method of quantitatively polarized light microscopy, small angle beam dispersion, image analysis and X-ray diffraction. These methods will sometimes be constrained by the image size, time cost or image connecting, and 90o orientation of template etc[23].
The purpose of this paper is to propose a method suitable for analyzing the angle and distribution of 2-dimensional collagen fiber in larger sample and to investigate the relationship between the angles of collagen fiber and the pressure it undergoes. At the same time, this paper also offers an effective method for research of the large area collagen fiber distribution.
Seven Sprague-Dawley (250-300 g body wt) rats were used in this sdudy. They were fasted but free access to water for 24 hours before experiment. Approval of the protocol was obtained from the Danish Animal Experiment Committee. After animal was euthanized by cervical dislocation, its abdomen was opened and the small intestine was separated from the adjacent organs. An 18-cm-long segment from the middle part of small intestine was cut and excised within 2 min, then transferred to an organ bath containing oxygenated Krebs-Ringer-bicarbonate solution at pH7.4 with 6% Dextran and 2 mL EGTA.
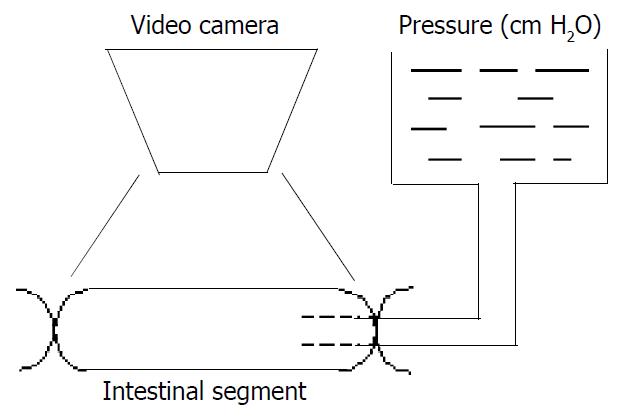
The specimen was further cut into six 3-cm-long segments. One of the six segments served as control and was fixed in 4% formalin in no-load condition. The 5 segments left had one end ligated while the other end was connected via a tube to a fluid container for application of different pressures, which were 2, 5, 10, 15 and 20 cm H2O respectively. Before we pressurized the intestinal segments, we placed some microbeads on surface of the middle part of the segments. Then the outlet was clamped to maintain the volume. After applying pressure for 3 minutes, a record of the whole intestine segment and the part with dots was obtained using video-camera (SONY CCD/RGB, JAPAN) to monitor the whole process (refer to Figure 1) performed under room temperature.
After the specimen was fixed in 4% formalin for 24 hours, 1.0 cm long and 0.5 cm long transverse sections were taken from the middle part of specimen and dehydrated in a series of graded ethanol (70%, 90%, 95% and 100%) and embedded in paraffin respectively. 5 µm serial slices were cut and stained with picrosirius red for collagen analysis and HE (hemotoxylin and eosin) for general histological observation[22-26].
A series of polarized images of intestine slice was acquired by the recorder through microscope at every δ degree angle, and then stored in computer through image collecting card with TIFF format (RGB system type). The TIFF format, a very popular in use currently to reflect the details of the slice images distinctly, and the pixel values in the polarized images are suitable for the principles presented previously very well[27-29]. Therefore we took the TIFF form to verify the method’s feasibility and practicality.
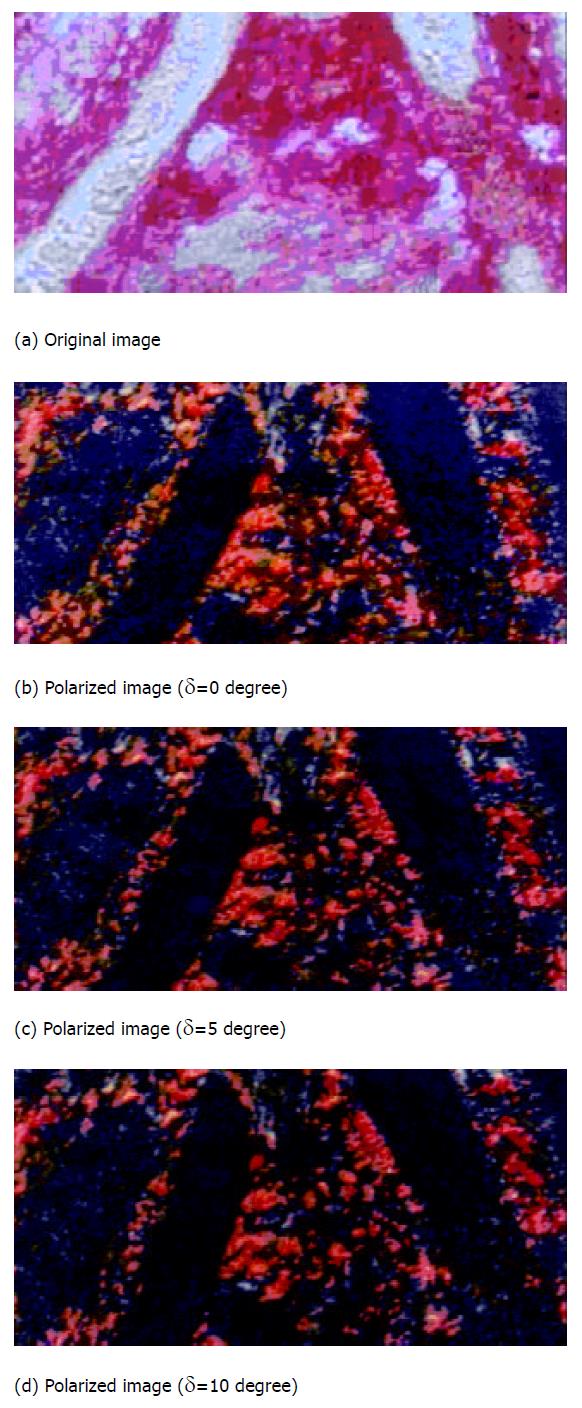
In polarized light microscope, polarized light is delivered onto the sample to be analyzed and handled after being passed through two filter glasses. When the angle between optical axis of the two polarizing lens is 0 degree (that is, both of the two optical axis are parallel to the muscle direction), the blackest image area will be the part where the collagen fiber angle is 90 or 0 degree to the optical axis. Such an image area is also the part where the pixel values are minimum. Therefore, through image analysis we can find out all the area where the collagen fibers are parallel to muscle direction and thereby figure out the area ratio between the study area and the entire analysis Area (abcd). In the slice image analysis, the collagen fiber manifested as some pink striation (f) and the muscle fiber (e) some buff[4] (refer to Figure 2).
Rotating the polarizing eyepiece while maintaining the objective lens and the experiment sample stable can make muscle fiber direction coincide with the optical axis of polarizing objective. When the polarizing eyepiece is rotated δ degree, all the areas where the collagen fiber are δ degree or 90 + δ degree with the muscle fiber will present in the blackest part[21], in this way, their ratio to the entire analyzing area can be figured out as well.
Accordingly, we can obtain the relationship between the angle and its area ratio to the entire area. Since the collagen fiber distribution is uniform, that is, reticular in shape, its longitude and latitude lines are +30 degree and -30 degree to the muscle fiber direction. The area ratio for which is therefore the biggest, we can utilize the area ratio to reckon the collagen fiber angle.
The image processing is the key part of the research, which is eventually based on the analysis of every image’s pixels, namely, first to normalize the pixel value and then to use proper algorithms to obtain results. When all the data are summed up, the distribution relationship of collagen fibers can be obtained reversely through the regression curve.
Since the scope of the images recorded is so large that there can include a great deal of muscle tissue and other unrelated background (Figure 2), which should be removed by the image filter before the analysis. The area selected for analysis should be done on the original image before it was polarized.
In this study, the background noises were excluded directly with a frequency domain strengthening method because both of the edge and noise in the image correspond to the high frequency section of the image’s Fourier transformation, we could weaken this part of the frequency to lessen its influence in the frequency domain[30-33].
For the purpose of saving much more information of each pixel, the matrix was unified. Take matrix F (m, n) as the basis for further processing, the data less than the chosen threshold value were considered as the collagen fiber area in the polarized image. Figure out the pixel’s number that was less than the chosen threshold value s (j)[34,35]. And made: b (j) = s (j)/(m×n); b (j) was equal to the area ratio of collagen fiber and the chosen observed area in polarized image j. From this we got series of the ratio sequence, which were stored into array Y (j).
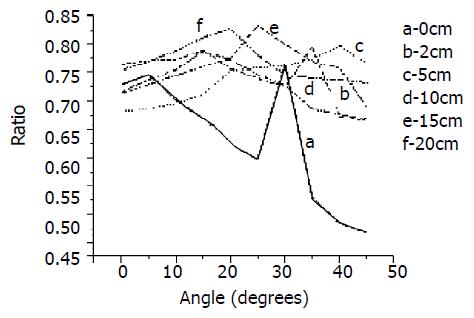
According to the steps mentioned above, the calculation results were shown in Table 1, where the first column listed the pressures the tissue were received and the first row was the polarized light angles being rotated. We found that for the same slice, with polarized light angle’s variation, its corresponding area ratio is not identical; for each tissue under different pressures, its biggest area ratio is not identical either. To obtain the smooth curve showing the relationship between the angle and the corresponding ratio, we made a nonlinear normality on the sample data[36], the abscissa of the curve was δ’s integer multiple and the ordinate the series value in array Y (i) (Figure 3).
| δ | 0o | 5o | 10o | 15o | 20o | 25o | 30o | 35o | 40o | 45o |
| H2O | ||||||||||
| 0 cm | .7288 | .7465 | .7016 | .6694 | .6238 | .5978 | .7666* | .5290 | .4852 | .4669 |
| 2 cm | .7649 | .7713 | .7732 | .7890 | .7576 | .7399 | .7245 | .7956* | .6730 | .6654 |
| 5 cm | .6817 | .6874 | .6959 | .7118 | .7535 | .7591 | .7632 | .7744 | .7976* | .7664 |
| 10 cm | .7162 | .7375 | .7563 | .7877* | .7730 | .7469 | .7272 | .6866 | .6764 | .6684 |
| 15 cm | .7139 | .7285 | .7455 | .7611 | .7760 | .8337* | .8000 | .7693 | .7580 | .6873 |
| 20 cm | .7548 | .7700 | .7885 | .8125 | .8270* | .7807 | .7457 | .7400 | .7372 | .7320 |
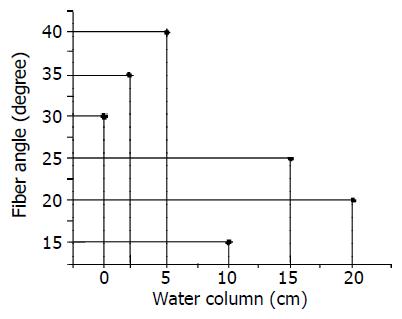
The relationship between pressures tissue received and their corresponding fiber angle was shown in Figure 4.
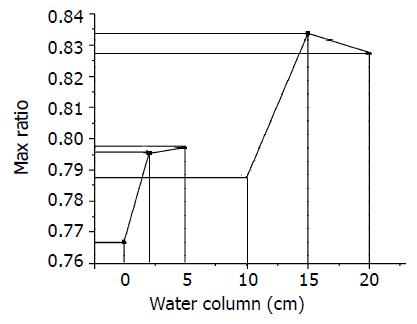
The relationship between pressures tissue received and their corresponding biggest ratio was shown in Figure 5.
We tested other intestinal slice’s images (of the same animal) and found that their properties above were similar by and large.
From the data in Table 1, we found that in the same tissue sample there exist obvious alterations in the collagen area ratio as the angles of polarized light changed; In different slice’s images with different pressures, its biggest ratio was also not identical (Figure 4), and the biggest value was fairly obvious. However, it can not be determined whether the magnitude of collagen fiber angle and the fiber content are all in direct proportion with the pressure that the intestines received (Figure 4, Figure 5), because this depends some degree on the way how it receives the pressure. Using other methods to change its stress still needs to be tested in future experiments. The method of calculating ratios of different pixel values to estimate collagen fiber angle has its feasibility and reliability, which allows a larger area of soft tissue being analyzed with relatively low cost and simple equipment. The disadvantage of this method is the difficulty in determining an appropriate threshold value as well as a definite scope suitable for analyzing which have very important influence on the study results. At the same time, the less δ is to be selected, the more accurate the angle will be.
This paper has tried to acquire the collagen fiber angle of soft tissue in intestine slice through introducing a quantitative analysis method for calculating different pixel values whose validity is verified with computer program, and suggested a practical and effective method for basic research on G.I. disease.
Edited by Zhu L
| 1. | Sacks MS, Gloeckner DC. Quantification of the fiber architecture and biaxial mechanical behavior of porcine intestinal submucosa. J Biomed Mater Res. 1999;46:1-10. [RCA] [PubMed] [DOI] [Full Text] [Cited by in RCA: 1] [Reference Citation Analysis (0)] |
| 2. | Clarke KM, Lantz GC, Salisbury SK, Badylak SF, Hiles MC, Voytik SL. Intestine submucosa and polypropylene mesh for abdominal wall repair in dogs. J Surg Res. 1996;60:107-114. [RCA] [PubMed] [DOI] [Full Text] [Cited by in Crossref: 207] [Cited by in RCA: 189] [Article Influence: 6.5] [Reference Citation Analysis (0)] |
| 3. | Badylak SF, Lantz GC, Coffey A, Geddes LA. Small intestinal submucosa as a large diameter vascular graft in the dog. J Surg Res. 1989;47:74-80. [RCA] [PubMed] [DOI] [Full Text] [Cited by in Crossref: 464] [Cited by in RCA: 420] [Article Influence: 11.7] [Reference Citation Analysis (0)] |
| 4. | Fackler K, Klein L, Hiltner A. Polarizing light microscopy of intestine and its relationship to mechanical behaviour. J Microsc. 1981;124:305-311. [RCA] [PubMed] [DOI] [Full Text] [Cited by in Crossref: 32] [Cited by in RCA: 25] [Article Influence: 0.6] [Reference Citation Analysis (0)] |
| 5. | Klein L, Eichelberger H, Mirian M, Hiltner A. Ultrastructural properties of collagen fibrils in rat intestine. Connect Tissue Res. 1983;12:71-78. [RCA] [PubMed] [DOI] [Full Text] [Cited by in Crossref: 13] [Cited by in RCA: 13] [Article Influence: 0.3] [Reference Citation Analysis (0)] |
| 6. | Gabella G. The cross-ply arrangement of collagen fibres in the submucosa of the mammalian small intestine. Cell Tissue Res. 1987;248:491-497. [RCA] [PubMed] [DOI] [Full Text] [Cited by in Crossref: 44] [Cited by in RCA: 42] [Article Influence: 1.1] [Reference Citation Analysis (0)] |
| 7. | Doering CW, Jalil JE, Janicki JS, Pick R, Aghili S, Abrahams C, Weber KT. Collagen network remodelling and diastolic stiffness of the rat left ventricle with pressure overload hypertrophy. Cardiovasc Res. 1988;22:686-695. [RCA] [PubMed] [DOI] [Full Text] [Cited by in Crossref: 177] [Cited by in RCA: 166] [Article Influence: 4.5] [Reference Citation Analysis (0)] |
| 8. | Whittaker P, Boughner DR, Kloner RA. Role of collagen in acute myocardial infarct expansion. Circulation. 1991;84:2123-2134. [RCA] [PubMed] [DOI] [Full Text] [Cited by in Crossref: 134] [Cited by in RCA: 120] [Article Influence: 3.5] [Reference Citation Analysis (0)] |
| 9. | Yao YL, Xu B, Zhang WD, Song YG. Gastrin, somatostatin, and experimental disturbance of the gastrointestinal tract in rats. World J Gastroenterol. 2001;7:399-402. [PubMed] |
| 10. | Jalil JE, Janicki JS, Pick R, Abrahams C, Weber KT. Fibrosis-induced reduction of endomyocardium in the rat after isoproterenol treatment. Circ Res. 1989;65:258-264. [RCA] [PubMed] [DOI] [Full Text] [Cited by in Crossref: 46] [Cited by in RCA: 43] [Article Influence: 1.2] [Reference Citation Analysis (0)] |
| 11. | Jørgensen CS, Assentoft JE, Knauss D, Gregersen H, Briggs GA. Small intestine wall distribution of elastic stiffness measured with 500 MHz scanning acoustic microscopy. Ann Biomed Eng. 2001;29:1059-1063. [RCA] [PubMed] [DOI] [Full Text] [Cited by in Crossref: 16] [Cited by in RCA: 16] [Article Influence: 0.7] [Reference Citation Analysis (0)] |
| 12. | Eghbali M, Eghbali M, Robinson TF, Seifter S, Blumenfeld OO. Collagen accumulation in heart ventricles as a function of growth and aging. Cardiovasc Res. 1989;23:723-729. [RCA] [PubMed] [DOI] [Full Text] [Cited by in Crossref: 127] [Cited by in RCA: 123] [Article Influence: 3.4] [Reference Citation Analysis (0)] |
| 13. | Zou XP, Liu F, Lei YX, Li ZS. Change and role of β-endorphine in plasma and gastric mucosa during the development of rat gas-tric stress ulceration. Shanghai Shengwu Yixue Gongcheng. 2001;22:3-5. |
| 14. | Jiang Z, Li H, Liu B, Teng Z, Qing K. [Biomechanical properties of arteries in experimental hypotensive rats]. Shengwu Yixue Gongchengxue Zazhi. 2001;18:381-384. [PubMed] |
| 15. | Wang Z, Chen JD. Blind separation of slow waves and spikes from gastrointestinal myoelectrical recordings. IEEE Trans Inf Technol Biomed. 2001;5:133-137. [RCA] [PubMed] [DOI] [Full Text] [Cited by in Crossref: 26] [Cited by in RCA: 20] [Article Influence: 0.8] [Reference Citation Analysis (0)] |
| 16. | Cui JH, Krueger U, Henne-Bruns D, Kremer B, Kalthoff H. Orthotopic transplantation model of human gastrointestinal cancer and detection of micrometastases. World J Gastroenterol. 2001;7:381-386. [PubMed] |
| 17. | Xia J, Ip HH, Samman N, Wong HT, Gateno J, Wang D, Yeung RW, Kot CS, Tideman H. Three-dimensional virtual-reality surgical planning and soft-tissue prediction for orthognathic surgery. IEEE Trans Inf Technol Biomed. 2001;5:97-107. [RCA] [PubMed] [DOI] [Full Text] [Cited by in Crossref: 71] [Cited by in RCA: 61] [Article Influence: 2.5] [Reference Citation Analysis (0)] |
| 18. | Zhao J, Sha H, Zhou S, Tong X, Zhuang FY, Gregersen H. Remodelling of zero-stress state of small intestine in streptozotocin-induced diabetic rats. Effect of gliclazide. Dig Liver Dis. 2002;34:707-716. [PubMed] |
| 19. | Orberg JW, Klein L, Hiltner A. Scanning electron microscopy of collagen fibers in intestine. Connect Tissue Res. 1982;9:187-193. [RCA] [PubMed] [DOI] [Full Text] [Cited by in Crossref: 54] [Cited by in RCA: 47] [Article Influence: 1.1] [Reference Citation Analysis (0)] |
| 20. | Orberg J, Baer E, Hiltner A. Organization of collagen fibers in the intestine. Connect Tissue Res. 1983;11:285-297. [RCA] [PubMed] [DOI] [Full Text] [Cited by in Crossref: 47] [Cited by in RCA: 38] [Article Influence: 0.9] [Reference Citation Analysis (0)] |
| 21. | Komuro T. The lattice arrangement of the collagen fibres in the submucosa of the rat small intestine: scanning electron microscopy. Cell Tissue Res. 1988;251:117-121. [RCA] [PubMed] [DOI] [Full Text] [Cited by in Crossref: 27] [Cited by in RCA: 26] [Article Influence: 0.7] [Reference Citation Analysis (0)] |
| 22. | Gabella G. The collagen fibrils in the collapsed and the chronically stretched intestinal wall. J Ultrastruct Res. 1983;85:127-138. [RCA] [PubMed] [DOI] [Full Text] [Cited by in Crossref: 11] [Cited by in RCA: 11] [Article Influence: 0.3] [Reference Citation Analysis (0)] |
| 23. | Dickey JP, Hewlett BR, Dumas GA, Bednar DA. Measuring collagen fiber orientation: a two-dimensional quantitative macroscopic technique. J Biomech Eng. 1998;120:537-540. [RCA] [PubMed] [DOI] [Full Text] [Cited by in Crossref: 22] [Cited by in RCA: 20] [Article Influence: 0.7] [Reference Citation Analysis (0)] |
| 24. | Pu Y, Li Y, Han Y, Yuan C, Wu L. [Rat keratinocyte primary cultures based on conductive polypyrrole primary cell culture technique]. Shengwu Yixue Gongchengxue Zazhi. 2001;18:416-418. [PubMed] |
| 25. | Liu XP, Li YM, Qiu XC, Li J, Yang YL. Effect and mechanism of melatonin on hemorheology in morphine withdrawal rats. Beijing Shengwu Yixue Gongcheng. 2001;20:143-145. |
| 26. | Jiang ZL, Yang XQ, Ji KH, Chen EY. Effect of endothelin on zero-stress state of arties in spontaneously hypertensive rats (SHR). Zhongguo Shengwu Yixue Gongcheng Xuebao. 2001;20:289-292. |
| 27. | Whittaker P, Kloner RA, Boughner DR, Pickering JG. Quantitative assessment of myocardial collagen with picrosirius red staining and circularly polarized light. Basic Res Cardiol. 1994;89:397-410. [RCA] [PubMed] [DOI] [Full Text] [Cited by in Crossref: 349] [Cited by in RCA: 355] [Article Influence: 11.5] [Reference Citation Analysis (0)] |
| 28. | Slayter EM. Optical methods in biology. New York Wiley. 1970;268-338. |
| 29. | Chandraratna PA, Whittaker P, Chandraratna PM, Gallet J, Kloner RA, Hla A. Characterization of collagen by high-frequency ultrasound: evidence for different acoustic properties based on collagen fiber morphologic characteristics. Am Heart J. 1997;133:364-368. [RCA] [PubMed] [DOI] [Full Text] [Cited by in Crossref: 23] [Cited by in RCA: 23] [Article Influence: 0.8] [Reference Citation Analysis (0)] |
| 30. | Pickering JG, Boughner DR. Quantitative assessment of the age of fibrotic lesions using polarized light microscopy and digital image analysis. Am J Pathol. 1991;138:1225-1231. [PubMed] |
| 31. | Zhang YJ. Objective image quality measures and their applica-tions in segmentation evaluation. Journal of Electronics. 1997;14:97-103. |
| 32. | Liu ZW, Zhang YJ. Image retrieval using both color and texture features. Tongxun Xuebao. 1999;20:36-40. |
| 33. | Dong YN. A New method for efficiently implementing parallel image ratations. Dianzi Xuebao. 2001;29:1671-1675. |
| 34. | Xue JH, Zhang YJ, Lin XG. MAP pixel clustering method based on SEM estimation of scatter-plot for low quality image. Dianzi Xuebao. 1999;27:95-98. |
| 35. | Zhang YJ, Xu Y, Liu ZW, Yao YR, Li Q. A test-bed for retrieving images with extracted features. Zhongguo Tuxiang Tuxing Xuebao. 2001;6:439-443. |
| 36. | Crowe JA, Gibson NM, Woolfson MS, Somekh MG. Wavelet transform as a potential tool for ECG analysis and compression. J Biomed Eng. 1992;14:268-272. [RCA] [PubMed] [DOI] [Full Text] [Cited by in Crossref: 67] [Cited by in RCA: 41] [Article Influence: 1.2] [Reference Citation Analysis (0)] |


