Published online Jun 15, 1999. doi: 10.3748/wjg.v5.i3.199
Revised: March 19, 1999
Accepted: April 10, 1999
Published online: June 15, 1999
AIM: To construct Hsp90 antisense RNA eukaryotic expression vector, transfect it into SGC7901 and SGC7901/VCR of MDR-type human gastric cancer cell lines, HCC7402 of human hepatic cancer and Ec109 of human esophageal cancer cell lines, and to study the cell cycle distribution of the gene transected cells and their response to chemotherapeutic drugs.
METHODS: A 1.03 kb cDNA sequence of Hsp90β was obtained from the primary plasmid phHSP90 by EcoRI and BamHI nuclease diges tion and was cloned to the EcoRI and BamHI site of the pcDNA by T4DNA ligase and an antisense orientation of Hsp90β expression vector was constructed. The constructs were transfected with lipofectamine and positive clones were selected with G418. The expression of RNA was determined with dot blotting and RNase protecti on assay, and the expression of Hsp90 protein determined with western blot. Cell cycle distribution of the transfectants was analyzed with flow cytometry, and the drug sensitivity of the transfectants to Adriamycin (ADR), vincrinstine (VCR), mitomycin (MMC ) and cyclophosphamide (CTX) with MTT and intracellular drug concentration of the transfectants was determined with flow cytometry.
RESULTS: In EcoRI and BamHI restriction analysis, the size and the direction of the cloned sequence of Hsp90β remained what had been designed and the gene constructs were named pcDNA-Hsp90. AH-SGC790, AH-SGC7901/VCR, AH-HCC7402 and AH-Ec109 cell clones all expressed Hsp90 anti-sense RNA. The expression of Hsp90 was down-regulated in AH-SGC7901, AH SGC7901/VCR, AH-HCC7402 and AH-Ec109 cell clones. Cell cycle distribution was changed differently. In AH-SGC7901/VCR and AH-Ec109 cells, G1 phase cells were increased; S phase and G2 phase cells were decreased as compared with their parental cell lines. In AH-SGC7901 cell, G1 phase cells were decreased, G2 phase cells increased and S phase cells were not changed, and in AH-HCC7402 cells G1, S and G2 phase cells remai ned unchanged as compared with their parental cell lines. The sensitivity of AH SGC7901, AH-SGC7901/VCR, AH-HCC7402 and AH-Ec109 to chemotherapeutic drugs, the sensitivity of AH-SGC7901/VCR to ADR, VCR, MMC and CTX the sensitivity of AH-HCC7402 to ADR and VCR, and the sensitivity of Ec109 to ADR, VCR and CTX all increased as compared with their parental cell lines. The mean fluorescence intensity of ADR in AH-SGC7901, AH-SGC7901/VCR, AH-HCC7402 and AH-Ec109 was also significantly elevated (P < 0.05).
CONCLUSION: Down-regulation of Hsp90 could change cell cycle distribution and increase the drug sensitivity of tumor cells.
- Citation: Liu XL, Xiao B, Yu ZC, Guo JC, Zhao QC, Xu L, Shi YQ, Fan DM. Down-regulation of Hsp90 could change cell cycle distribution and increase drug sensitivity of tumor cells. World J Gastroenterol 1999; 5(3): 199-208
- URL: https://www.wjgnet.com/1007-9327/full/v5/i3/199.htm
- DOI: https://dx.doi.org/10.3748/wjg.v5.i3.199
Heat shock proteins (HSPs) are a highly conserved group of intracellular protein s whose synthesis are increased in response to a variety of stressful stimuli[1]. HSPs are classified by molecular weight into groups of HSP110, HSP90, HSP70, HSP60, small molecular HSP and ubiquitin. HSP90 is a main chaperone protein in the cell plasma[2]. Recent studies have suggested that HSP90 expre ssion is increased in tumor tissues[3,4] and is closely related to multi-drug resistance protein P-gp[5,6]. To further investigate the biologi cal roles of HSP90 in the processes of carcinogenesis and the possibility of down regulation of HSP90 to reverse the drug resistance of tumor cells, we have constructed the Hsp90 antisense RNA eukaryotic expression vector, transfected it into SGC7901 of human gastric cancer SGC7901/VCR of multi-drug resistant human gastric cancer, HCC7402 of human hepatic cancer and Ec109 of human esophageal cancer cell lines. We also studied the cell cycle distribution of the gene transected cells and their response to chemotherapeutic drugs.
ReagentsEco R I and Bam H I nuclease was purchased from Sino-American Biotech Inc T4 DNA ligase from Promega Company. Other reagents included guan idinium isothiocyanate lysis solution (guanidinium isothiocyanate, citric acid sodium, sarkosyl, (γ-32P) ATP, T4 phage polynucleotide kinase, 20 × SSC (NaCl, citric acid sodium), 50 × Denhardt (Ficoll, N-Polyvinylpyrrolidone and BSA), pre-hybridization solution (6 × SSC, 0.5% SDS, 5 × Denhardt, 100 mg/L sal mon sperm DNA) TBE (89 mmol/L Tris-boric acid, 2 mmol/L EDTA), 5 × hybridization buffer (200 mM-PIPES pH 6.4, 2 mM-NaCl, 5 mM EDTA), formamide hybridization buffer (formamide: 5 × hybridization buffer = 4:1), RNase S1, RNase S1 buffer (10 mM Tris-Cl pH 7.5, 300 mM NaCl, 5 mM EDTA),50mg/L proteinase K, 0.5% SDS (w/v), phenol, chloroform, RNA loading buffer (80% formamide, 1mM E DTA pH 8.0, 0.1% bromophenol blue, 0.1% Xylene Cyanol), acrylamide, bisacrylamide, 10% saturated ammonium sulfate, urea, lipofactamine, G418, RPMI1640, goat anti-human HSP90 β monoclone antibody, HRP-labeled donkey anti-goat IgG, Lysis buffer (50 mmol/L Tris·Cl, pH 8.0, 150 mmol/L NaCl, 0.02% NaN3, 0.1% SDS, 100 µL/mL PMSF, 1 mg/L aprotinin, 1% NP-40, 0.5% deoxycholic acid), TEMED, Tris-glycine working solution (25 mmol/LTris·Cl, 250 mmol/L glycine, 0.1% SDS), 2 × SDS gel-loading buffer (100 mmol/L Tris·Cl, pH 6.8, 200 mmol/L DTT, 4% SDS, 0.2% bromophenol blue, 20% glycerol), electroblotting buffer (39 mmol/L glycine, 48 mmol/ L Tris·Cl, 0.037% SDS, 20% methanol), tetrachloride nephenol, propidium iodide, adriamycin (ADR), vincristine (VCR), Mitomycin (MMC) and cyclophosphamide (CTX).
Cell lines SGC7901 of human gastric cancer cell line was provided by the Military Medical Scientific Chinese Academy, of Military Medical Sciences, SGC7901/VCR of MDR-type human gastric cancer cell line was from our institute, HCC7402 of human hepatic cancer cell line from Pathological Department of Fourth Military Medical University (FMMU). Ec109 of human esophageal cancer cell line was from Biochemical Department of FMMU.
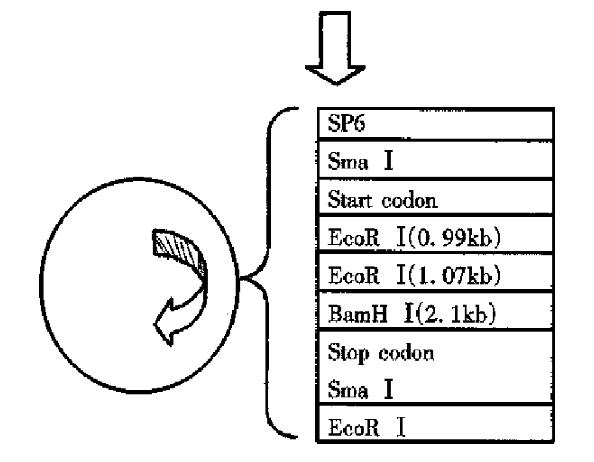
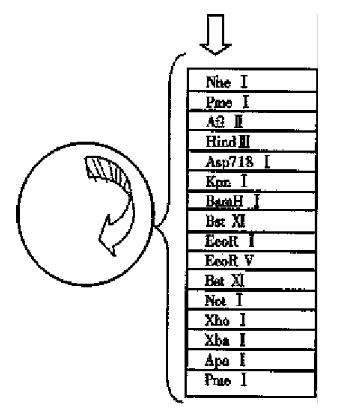
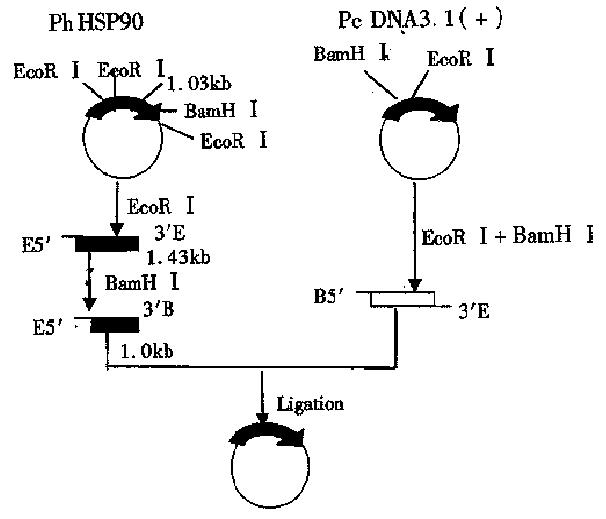
Construction of HSP90 antisense RNA eukaryotic expression vector phHSP90 of HSP90 cDNA plasmid was supplied by YAMAMOTO. Eukaryotic expression vector pcDNA 3.1(+) was supplied by Yang Jing-Hua. E.coli JM109 was introduced by original source our institute. (1) Plasmid map analyses: Analysis of the nuclease site of phHSP90 plasmid map of HSP90 prokaryotic expression vector found that there were two EcoRI nuclease sites and one BamHI nuclease sites in the gene sequence of HSP90 cDNA, of which EcoRI nuclease site is located at 0.99 kb and 1.07 kb respectively and BamHI nuclease site is located at 2.1 kb. There was another EcoRI nuclease site at prime 3 of the phHSP90 plasmid following the stop codon of HSP90 cDNA (Figure 1). There was one EcoRI and one BamHI nuclease site on the multi-clonal nuclease sites of prokaryotic expression vector pcDNA 3.1(+), of which EcoRI is located at prime 3 and BamHI is located at prime 5 (Figure 2). With EcoRI and BamHI nuclease, a 1.03kb fragment of 1.07kb-2.1kb could be digested from HSP90 cDNA (EcoRI was at prime 3, BamHI at prime 5). By inserting the digested fragment (1.03 kb) into EcoRI and BamHI nuclease site of pcDNA 3.1(+), the HSP90 antisense RNA eukaryotic expression vector could be constructed. (2) The primary plasmid phHSP90 was extracted by alkali lysis. First, phHSP90 was digested by EcoRI and electrophoresed on agarose-gel. Two fragments of 1.43kb and 3.99kb could be seen under ultraviolate from the gel. Of them, the 1. 43kb-DNA was excised from the gel and purified by the frozen-melting method. The purified DNA was further dig ested by BamHI nuclease an d electrophoresed, and a 1.3 kb fragment (EcoRI was at prime 3, BamHI was at prime 5) was obtained. The specific fragment (0.5 µg) and 0.1 µg-pcDNA 3.1(+) linearized by EcoRI and BamHI nuclease was ligated by T4 DNA ligase under 16 °C for 18 h (Figure 3). The ligated products were transformed into the sensitized E. coli JM109, grew on ampicilline resistant agrose gel. Positive clones were selected and amplified and a small amount of plasmid was extracted. The reconstructed plasmid was digested by either EcoRI or BamHI or by both EcoRI and BamHI nuclease to determine the size and the direction of the fragment.
Gene transfection and clone selection. The pcDNA-HSP90 of HSP90 anti-sense RNA constructs was extracted by the alkali lysis method, purified by PEG, transfected into SGC7901, SGC7901/VCR, HCC7402 and Ec109 by Lipofectamine and selected by G418. In a six-well culture plate, seed 1 × 10⁵ cells per well in 2 mL appropriate complete growth medium. Incubate the cells at 37 °C in a CO2 incubator until the cells are 80% confluent. After rinsing the cells with serum free and antibiotics-free medium, add pcDNA-HSP90-Lipofectamine mixture (or pcDN A 3.1(+) Lipofectamine mixture as control). Incubate the cells at 37 °C in a CO2 incubator for 6 h. Then change the medium with RPMI1640 culture medium containing 10% fatal bovine serum. G418 (400 mg/L) was added to select the resistant clone after 48-72 h. The medium was changed every 3 . 4 days and colonies were collected approximately 3 weeks later.
RNA analyses. (1) Probe designing and synthesizing. Reading 30bp from 1641 stbp of HSP90 cDNA, the gene sequence is 5’ATTGACGAGTACTGTGTGCAGCAGCTCAAG-3’. This gene fragment was matched with the gene bank from the Internet. We found that this sequence could only match with the HSP90 gene, and no homology with any other available genes. So this selected sequence was used as a probe and was synthesized by the Shanghai Biotech Company. β-actin was donated by Dr. Zhao Qing-Chuan and the sequence is β-actin-2095: 5’-ACTATGTTTGAGACCTTCAA-3’. (2) Oligonucleotide probes labeled by T4 phage polynucleotide kinase. Add pure water to a total volume of 19.5 µL in 10pmol/µL Oligonucleotide (1.0 µL), 10 × T4 buffer (2.0 µL) and 10pmol [γ-32P]ATP (5.0 µL). After being mixed, suck 0.5 µL-10 µL 10 mmol/L Tris-Cl (pH 8.0) to assay the radioactivity ratio . Then 1 µL T4 phage polynucleotide kinase was added and mixtured and bathed in 37 °C for 45 min, then bathed in 68 °C for 10 min to inactive T4 phage polynucleotide kinase. Afterwards, suck 0.5 µL above solution and added to 10 µL 10 mmol/L Tris-Cl (pH 8.0) to assay the radioa tivity ratio. Precipitate the probes with ethanol and resolubalyzed to 2 0 µL1mmol/L EDTA deionized water and stored at -20 °C. Radioactivity ratio of the oligonucleatide was assayed by the TCA method[7]. (3) RNA isolation. Tatal RNA was obtained from the cells by the guanidium isothiocyanate-phenol-chloroform extraction method. Cells of 1 × 10⁶ were collected and washed with PBS, guanidinium isothiocyanate lysis solution 500 µL, 3 mol/L-NaAc 100 µL, water saturated phenol and chloroform each 500 µL-were added, ice bathed for 20 min and centrifuged at 4 °C (12000 r/min) for 15 min. The upper water layer was sucked up to another eppendoff tube, extracted with anequal volume of phenol/chloroform (1/1), precipitated by isopropanol, centrifuged at 4 °C (12000 r/min) for 15 min, washed with 70% ethanol once, resuspended to three-evaporated water, treated by 50 µL DEPC quantitated and stored at -20 °C. (4) RNA dot blotting. The quantitated RNA was denatured by formaldehyde and was dropped to the nitrocellulose memmbrane and was dried in 80 °C dry oven for 2 h. After pre-hybridization at 68 °C water bathing for 2 h, probes were added to the hybridization bag and water bathed for 16 h-24 h at 68 °C. The hybridization membrane was picked out and washed with 2 × SSC and 0.1% SDS for 20 min at room temperature and with 0. 2 × SSC and 0.1% SDS at 68 °C 3 times for 10min. Then the nitrocellulose membrane was dried by filter paper and was covered by fresh-keeping film. The membrane was exposed to X-ray film in the presence of intensifying screens at -20 °C for 48 h-72 h. The film was then developed to observe the results. (5) RNase protection assay[8]. RNA (10 µL) from the cells were precipitated and resuspended in 30 µL formamide hybridization buffer. Radiolabeled Oligonucleotide probes (1 µL) and β-actin probes (1 µL) diluted to 1 × 10⁵ cpm with hy bridization buffer were added to the total RNA. The mixture was heated at 85 °C for 5 min and the RNAs hybridized at 45 °C or 50 °C overnight. After hybridization, 2 µL RNase S1 buffer, 16 µL water and 2 µL RNase S1 (2 mg/L) were added and the mixture was incubated at 37 °C for 60 min. The solution, which now contained RNase protected fragments, was deproteinized with 50 mg/L proteinase K and 0.5% SDS (w/v) at 37 °C for 15 min, extracted with an equal volume of phenol/chloroform (1/1) , coprecipitated with 10 µg yeast RNA, and resuspended in 8 µL loading buffer. The samples were electrophoresed on a 18% acrylamide/6M urea polyacrylamide sequencing gel (200 v, 120 min). Gels were radioautographed at -20 °C for 48 h. Its size was determined according to the standard molecular weight marker.
Protein analyses Cells were lysed by lysis buffer and the protein was quantitated. Then SDS-PAGE and immunoblot was performed as usual. Goat anti-HSP90-β (1:100) was reacted with the electroblotting for 2 h and HRP-labeled donkey anti-goat IgG (1:500) reacted with the electroblotting for 1h at room tempe rature. After washing with PBS (0.01 mol/L pH 7.4), tetrachloride nephenol was used to develop the protein strip and photographed.
Growth analyses The pcDNA-HSP90 gene transfected cells and the ir parental cells were seeded into 24-well plates as pairs at a concentration of 1 × 10⁴/well, 2 mL each well, and cultured in the incubator with a condition of 5% CO2, 37 °C. The cell morphology and growth feature were observed under microscope. Three wells of each kind of cells were digested by 0.25% trypsin andcounted , and its mean value was used to drow the growth curve. Cell doubling time of the exponential phase was calculated by Patterson’s formula, Td = T·1g2/lg (N1/N0). Here Td is cell doubling time (h), Tis the time needed for cell growth from N0 to N1
Cell cycle analyses. Cells growing well were digested by 0.25% trypsin, washed by PBS, fixed by cold ethanol at 4 °C and dyed with PI, and then were analyzed by flow cytometry.
The drug sensitivity analyses. MTT methods were used. The pcDNA-HSP90 gene transfected cells and their parental cells were seeded into 96well plates as pairs at a concentration of 5 × 10³ /well, 200 µL each well, cultured in the incubator with a condition of 5% CO2, 37 °C overnight. Add adriamycin, vincristine, mitomycin or cyclophosphamide at a concentration of 2 µg/µL, 2 µg/µL, 2 µg/µL and 400 µg/µL-according to the peak plasma concentration of different antineoplastic drugs, and dilated at a ratio of 1:10 respectively and seed 3 weeks for each concentration. 48 h later, add tetrazolium blue 20 μL to each well at a concentration of 5 mg/L PBS. Culturing was continued for 4 h and the supernatant was removed. Add 150 µL DMSO to react for 15 min. ELISA reader was used to measure the OD value of each well at A490 nm and the ratio of living cells. The living cell ratio = A490 of the experimental well/that of control well. Dose-effector curve was drawn and IC50 and resistant index (RI) were determined. RI = IC50 of parental cells/that of the gene transfected cells.
Intracellular drug concentration analyses In a 35 mm tissue culture plate, seed 3 × 10⁵ cells in to 2 mL complete growth medium. Incubate the cells at 37 °C in a CO2 incubator until the cells are 70% confluent. Add adriamycin to make its final concentration to 10 mg/L. After culture for 1 h, cells were digested by 0.25% trypsin, washed by PBS and were analyzed by flow cytometry at 575 nm.
The growth of pcDNA-HSP90 transfectants and their associated controls were compared using two sample t tests. Cell cycle fractions, sensitivity of tumor cells to chemotherapeutic drugs and intracellular drug concentrations of pcDNA-HSP90 transfectants and their associated controls were compared using ANOVA.
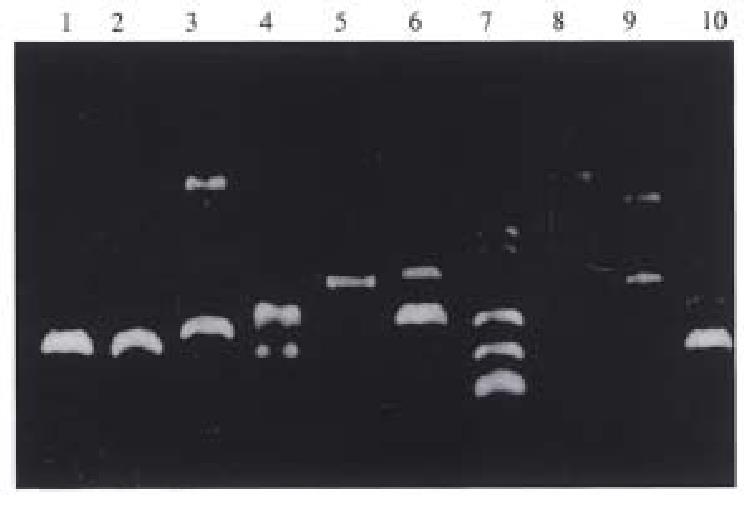
Two gene fragments of 1.43 kb and 3.99 kb were isolated by agarose-gel elctrophoresis after the primary plasmid phHSP90 was digested by EcoR. After the 1.43 kb gene fragment was further digested by BamHI, a 1.03kb fragment was obtained, of which BamHI was at its prime 3, EcoRI was at its prime 5. The eukaryotic expression vector pcDNA 3.1(+) was digested by EcoRI and BamHI nuclease and formed linearized plasmid, of which EcoRI was at its prime 3 and BamHI was at its prime 5. With the ligated positive reconstructs digested by EcoRI and BamHI nuclease, we could abtain a 5.4 kb vector DNA and 1.03kb inserted fragment. If the ligated positive reconstructs were digested by either EcoRI or BamHI nuclease, we could see a linearized reconstructs (Figure 4). These results indicated that the size and the direction of the inserted HSP90 cDNA fragment was what had been expected . The reconstructed expression vector was named pcDNA-HSP90.
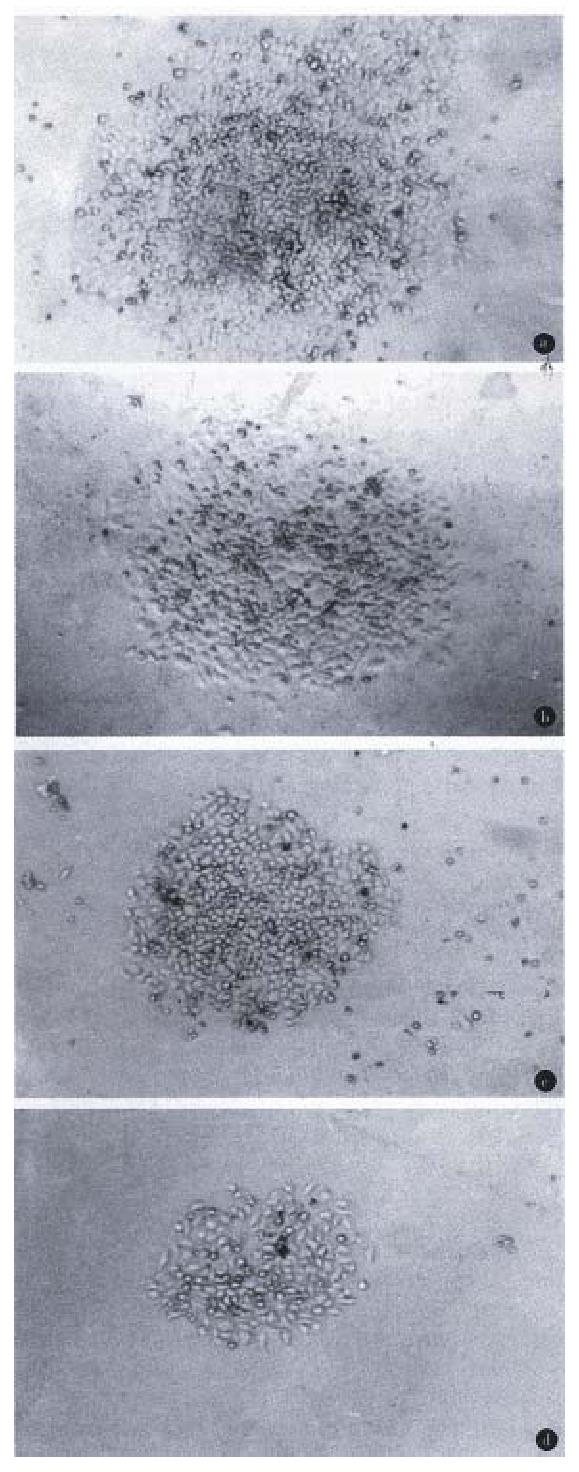
The positive colonies were selected approximately 3 weeks later. pcDNA-HSP90 of HSP90 anti-sense RNA constructs transfected cell lines were named AH-SGC7901, AH-SGC7901/VCR, AH-HCC7402 and AH-Ec109 respectively (Figure 5). pcDNA3.1 (+) transfected cell lines were named SGC7901-pcDNA, SGC7901/VCR-pcDNA, HCC7402 pcDNA and Ec109-pcDNA.
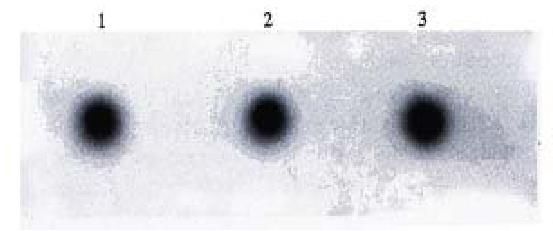
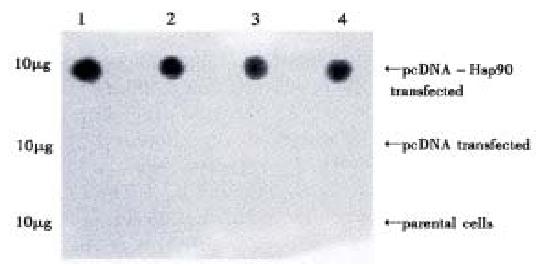
Dot blotting. All three groups of pcDNA-HSP90 transfectants, pcDNA3.1(+) transfectants and their parental cells had positive signals of β-actin (Figure 6). Only pcDNA-HSP90 transfected cell group had positive signals of HSP90 anti-sense RNA (Figure 7), indicating that pcDNA-HSP90 transfected cell group had the expression of HSP90 anti-sense RNA.
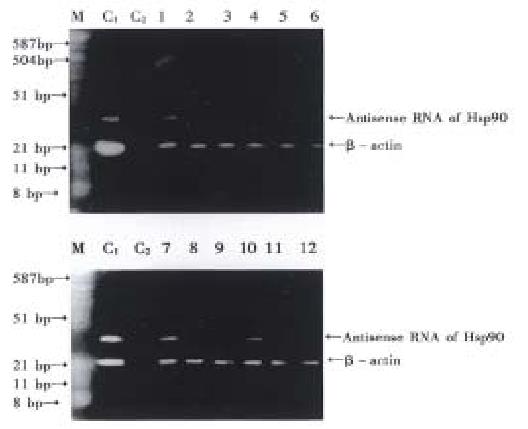
RNase protection assay (Figure 8). HSP90 anti-sense RNA transf ectants AH-SGC7901/ VCR (1), AH-SGC7901 (4), AH-HCC7402 (7) and AH-Ec109 (10) cells had two positive stripes (Hsp90 anti-sense RNA, β-actin) while pcDNA3. 1(+) transfected group and the blank control cell group (parental cell line) had only one positive stripe ( β-actin), also indicating that pcDNA-HSP90 transfected cell group had the expression of HSP90 anti-sense RNA and further confirmed that pcDNA-HSP90 had been transfected into the aim cells and had the expression of HSP90 anti-sense RNA.
The expression of Hsp90 protein in the gene transfected cells. Western blot results showed that the expression of Hsp90β in pcDNA 3.1(+) transfected cells and in their parental cells were almost the same. In Hsp90 antisense RNA transfected cells (AH-SGC7901, AH-SGC7901/VCR, AH-HCC7402 and AH-Ec109), Hsp90β expression was lower than that of their parental cells and pcDNA3. 1(+) transfected cells (Figure 9).
Growth of the gene transfected cell lines. Compared with their parental cells, the growth of pcDNA-HSP90 gene transfected cells was inhibited in different degrees (Figure 10). The growth inhibiting rate of the 10th day AH-SGC7901 to SGC7901 was 24.28%, of AH-SGC7901/VCR to SGC7901/VCR 27.58%, AH-HCC7402 to HCC7402 10.51% and AH-Ec109 to Ec109 66.91%.
In SGC7901 and AH-SGC7901, the Td calculated from the cell growth curve was 26.6 h and 27.72 h, respectively. The Td of AH-SGC7901 was prolonged 1.12 has compared with its parental cell SGC7901. Td of SGC7901/VCR and AHSGC7901/VCR was 55.53 h and 72.22 h, respectively. Td of HCC7402 and AH-HCC7402, and Ec109 and AH-Ec109 was 40.66 h and 43.40 h, and 25.03 h and 41.00 h, respectively. These results indicated that the Td of AH-SGC7901/VCR and AH-Ec109 was significantly longer than that of their parental cells (P < 0.05), while that of AH-SGC7901 and AH-HCC7402 had no obvious changes as against that of their parental cells (P > 0.005).
Cell cycle distribution of the transfected cells (Table 1). We can see from Table 1 that G1 phase cells of AH-SGC7901 were decreased, G2 phase cells were increased and S phase had no obvious change as compared with their parental cells, while G1 phase cells of AH-SGC7901/VCR were increased and S phase and G2 phase cells were decreased. G1 phase, S phase and G2 phase cell of AH-HCC7402 had no obvious changes and G1 phase cells of AH-Ec109 were increased, S and G2 phase cells were significantly decreased as compared with their parental cells.
| Cell lines | Cell cycle fraction (%) | ||
| G0-G1 | S | G2-M | |
| SGC7901 | 61.6 | 28.0 | 10.4 |
| AH-SGC7901 | 55.7 | 28.1 | 16.2 |
| SGC7901/VCR | 62.2 | 23.5 | 14.3 |
| AH-SGC7901/VCR | 74.7 | 13.6 | 11.7 |
| HCC7402 | 70.7 | 21.1 | 8.2 |
| AH-HCC7402 | 69.5 | 20.0 | 10.4 |
| Ec109 | 56.2 | 29.5 | 14.8 |
| AH-Ec109 | 72.5 | 19.5 | 8.0 |
Drug sensitivity of the gene transfectants. IC50 of SGC7901 to ADR, VCR, MMC and CTX was 1.58 × 10⁻⁶, 1.99 × 10⁻³, 3.10 × 10⁻² and 630 mg/L and IC50 of AH-SGC7901 to ADR, VCR, MMC and CTX was 1.58 × 10⁻⁷, 1.99 × 10⁻⁷, 1.25 × 10⁻³ and 630 mg/L respectively. RI of SGC7901 to ADR, VCR, MMC and CTX was 10, 10000, 24.8 and 1 compared with AH-SGC7901, i.e., the sensitivity of AH-SGC7901 to ADR, VCR and MMC increased 10, 10000 and 24.8 times respectively as compared with their parental cell lines, and the sensitivity to CTX had no obvious changes.
IC50 of SGC7901/VCR to ADR, VCR, MMC and CTX was 0.398, 1.25, 0.199 and 3981.07 mg/L, IC50 of AH-SGC7901/VCR to ADR, VCR, MMC and CTX was 0.1, 0.199, 0.063 and 794.32 mg/L. RI of SGC7901/ VCR to ADR, VCR, MMC and CTX was 3.98, 6.28, 3.15 and 5.01 as compared with AH-SGC7901.
IC50 of HCC7402 to ADR, VCR, MMC and CTX was 1.20 × 10⁻³, 6.33 × 10⁻⁴, 3.0 × 10⁻² and 1258.92 mg/L and IC50 of AH-HCC7402 to ADR, VCR, MMC and CTX was 2.51 × 10⁻⁶, 6.33 × 10⁻⁵, 3.00 × 10⁻² and 1258.92 mg/L. RI of HCC7402 to ADR, VCR, MMC and CTX was 477.7, 10, 1 and 1 or the sensitivity of AH-HCC7402 to ADR and VCR increased 477.7 and 10 times respectively compared with their parental cell lines, and its sensitivity to MMC and CTX had no obvious changes.
IC50 of Ec109 to ADR, VCR, MMC and CTX was 1.0 × 10⁻¹, 44.66, 1.99 and 1258.92 mg/L and IC50 of Ec109 to ADR, VCR, MMC and CTX was 3.16 × 10⁻⁶, 1.99, 1.99 and 398.10 mg/L respectively. RI of Ec109 to ADR, VCR, MMC and CTX was 31 622.77, 22.44, 1.00 and 3.16.
Intracellular drug concentration of the gene transfectants. The mean fluorescence intensity of ADR was 0.286 ± 0.02 in SGC7901, 0.290 ± 0.026 in AH-SGC7901 and 0.279 ± 0.009 in SGC 7901 control, which was significantly increased in AH-SGC7901 (P < 0.05).
The mean fluorescence intensity of ADR in SGC7901/VCR was 0.320 ± 0.050, 0.323 ± 0.054 in AH-SGC7901/VCR which was significantly increased (P < 0. 05).
The mean fluorescence intensity of ADR was 0. 480 ± 0.122 in HCC7402, and significantly increased in AH-HCC7402 (0.503 ± 0.188) (P < 0.05).
The mean fluorescence intensity of ADR was 1. 300 ± 0.361 in Ec109, and significantly increased in AH-Ec109 (1.680 ± 0.590) (P < 0.05).
Antisense RNA is the RNA that is complementary with the mRNA. The antisense RNA could combine with mRNA specifically and inhibit the translation of the RNA. It is one of the gene expression and modulating modes in prokaryotic cells. Antisense RNA also exists in eukaryotic cells but its function is still unknown. Antisense RNA technich is to tranfect artificially-composed antisense RNA into the eukaryotic cells, transcript antisense RNA, block the translation of the gene, inhibit the expression of the specific gene and block the function of the gene, and to evaluate the influence of the gene to the cell growth and cell differentiation. In comparison of the ribozyme technich[8], antisense RNA technich has the advantages of simple designing, strong specificity, easy operating, and being economic and time saving. According to the two common nuclease EcoRI and BamHI and their different directions of phHSP90 and pcDNA 3.1(+), the nuclease digested fragment was inserted to pcDNA 3.1(+), and the nuclease res triction analysisshowed that the gene clone was successful. This study has laid ground forfurther understanding the biological roles of HSP90 in tumor cells.
In order to determine whether the HSP90 antisense RNA gene transfected and G418 selected cell clones had the expression of HSP90 antisense RNA, a 30-bp oligonucleotide was synthesized and was labeled with (γ-32P) ATP by T4 phage polynucleotide kinase. RNA isolated from the selected clones was first analyzed by dot blotting with the labeled probes. The results showed that the pcDNA-HSP90 transfected cell group had positive signals while the pcDNA 3.1(+) transfected cell group and the blank control cell group had no positive signals, indi cating that the pcDNA-HSP90 transfected cell group had the expression of HSP90 antisense RNA.
RNase protection assay[9,10] or RNase mapping is a highly sensitive method for gene expression analysis. This method was primarily used to analyze and quantitate specific RNAs. In the research of gene’s characters, it is used to determine the size of the exons. The principle of RNase protection assay is: the labeled oligonucleotide probes were hybridized with cell total RNA or mRNA. The unhybridized single chain RNA was digested by RNase S1. The hybridized double chain was protected and could not be digested by RNase S1. Electrophoresis on acrylamide/urea polyacrylamide sequencing gel, the protected chain could be isolated. Radioauto graph could develop the protected chain. Its size could be determined according to the standard-molecular-weight-marker. By this method, 0.1pg globin RNA could be assayed. Its specificity and sensitivity is far greater than Northern blot. In this research, RNase protection assay was also used to determine the expression of HSP90 antisense RNA in the gene transfected and the control cells. The results showed that pcDNA-HSP90 transfected cells had the expression of HSP90 antisense RNA. Analysis of RNA by RNase protection assay is simpler than Northern blot and more specific than Dot blot.
Western blot showed that the expression of HSP90 β in AH-SGC7901,AH-SGC7901/VCR, HCC7402 and Ec109 was decreased as compared with their parental cells and their pcDNA transfected groups. This indicated that the antisense RNA of HSP90 has partly blocked the mRNA of HSP90 and inhibited the translation of HSP90 protein.
Both Dot blot and RNase protection assay showed that pcDNA-HSP90 transfected AH-SGC7901, AH-SGC7901/VCR,AH-HCC7402 and AH-Ec109 all had the expression of HSP90 antisense RNA, and with western blot, the expression of HSP90β protein in these cells was decreased when compared with their parental cells and their pcDNA transfected groups. This has established a cell model for further studing the role of HSP90 in these cell lines.
It is known that cell growth is closely related to cell cycle distribution, and cell cycle is regulated by many factors. Oesterreich S[11] and Mairesse N[12] showed in their studies that hsp27 may be involved in the regulati on of cell growth. Fuse et al[13] had investigated the alternations of cytokinetics and HSP70 expression by hyperthermia in the in vitro experimental systems, using two rat glioma cell lines, two human glioblastoma cell lines and rat glioblast cells. They found that HSP70 was increased in all the heat-treated cells. S phase and/or G2/M phase cells were increased in these heat-treated cells. Faassen[14] suggested that in vivo aging of human T cells resulted in a general defect in the induction of gene products required for transition from quiescence into the S phase of the cell cycle. This conclusion is supported by observations of diminished inducibility of the lymphokine IL-2 and its receptor during aging . Faassen’s study demonstrated that decreased proliferative response to phytohemagglutinin (PHA) was also paralleled by decreased induction during the prereplicative interval of two of the most strongly enhanced proteins in mitogen-activated T cells: HSP90 and P73, which are also members of the heat shock protein family. Diminished induction of HSP90 and p73 was observed in lymphocytes from older subjects (mean age 75 years), regardless of differences in heal th status of the subject populations.
The above two researches indicated that HSP plays a regulation role in cell growth. Hyperthermic treatment could induce the expression of HSP70, promote the synthesis of DNA and increase the S phase and G2/M-phase cell and is beneficial to cell prolifer ation. In the aged subjects, T cell proliferative response was decreased because of the defects in the induction of HSP90 and P73.
In order to further understand weather decreased expression of HSP90 could influence the tumor growth, we used the cell model we had established and studied their growth. From the cell growth curve it can be seen that the cell growth of the HSP90 antisense RNA transfectants was inhibited in different degrees. Among them, the growth of AH-SGC7901/VCR and AH-Ec109 was significantly decreased as compared with their parental cells, and the cell doubling time prolonged 16.69 h and 15.97 h respectively. The growth of AH-SGC7901 was also inhibited to some degree as compared with its parental cells.
Cell cycle analyses showed that, G1 phase cells of AH-SGC7901/VCR and AH-Ec109 were increased and S phase cells were decreased as compared with their parental cells, indicating that there was G1 arrest, causing the growth inhibition of the above two cell groups. G1 phase cells of AH-SGC7901 were diminished, G2 phase cells were increased and S phase had no obvious change, indicating that there was G2/M arrest, causing slower mitosis, and the decrease of cell mitosis and proliferation. G1 phase S phase and G2 phase of AH-HCC7402 all had no obvious changes compared with their parental cells. These results indicate that the expres sion of HSP90β is related to cell growth. Low expression of HSP90 could cause G1 arrest and inhibit the synthesis of DNA or cause G2/M-arrest and inhibit cell mitosis, therefore inhibiting the cell growth and proliferation. The different inhibition rate in different cell lines may be because of the different heritage background and different blocking rate of HSP90 antisense RNA to HSP90 gene in these gene transfected cells. We concluded that down-regulate the expression of HSP90β could change the cell cycle distribution and inhibit the tumor cell growth.
The development of resistance of tumor cells to anti-cancer drugs is one of the critical issues for successful chemotherapy. Multi-drug resistance is an adaptable reaction of tumor cells to chemotherapeutic drugs. Various kinds of protein expression and/or the changes of enzyme activity could be seen in MDR-type tumor cells. Through the changes of these proteins, tumor cells could avoid being killed by chemical agents. Much evidence suggests that the heat shock proteins (hsp) may be involved in drug resistance[5,6,11,15-17]. In our study, the sensitivity of the pcDNA-HSP90 transfected cells to chemotherapeutic drugs increased more significantly than their parental cells. This means that lowered expression of HSP90 could increase sensitivity of the tumor cells to chemotherapeutic drugs. We also found that drug accumulation was increased in the pcDNA-HSP90 transfected cells. HSP90 might be related to the efflux of chemical agents. When HSP90 is decreased, the retention of chemical agents is increased and the intracellular drug concentration is increased, so is the sensitivity of the cells to the anti-cancer drugs. HSP90 is a major cytoplasmic chaperone protein and is related to many protein substrates, e.g. actin, tubulin, protein kinase and steroid receptor[18,19]. HSP90 may form hetero-oligomeric complex with some plasmic proteins such as HSP70, p60, Hip/p48, p23, FKBP52, FKBP51 and Cyp-40, involve protein folding, transportation and degradation, and regulate the activity of the protein[20-25].
We thought that HSP90 may regulate the sensitivity of of tumor cells to chemotheapeutic drugs through regulating the activity and function of P-gp. Bertram J and co-workers have reported that heat-shock protein hsp90 beta is associated with the P-glycoprotein (P-gp or P170), one of the most prominent components of the drug resistance machinery. They demonstrated that hsp90 beta can be co-precipitated along with P-gp and vice versa . In native agarose gels, both proteins migrated together as one single band as shown by Western blot analysis. This intracellular protein-protein interaction may present a mechanism for the modulation of P-gp function possibly by a stabilization of the protein which seems to be attributed to hsp90 beta. This study supports our research.
Oesterreich S and co-workers[1] found that when hap was induced by elevated temperatures, resistance to doxorubicin (Dox), but not to other commonly used chemotherapeutic agents, was induced in breast cancer cells. To evaluate the role of hsp27 in this phenomenon, they have transfected MDA-MB-231 breast cancer cells, which normally express low levels of hsp27, with a full-length hsp27 cons truct. These hsp27-overexpressing cells now display a 3-fold elevated resistance to Dox.They have also derived a MCF-7 breast cancer cell line with amplified endogenous hsp27 which is highly resistant to Dox. When these cells were transfected with an antisense hsp27 construct, they were rendered sensitive to Dox (3-fold). These results suggest that hsp27 specifically confers Dox resistance in human breast cancer cells. Our studies showed that HSP90 was related to MDR, and lowered expression of HSP90 could increase the drug sensitivity of tumor cells by 3-30 000 times indicating that regulation of HSP90 is more effective than hsp27 in this aspect. In different cells with different chemicals, the effect is different, possibly because of the different biological characteristics of the tumor cells and the different mechanism of the anti-cancer drugs.
The mechanisms of HSP90 in sensitizing tumor cells to anti-cancer drugs need to be further studied. This study gives some clues in using HSP inhibitors as a sensitizer to increase the sensitivity of tumor cells to anti-cancer drugs. In conclusion, down-regulation of HSP90 could change the cell cycle distribution and slow the tumor cell growth and increase the sensitivity of tumor cells to anti-cancer drugs.
Project supported by the National Natural Science Foundation of China, No. 39570806 and National Excellent Youth Scientific Foundation, No. 3952020.
Edited by Jing-Yun Ma
| 1. | Schlesinger MJ. Heat shock proteins. J Biol Chem. 1990;265:12111-12114. [PubMed] |
| 2. | Johnson JL, Craig EA. Protein folding in vivo: unraveling complex pathways. Cell. 1997;90:201-204. [RCA] [PubMed] [DOI] [Full Text] [Cited by in Crossref: 131] [Cited by in RCA: 129] [Article Influence: 4.6] [Reference Citation Analysis (0)] |
| 3. | Yano M, Naito Z, Tanaka S, Asano G. Expression and roles of heat shock proteins in human breast cancer. Jpn J Cancer Res. 1996;87:908-915. [RCA] [PubMed] [DOI] [Full Text] [Full Text (PDF)] [Cited by in Crossref: 79] [Cited by in RCA: 80] [Article Influence: 2.8] [Reference Citation Analysis (0)] |
| 4. | Jameel A, Skilton RA, Campbell TA, Chander SK, Coombes RC, Luqmani YA. Clinical and biological significance of HSP89 alpha in human breast cancer. Int J Cancer. 1992;50:409-415. [RCA] [PubMed] [DOI] [Full Text] [Cited by in Crossref: 86] [Cited by in RCA: 85] [Article Influence: 2.6] [Reference Citation Analysis (0)] |
| 5. | Bertram J, Palfner K, Hiddemann W, Kneba M. Increase of P-glycoprotein-mediated drug resistance by hsp 90 beta. Anticancer Drugs. 1996;7:838-845. [RCA] [PubMed] [DOI] [Full Text] [Cited by in Crossref: 35] [Cited by in RCA: 35] [Article Influence: 1.2] [Reference Citation Analysis (0)] |
| 6. | Kim SH, Hur WY, Kang CD, Lim YS, Kim DW, Chung BS. Involvement of heat shock factor in regulating transcriptional activation of MDR1 gene in multidrug-resistant cells. Cancer Lett. 1997;115:9-14. [RCA] [PubMed] [DOI] [Full Text] [Cited by in Crossref: 23] [Cited by in RCA: 23] [Article Influence: 0.8] [Reference Citation Analysis (0)] |
| 7. | Zhou DY. Experimental methods of molecular biology. Beijing: People's Military Medical Publishing House. 1995;42. |
| 8. | Lau ET, Kong RY, Cheah KS. A critical assessment of the RNAse protection assay as a means of determining exon sizes. Anal Biochem. 1993;209:360-366. [RCA] [PubMed] [DOI] [Full Text] [Cited by in Crossref: 5] [Cited by in RCA: 7] [Article Influence: 0.2] [Reference Citation Analysis (0)] |
| 9. | Altman S. RNA enzyme-directed gene therapy. Proc Natl Acad Sci USA. 1993;90:10898-10900. [RCA] [PubMed] [DOI] [Full Text] [Cited by in Crossref: 61] [Cited by in RCA: 60] [Article Influence: 1.9] [Reference Citation Analysis (0)] |
| 10. | Sambrook J, Fritsch EF, Maniatis T. Molecular cloning: a labora-tory mannual. 2nd ed. Cold Spring Harbor: Cold Spring Harbor Laboratory Press. 1989;374. |
| 11. | Oesterreich S, Weng CN, Qiu M, Hilsenbeck SG, Osborne CK, Fuqua SA. The small heat shock protein hsp27 is correlated with growth and drug resistance in human breast cancer cell lines. Cancer Res. 1993;53:4443-4448. [PubMed] |
| 12. | Mairesse N, Horman S, Mosselmans R, Galand P. Antisense inhibition of the 27 kDa heat shock protein production affects growth rate and cytoskeletal organization in MCF-7 cells. Cell Biol Int. 1996;20:205-212. [RCA] [PubMed] [DOI] [Full Text] [Cited by in Crossref: 50] [Cited by in RCA: 53] [Article Influence: 1.8] [Reference Citation Analysis (0)] |
| 13. | Faassen AE, O'Leary JJ, Rodysill KJ, Bergh N, Hallgren HM. Diminished heat-shock protein synthesis following mitogen stimulation of lymphocytes from aged donors. Exp Cell Res. 1989;183:326-334. [RCA] [PubMed] [DOI] [Full Text] [Cited by in Crossref: 51] [Cited by in RCA: 44] [Article Influence: 1.2] [Reference Citation Analysis (0)] |
| 14. | Ciocca DR, Fuqua SA, Lock-Lim S, Toft DO, Welch WJ, McGuire WL. Response of human breast cancer cells to heat shock and chemotherapeutic drugs. Cancer Res. 1992;52:3648-3654. [PubMed] |
| 15. | Ciocca DR, Oesterreich S, Chamness GC, McGuire WL, Fuqua SA. Biological and clinical implications of heat shock protein 27,000 (Hsp27): a review. J Natl Cancer Inst. 1993;85:1558-1570. [RCA] [PubMed] [DOI] [Full Text] [Cited by in Crossref: 375] [Cited by in RCA: 362] [Article Influence: 11.3] [Reference Citation Analysis (0)] |
| 16. | Sliutz G, Karlseder J, Tempfer C, Orel L, Holzer G, Simon MM. Drug resistance against gemcitabine and topotecan mediated by constitutive hsp70 overexpression in vitro: implication of quercetin as sensitiser in chemotherapy. Br J Cancer. 1996;74:172-177. [RCA] [PubMed] [DOI] [Full Text] [Full Text (PDF)] [Cited by in Crossref: 77] [Cited by in RCA: 69] [Article Influence: 2.4] [Reference Citation Analysis (0)] |
| 17. | Smith DF. Dynamics of heat shock protein 90-progesterone receptor binding and the disactivation loop model for steroid receptor complexes. Mol Endocrinol. 1993;7:1418-1429. [PubMed] |
| 18. | Xu Y, Lindquist S. Heat-shock protein hsp90 governs the activity of pp60v-src kinase. Proc Natl Acad Sci USA. 1993;90:7074-7078. [RCA] [PubMed] [DOI] [Full Text] [Cited by in Crossref: 135] [Cited by in RCA: 139] [Article Influence: 4.8] [Reference Citation Analysis (0)] |
| 19. | Yonehara M, Minami Y, Kawata Y, Nagai J, Yahara I. Heat-induced chaperone activity of HSP90. J Biol Chem. 1996;271:2641-2645. [RCA] [PubMed] [DOI] [Full Text] [Cited by in Crossref: 135] [Cited by in RCA: 139] [Article Influence: 4.8] [Reference Citation Analysis (0)] |
| 20. | Wiech H, Buchner J, Zimmermann R, Jakob U. Hsp90 chaperones protein folding in vitro. Nature. 1992;358:169-170. [RCA] [PubMed] [DOI] [Full Text] [Cited by in Crossref: 382] [Cited by in RCA: 380] [Article Influence: 11.5] [Reference Citation Analysis (0)] |
| 21. | Jakob U, Buchner J. Assisting spontaneity: the role of Hsp90 and small Hsps as molecular chaperones. Trends Biochem Sci. 1994;19:205-211. [RCA] [PubMed] [DOI] [Full Text] [Cited by in Crossref: 283] [Cited by in RCA: 278] [Article Influence: 9.0] [Reference Citation Analysis (0)] |
| 22. | Pennisi E. Expanding the eukaryote's cast of chaperones. Science. 1996;274:1613-1614. [RCA] [PubMed] [DOI] [Full Text] [Cited by in Crossref: 14] [Cited by in RCA: 14] [Article Influence: 0.5] [Reference Citation Analysis (0)] |
| 23. | Freeman BC, Toft DO, Morimoto RI. Molecular chaperone machines: chaperone activities of the cyclophilin Cyp-40 and the steroid aporeceptor-associated protein p23. Science. 1996;274:1718-1720. [PubMed] |
| 24. | Johnson J, Corbisier R, Stensgard B, Toft D. The involvement of p23, hsp90, and immunophilins in the assembly of progesterone receptor complexes. J Steroid Biochem Mol Biol. 1996;56:31-37. [RCA] [PubMed] [DOI] [Full Text] [Cited by in Crossref: 64] [Cited by in RCA: 56] [Article Influence: 1.9] [Reference Citation Analysis (0)] |
| 25. | Jakob U, Lilie H, Meyer I, Buchner J. Transient interaction of Hsp90 with early unfolding intermediates of citrate synthase. Implications for heat shock in vivo. J Biol Chem. 1995;270:7288-7294. [PubMed] |


