Copyright
©The Author(s) 2024.
World J Gastroenterol. Feb 7, 2024; 30(5): 499-508
Published online Feb 7, 2024. doi: 10.3748/wjg.v30.i5.499
Published online Feb 7, 2024. doi: 10.3748/wjg.v30.i5.499
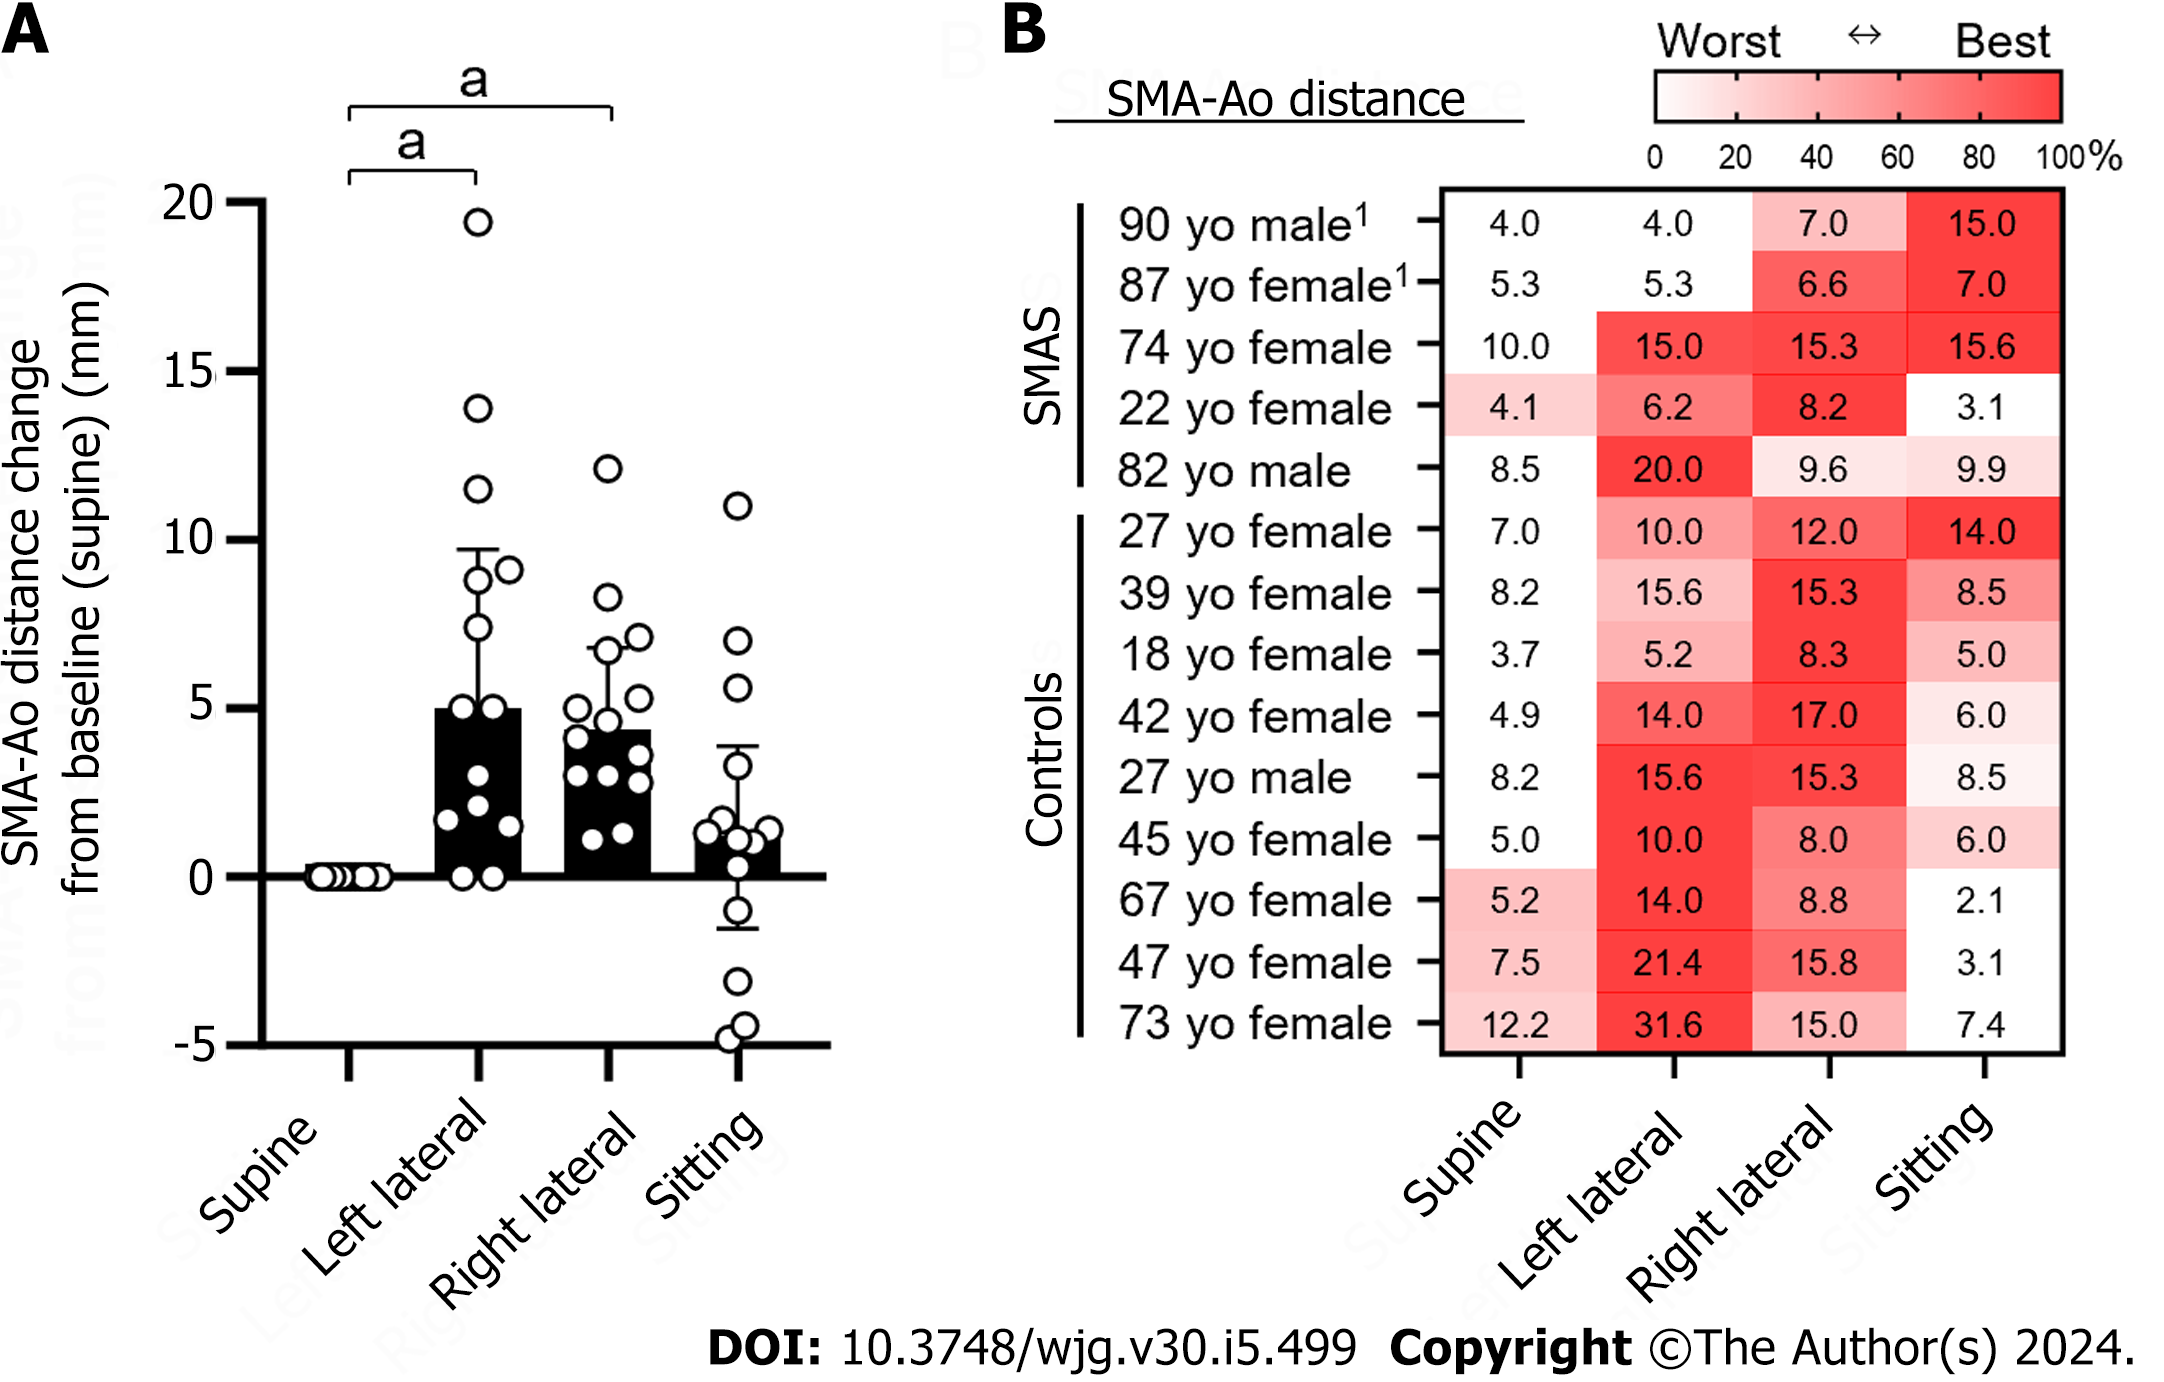
Figure 7 Superior mesenteric artery-aorta distance in four body positions in eight individuals.
A: Distance change of superior mesenteric artery-aorta (SMA-Ao) from the baseline position (supine position). Dots indicate individual results. Bars indicate median with interquartile range; B: Fourteen individuals included five cases of superior mesenteric artery syndrome and nine healthy controls (age, sex, and absolute distance of SMA-Ao mm). The absolute distance of SMA-Ao (mm) in thirteen individuals were shown in each position. The SMA-Ao distances were measured by ultrasonography. If it was difficult to detect the duodenum, the subjects ingested 200 mL of water which is a modified method of drinking-ultrasonography test. Statistical analysis was performed by GraphPad Prism version 10.0.2 with Dunn’s multiple comparisons tests with ANOVA. 1Indicates the present case. aP < 0.01. The heat map indicates the best and worst positions of the SMA-Ao distance in each individual. SMA: Superior mesenteric artery; Ao: Aorta; SMAS: Superior mesenteric artery syndrome.
- Citation: Hasegawa N, Oka A, Awoniyi M, Yoshida Y, Tobita H, Ishimura N, Ishihara S. Dynamic ultrasonography for optimizing treatment position in superior mesenteric artery syndrome: Two case reports and review of literature. World J Gastroenterol 2024; 30(5): 499-508
- URL: https://www.wjgnet.com/1007-9327/full/v30/i5/499.htm
- DOI: https://dx.doi.org/10.3748/wjg.v30.i5.499


