Copyright
©The Author(s) 2020.
World J Gastroenterol. May 28, 2020; 26(20): 2570-2583
Published online May 28, 2020. doi: 10.3748/wjg.v26.i20.2570
Published online May 28, 2020. doi: 10.3748/wjg.v26.i20.2570
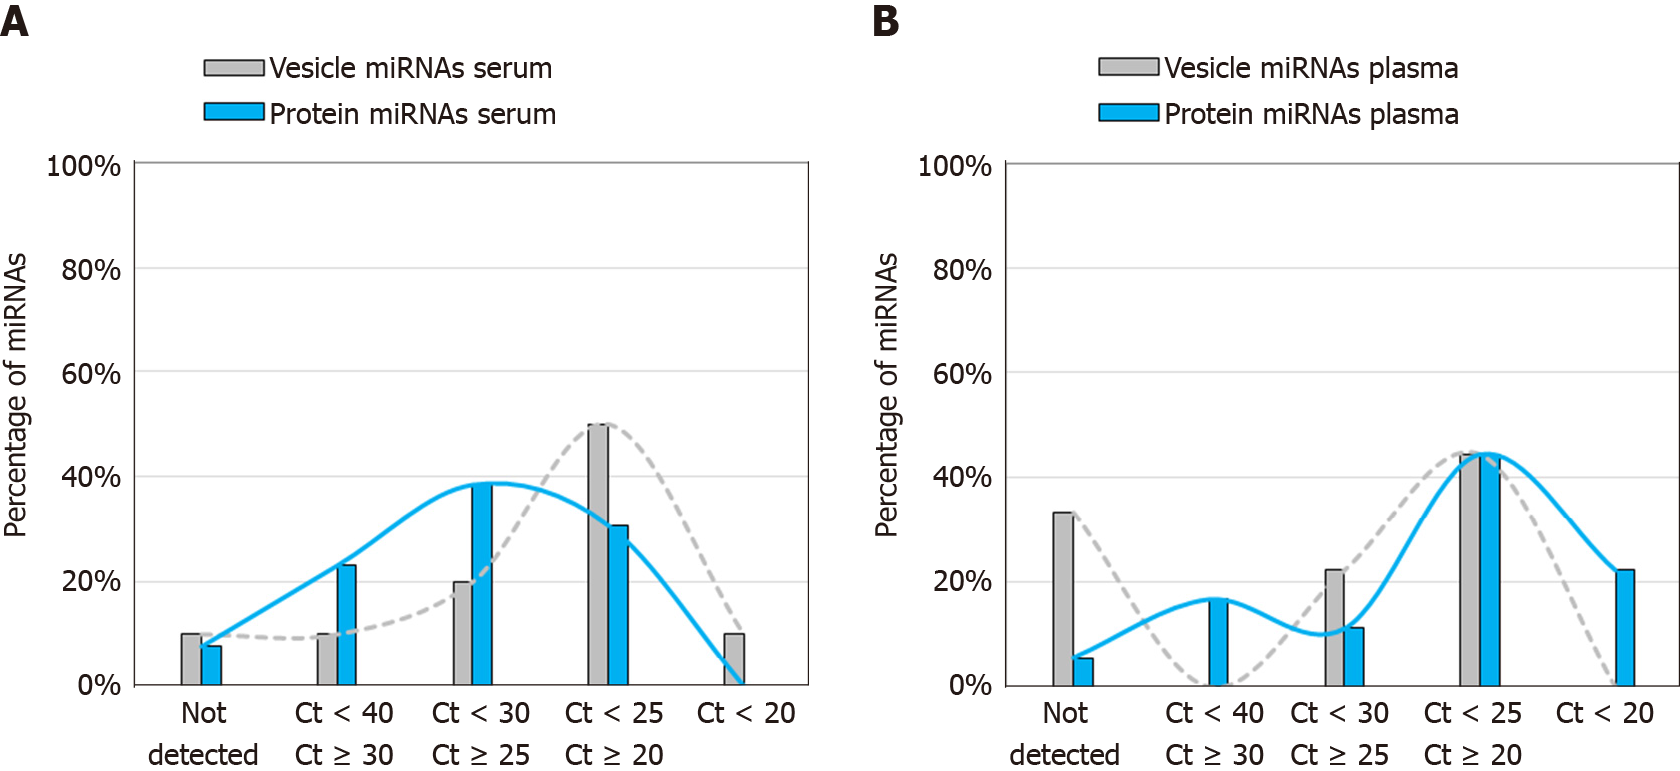
Figure 5 Percentage of vesicle-associated (grey) and protein-associated (blue) microRNAs expressed at levels within the indicated cycle threshold range in small extracellular vesicle preparations from healthy controls.
A: Serum; B: Plasma. The list of vesicle-associated and protein-associated miRNAs assessed in the serum and plasma were derived from Arroyo et al[13]. The bar graphs represent the percentage of microRNAs (miRNAs) within each cycle threshold range out of the total vesicle-associated miRNAs or protein-associated miRNAs assessed respectively in each sample type. Smoothed lines were added to aid visualisation of the trends.
- Citation: Chiam K, Mayne GC, Wang T, Watson DI, Irvine TS, Bright T, Smith LT, Ball IA, Bowen JM, Keefe DM, Thompson SK, Hussey DJ. Serum outperforms plasma in small extracellular vesicle microRNA biomarker studies of adenocarcinoma of the esophagus. World J Gastroenterol 2020; 26(20): 2570-2583
- URL: https://www.wjgnet.com/1007-9327/full/v26/i20/2570.htm
- DOI: https://dx.doi.org/10.3748/wjg.v26.i20.2570


