Published online Jun 28, 2017. doi: 10.3748/wjg.v23.i24.4437
Peer-review started: November 22, 2016
First decision: December 19, 2016
Revised: January 18, 2017
Accepted: March 15, 2017
Article in press: March 15, 2017
Published online: June 28, 2017
Processing time: 217 Days and 17.1 Hours
To verify the precision and accuracy of transglutaminase antibodies (TGA) assays across Mediterranean countries.
This study involved 8 referral centres for celiac disease (CD) in 7 Mediterranean countries. A central laboratory prepared 8 kits of 7 blinded and randomized serum samples, with a titrated amount of Human TGA IgA. Each sample was analysed three times on three different days, with each centre running a total of 21 tests. The results were included in a blindly coded report form, which was sent to the coordinator centre. The coordinator estimated the mean coefficient of Variation (CoVar = σ/μ), the mean accuracy (Accur = Vobserved - Vreal) and the mean percent variation (Var% = [(Vobserved - Vreal)/Vreal] × 100).
The analysis showed that 79.17% of the mean variation fell between -25% and +25% of the expected value, with the accuracy and precision progressively increasing with higher titres of TGA. From values 1.25 times greater than the normal cut-off, the measurements were highly reliable.
TGA estimation is a crucial step for the diagnosis of CD; given its accuracy and precision, clinicians could be confident in establishing a diagnosis.
Core tip: The “epidemic” of celiac disease (CD) across Mediterranean countries stimulated the need to standardize commonly used diagnostic tests. The titre of anti-transglutaminase antibodies has a strong relevance in the diagnosis of CD as defined by the ESPGHAN criteria; few studies, at the moment, estimated the variability of the main diagnostic tool for CD, in terms of accuracy and precision. Our study represents the first quality control work on this subject, with strong implication especially in countries with limited resources, where duodenal biopsy is not so easily performed.
- Citation: Smarrazzo A, Magazzù G, Ben-Hariz M, Legarda Tamara M, Velmishi V, Roma E, Kansu A, Mičetić-Turk D, Bravi E, Stellato P, Arcidiaco C, Greco L. Variability of anti-human transglutaminase testing in celiac disease across Mediterranean countries. World J Gastroenterol 2017; 23(24): 4437-4443
- URL: https://www.wjgnet.com/1007-9327/full/v23/i24/4437.htm
- DOI: https://dx.doi.org/10.3748/wjg.v23.i24.4437
A progressive increase in the diagnosis of celiac disease (CD) has been recently observed across the Mediterranean Basin[1,2], as well in many other countries in the gluten-consuming world. Together with this “epidemic”, there is a need to standardize the diagnostic tests across the emerging countries. The International working group MEDICEL (Mediterranean Network for Food Induced Disease, http://www.medicel.unina.it) was set up in 2011 by a EUROPAID action, supported by the Italian Ministry of Health. Eighteen Mediterranean countries participate to the MEDICEL network, sharing the aim to develop local capacities to address the Coeliac Disease “epidemic”.
The recent European Society for Pediatric Gastroenterology, Hepatology and Nutrition (ESPGHAN) Diagnostic Guidelines[3] consider the possibility of diagnosing CD without a biopsy on the basis of the presence of clinical symptoms, compatible HLA, a positive EMA test and a high titre (× 10) of human anti-transglutaminase antibodies (TGA). The chance to avoid the requirement of expensive endoscopic procedures attracted extraordinary interest in the emerging countries, where the scarcity of resources in extended territories limited the possibility to diagnose and care for CD patients. Commercial ELISA kits to analyse TGA are more readily available, but the differences in their antigens and procedures requires an estimation of the variability of each method used in each country of the MEDICEL network.
ESPGHAN made a significant effort to estimate the variability of the TGA test across Europe, but only a few studies address specific measures of accuracy and precision[4]. We are also aware that the variability of a test is best evaluated “in-the-field”, not only in specialized referral centres.
The aim of this study is to verify the precision and accuracy of the estimation of TGA across Mediterranean countries.
The precision is the “convergence degree” (or dispersion) of the single values from the mean value; in other words, it is the variance, or the standard deviation, from the mean value.
The accuracy of a measurement is the difference between the observed value and the real value; it expresses how different are the real and the measured values; note that this is a qualitative value that depends on both casual and systematic errors.
A measurement is therefore more precise when upon repeating the test, all the results are strictly close to a mean value, irrespective of the difference from the real value. Accuracy, instead, represents the amount of systematic error during the measurement; a test is accurate when the mean result is close to the real value.
A central laboratory prepared sets of 7 blinded and randomized serum samples, with a known titrated amount of TGA, obtained by progressive dilution of pooled human samples. Each centre received 7 vials: 5 of these were marked with the codes “S1”, “S2”, “S3”, “S4”, “S5”; the other 2 were a positive and a negative control. The vials S1-5 were all made from a serum highly positive for TGA; this serum is periodically controlled by the manufacturer to verify its concentration, comparing it with other certified lots of sera.
From this serum, by a progressive dilution, the S5 sample (with a final concentration of 100 IU/mL, verified by titration) was produced; the other samples were obtained by the dilution of this solution. The positive and the negative controls were obtained from a highly positive serum diluted to a concentration between 40 IU/mL and 80 IU/mL (for the positive one) and below 5 IU/mL (for the negative one).
To prepare the samples for the analysis, with no need for further dilution, the samples were diluted with the same buffer solution used during all the processes. The composition of this solution guarantees that all the essential reactives, such as calcium, needed for the correct function of TGA, are present in adequate amounts.
Due to these high dilutions, EMA testing was not technically performable.
No abnormal or out-of-range results were obtained, so no data were excluded.
To compare the results obtained from different laboratories and kits, we standardized all the results using the manufacturer’s scale as a reference scale; to this end, all results were divided by the specific cut-off value and then multiplied by the cut-off value of the reference kit. The list of the kits used by each centre is presented in Table 1.
| Centre | Kit (Manufacturer) | Cut-off |
| Naples | Anti-Tissue Transglutaminase IgA (Delta Biologicals) | 7 U/mL |
| Spain | Elia Celikey IgA (Phadia, Thermofisher) | 7 U/mL |
| Messina | Transglutaminasi Umana IgA | 3 U/mL |
| (IPR - Immuno Pharmacology Research s.r.l) | ||
| Albania | Celiac Ttg IgA (Immco Diagnostic, Hague Netherlands) | 25 EU/mL |
| Slovenia | Eu-Ttg IgA (Eurospital) | 16 U/mL |
| Tunisia | Quanta Lite® R H-Ttg Elisa (Inova Diagnostics) | 10 U/mL |
| Turkey | Anti-Tissue Transglutaminase IgA (Orgentec) | 10 U/mL |
| Greece | Quanta Lite® H-Ttg Elisa (Inova Diagnostics) | 20 U/mL |
Only the manufacturer laboratory knew the concentration of each specific vial, ranging from 1 IU/mL to 100 IU/mL. It should be noted that the manufacturer’s reference kit has a positivity cut-off value of 16 IU/mL.
Each centre received detailed instructions for the storage and processing of the samples. No dilution was needed (the samples were ready to be analysed, preferably with a manual analysis to avoid automatic dilution during machine-mediated measurements). The vials were in a white box, without labels, and each box was randomly chosen by each centre.
Analyses were performed three times for each sample on three different days, with each centre running a total of 21 analyses. The results were inserted in an anonymous report form that was labelled only with a code present in each box of samples. The report forms were then sent to the coordinator centre. The Coordinator centre collected all the results and performed the statistical analysis. SPSS Statistics 19 (International Business Machines Corp., IBM®) was used for this purpose.
Although standard deviation is the common parameter of variability, the precision is better explained by the coefficient of variation (CoVar), which is the ratio between the standard deviation and the average value of all measures and is usually expressed as a percentage (1):
(1) CoVar = σ/μ
The higher the precision, the lower the coefficient of variation.
There are two different ways to explain the accuracy; an easy and intuitive way is the arithmetical difference between the observed (Vo) and the real value (Vr) (2). Another way is the percent variation, calculated as shown in (3).
(2) Accur = Vo - Vr
(3) Var% = [(Vo - Vr)/Vr]*100
The greater the accuracy, the closer these values are to zero.
Since antibodies do not have a normal distribution, we transformed the raw data into a decimal logarithm.
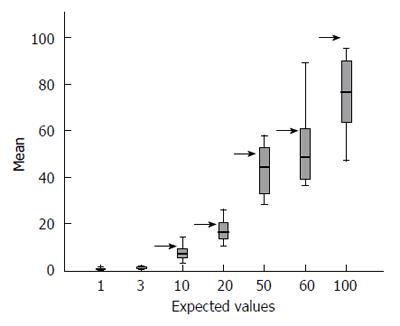
Overall, the means of the observed values are below the expected standard values, and observing the distribution of the values across all centres with their interquartile ranges stratified according to each expected value (see Table 2 for row data and Figure 1 for a graphical representation), the spread of the raw data around the mean appears to increase with increasing standard value.
| Expected values | 1 | 3 | 10 | 20 | 50 | 60 | 100 |
| Naples | 0.23 | 0.76 | 10.67 | 19.50 | 48.99 | 59.66 | 91.12 |
| Spain | 0.16 | 0.69 | 7.73 | 16.32 | 34.13 | 62.13 | 67.73 |
| Messina | 1.60 | 1.97 | 3.04 | 21.17 | 57.87 | 52.75 | 95.25 |
| Albania | 0.77 | 1.01 | 6.22 | 15.25 | 44.27 | 44.12 | 62.61 |
| Slovenia | 0.10 | 0.70 | 8.10 | 16.73 | 44.30 | 41.33 | 89.2 |
| Greece | 0.83 | 1.76 | 14.13 | 25.97 | 56.99 | 89.12 | 86.05 |
| Tunisia | 0.16 | 0.16 | 4.48 | 10.56 | 31.68 | 36.69 | 64.85 |
| Turkey | 0.21 | 0.53 | 5.76 | 11.89 | 28.27 | 37.12 | 47.09 |
| MEAN | 0.51 | 0.95 | 7.52 | 17.17 | 43.31 | 52.87 | 75.49 |
| SD | 0.53 | 0.62 | 3.55 | 5.00 | 11.21 | 17.59 | 17.24 |
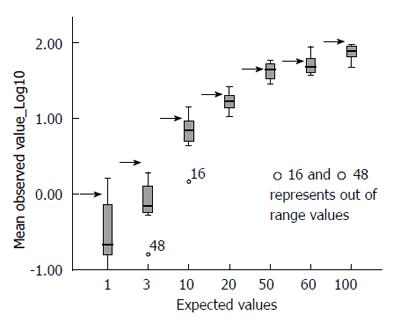
The picture changed completely when the raw data were correctly converted into their decimal logarithm (Figure 2): there is significantly more variability at the lower values of TGA (below 20 IU/mL) than at higher values (above 20 IU/mL). At or after 50 IU/mL, the interquartile range of the observed values is less than half that observed for low titres.
Around the level of 20 IU/mL (approximately 1.25 times the cut-off value of the reference kit), the variability range becomes progressively narrower; when the observed values, across all centres, are 1.25 or more times the local threshold of normality, the dispersion range of the values indicates considerable precision (± 9.03% of the logarithmic value, 95%CI). The systematic underestimation of the expected value is clearly shown in this figure; overall, the expected value is plotted at the upper quartile of the observed value.
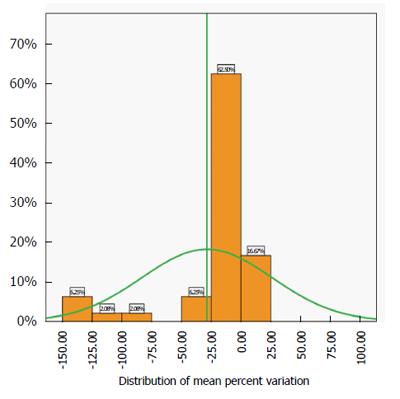
The best estimate of the accuracy of the test is the distribution of the mean percent variation of the pooled data across centres and values (Figure 3).
This distribution is close to normality (Kolmogorov-Smirnoff test of normality P > 0.5) and the spread is not very large. The analysis shows that 79.17% of the mean variation is between -25% and +25% of the expected value, confirming the spread of the interquartile ranges shown in Figure 2.
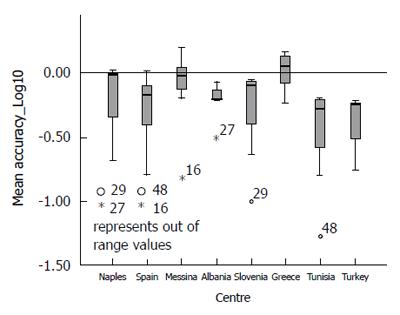
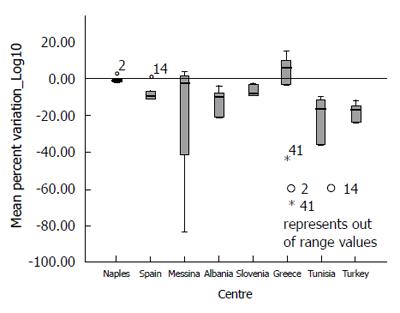
Analysing the distribution of accuracy (Vo - Ve) and Mean Percent Variation by each participating centre (Figures 4 and 5), it could be observed that only the Greek centre constantly shows values above the expected, while across all other centres, there is a systematic underestimation of the expected values (for more detail see Supplementary Table 1).
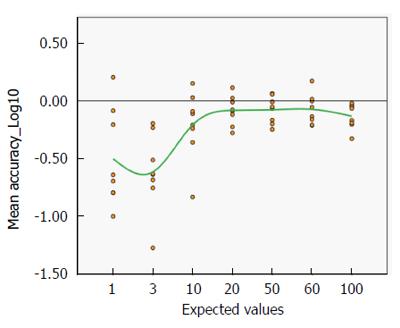
It could also be clearly seen that the variation of the distribution of the accuracy is very large for low values, but above the expected value of 10 IU/mL the degree of variation is remarkably reassuring (Figure 6). A progressive improvement (from -61.54% with a real value of 3 to -7.41% with a real value of 60 IU/mL, see also Supplementary Table 2) is clearly associated with increasing antibody titre.
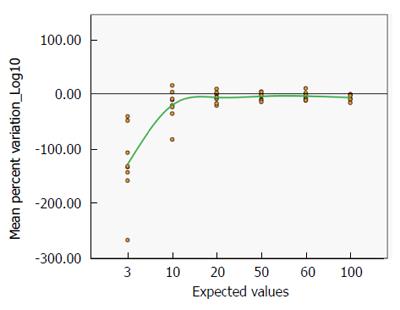
This result is supported by the distribution of the mean percent variation by the expected values (Figure 7), which similarly improves with increasing TGA titre (from -128.99% with a real value of 3 to -6.68% with a real value of 100 IU/mL, see Supplementary Table 2).
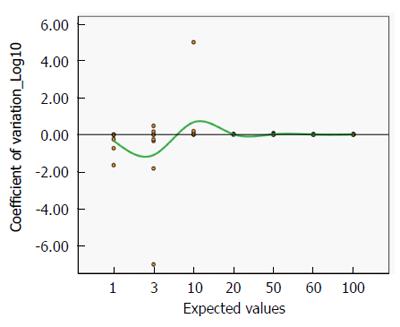
Figure 8 shows the mean coefficient of variation plotted on a logarithmic scale, as the best estimate of precision. Even for lower titres, the coefficient is always close to zero, indicating a satisfactorily high precision (Mean CoVar = -0.1).
Starting from this basis, through inductive reasoning, it can be assumed that for lower antibody titres, especially for negative-borderline levels (3-10 IU/mL), the TGA dosage value provided by the assay is still inaccurate (with a tendency toward underestimation); the progressive improvements in the accuracy index with higher antibody titres confirm this assumption (note also the progressive reduction in the dispersion range, which is represented by the column width in Figure 2).
This suggests that a borderline result could be, instead, a positive one because of underestimation. Therefore, more attention and clinical significance must be conferred to borderline results.
The overall picture of the variability of the TGA assay across different methods and in very different settings across Mediterranean countries is quite reassuring, but the observed variability should be translated into clinical practice.
Considering the standard error of the mean of the observed values (Supplementary Table 2), when a patient produces TGA antibody levels equal to or higher than 1.25 times the cut-off value (generally over 20 IU/mL), the range of possible reported values is ± 24.3%(ranging from 15.14 to 24.86 IU/mL).
If a patient has a real value of 50 IU/mL, the range of possible reported values is from 39.18 to 60.81 IU/mL (± 21.63%). In both these very common cases, the variability of the estimate would have no clinical significance because they are all robustly positive values.
However, if a patient has a real TGA level of just above the cut-off value (let us say 10 or 15 IU/mL), the variability of approximately 30%-40% may push the patient from a negative or an indeterminate value (6.05 or 10.21 IU/mL, respectively) to an indeterminate or a definitively positive value (13.95 or 19.78 IU/mL, respectively).
TGA estimation is a crucial step in the diagnosis of CD, and it is considerably more important in emerging countries, where the resources that are necessary to guarantee a safe endoscopy and a histopathological analysis are not readily available. Since the new ESPGHAN diagnostic protocol made avoiding a small bowel biopsy possible in a sizeable percentage of patients (estimated to be from 30% to 50%), with significant expansion in the methods of diagnosing CD, it is essential to estimate the reliability of TGA assays. Unfortunately, the data on the reliability of TGA estimation are currently limited to highly specialized centres participating in the advanced European network[3]. Ours is the first study that aims to estimate the precision and the accuracy of the assays not only “in the field” but in most countries of the Mediterranean Basin. A similar study was performed in 2009 in the United States[4] but, in this earlier work, real human sera (not ready for use and so at risk for altered results due to automatic dilutions or other components of the sera) were used; furthermore, commercial laboratories were involved in the study (not only referral centres) that were not all using the same technical methods (16 used ELISAs, and 5 used radio-binding assays), and the study was aimed at determining the differences in specificity and sensitivity and the correlation between laboratories. Another working group in Europe raised the problem of the accuracy of TGA assays (and in the interpretation of their results) in 2015[5] and then directed its interest toward the neo-epitope tTg (tTg-neo) autoantibody[6], which currently lacks a diagnostic role in the Guidelines and is still not widely available, even in referral centres.
The average of the observed values across the 8 centres participating in this study tends to underestimate the value proposed by the provider as the reference standard. The underestimation is, on average, approximately 30%-40% of the expected value. This underestimation, however, does not interfere with the aim of our work, which is to analyse the variability of the assay among centres, which is the factor that is then applied to the bedside. We suggest that our observed mean values, obtained from 168 estimations, are closer to the “true” TGA titre than the manufacturer’s reference standard provided for this study. Indeed, the reference samples were obtained by accurate progressive dilution of a pooled sample; hence a minute variability in the starting sample, before dilution (for example, estimated value 120 vs true value 115) would have produced a progressive increasing error of estimates across dilutions, but again, this is not relevant to our study.
The dispersion of the TGA values around the reference value is moderate (79.17% are ± 25%), but even more important, the accuracy and the precision of the analysis progressively improve with increasing TGA titre: the dispersion of the TGA values is quite large for low TGA titres (ranging from -61.54% to -20.84% for 3 IU/mL and from -1.1 to 0.67 for 10 IU/mL); values above 20 IU/mL provide reliable results across all centres, with an Accuracy ranging from -8.29% (at 20 IU/mL) to -7.41% (at 60 IU/mL) and a Precision ranging from -0.02 (at 20 IU/mL) to -0.0095 (at 60 IU/mL). Thus, TGA could be considered a reliable basis for the diagnosis of CD, in light of its robust estimation across Mediterranean countries.
This contribution aims to provide the paediatrician and gastroenterologist with a safe, specific and sensitive diagnostic test with which to uncover that large number of coeliac patients who remain undiagnosed at present. In the next 10 years, at least 5 million individuals in Mediterranean countries[1,2] might benefit from the accuracy of TGA estimation, especially in light of the direct correlation between TGA titre and villous atrophy[7].
The quality of a diagnostic tool (i.e., its accuracy and precision) affects not only the patient but also the National Health System; a reliable diagnostic tool implies a reduction in the time to and in the cost of diagnosis. It is also important for clinical trials, and even more so for multicentre studies, in which working with better tools could improve the quality of the study and the relevance of the scientific conclusions.
Thanks to Giovanni Currò, PhD, who gave significant contribution in performing the analyses.
Celiac disease (CD) is an immune-mediated disorder with a prevalence of 1%-2% in the general population, and an incidence with an increasing trend in the last 20 years. The cumulative incidence in children at age 5 ranges between 0.089 and 9 cases per 1000 live births while in adults varied from lows of 1.27 to a high of 17.2 cases per 100000 patient years. In the recent years, a significant increase in the incidence of celiac disease has been recorded in the Mediterranean area; to face this “epidemic” diffusion a simple and accurate diagnosis is needed.
The 2012 ESPGHAN guidelines clearly identify the diagnostic criteria for symptomatic and asymptomatic children or adolescents, giving a central role to the anti-transglutaminase antibodies (TGA) dosage in the diagnosis. In recent years, several new biomarkers have been studied for the diagnosis of CD but, nowadays, the greatest progresses affect the increase of the precision of the anti-transglutaminase assay. The main point of this paper is to reinforce the validity of TGA dosage for the diagnosis of CD.
This study is the first quality control study in the Mediterranean area, and clearly shows that the TGA dosage is a precise and accurate method for the diagnosis of CD already for values greater than 1.25 times the cutoff. This appears of great importance especially in countries in which the duodenal biopsy is not always easy to perform.
This study explored the precision and accuracy of the estimation of TGA across Mediterranean countries and it provides important data on the reliability of this method, with strong implications for all pediatric gastroenterologist and clinicians who face with this diagnosis.
CD is an immune-mediated systemic disorder related to gluten ingestion in genetic susceptible subjects; it is characterized by the presence of anti-transglutaminase antibodies, as serological biomarker. We investigated two properties of this biomarker, the precision and the accuracy. Precision is the “convergence degree” (or dispersion) of the single values from the mean value; in other words, it is the variance, or the standard deviation, from the mean value. Accuracy is the difference between the observed value and the real value; it expresses how different are the real and the measured values.
The authors have evaluated the accuracy of various commercially available TGA kits across different Mediterranean countries. Knowing that TGA values can be determined accurately is important for the use of TGA testing in CD diagnosis, and the study therefore provides useful information for the evaluation of clinical guidelines.
Manuscript source: Unsolicited manuscript
Specialty type: Gastroenterology and hepatology
Country of origin: Italy
Peer-review report classification
Grade A (Excellent): 0
Grade B (Very good): B
Grade C (Good): C, C, C
Grade D (Fair): 0
Grade E (Poor): 0
P- Reviewer: Ierardi E, Iversen R, Garcia-Olmo D, Tapsas D S- Editor: Gong ZM L- Editor: A E- Editor: Wang CH
| 1. | Tucci F, Astarita L, Abkari A, Abu-Zekry M, Attard T, Ben Hariz M, Bilbao JR, Boudraa G, Boukthir S, Costa S. Celiac disease in the Mediterranean area. BMC Gastroenterol. 2014;14:24. [RCA] [PubMed] [DOI] [Full Text] [Full Text (PDF)] [Cited by in Crossref: 13] [Cited by in RCA: 16] [Article Influence: 1.5] [Reference Citation Analysis (0)] |
| 2. | Greco L, Timpone L, Abkari A, Abu-Zekry M, Attard T, Bouguerrà F, Cullufi P, Kansu A, Micetic-Turk D, Mišak Z. Burden of celiac disease in the Mediterranean area. World J Gastroenterol. 2011;17:4971-4978. [RCA] [PubMed] [DOI] [Full Text] [Full Text (PDF)] [Cited by in CrossRef: 28] [Cited by in RCA: 31] [Article Influence: 2.2] [Reference Citation Analysis (0)] |
| 3. | Husby S, Koletzko S, Korponay-Szabó IR, Mearin ML, Phillips A, Shamir R, Troncone R, Giersiepen K, Branski D, Catassi C. European Society for Pediatric Gastroenterology, Hepatology, and Nutrition guidelines for the diagnosis of coeliac disease. J Pediatr Gastroenterol Nutr. 2012;54:136-160. [RCA] [PubMed] [DOI] [Full Text] [Cited by in Crossref: 1708] [Cited by in RCA: 1837] [Article Influence: 141.3] [Reference Citation Analysis (1)] |
| 4. | Li M, Yu L, Tiberti C, Bonamico M, Taki I, Miao D, Murray JA, Rewers MJ, Hoffenberg EJ, Agardh D. A report on the International Transglutaminase Autoantibody Workshop for Celiac Disease. Am J Gastroenterol. 2009;104:154-163. [RCA] [PubMed] [DOI] [Full Text] [Full Text (PDF)] [Cited by in Crossref: 109] [Cited by in RCA: 101] [Article Influence: 6.3] [Reference Citation Analysis (0)] |
| 5. | Lerner A, Jeremias P and Matthias T. Outside of Normal Limits: False Positive/Negative Anti-TG2 Autoantibodies. Int J Coeliac Dis. 2015;3:87-90. [RCA] [DOI] [Full Text] [Cited by in Crossref: 12] [Cited by in RCA: 12] [Article Influence: 1.3] [Reference Citation Analysis (0)] |
| 6. | Lerner A, Jeremias P, Neidhöfer S, Matthias T. Antibodies against neo-epitope tTg complexed to gliadin are different and more reliable then anti-tTg for the diagnosis of pediatric celiac disease. J Immunol Methods. 2016;429:15-20. [RCA] [PubMed] [DOI] [Full Text] [Cited by in Crossref: 21] [Cited by in RCA: 18] [Article Influence: 2.0] [Reference Citation Analysis (0)] |
| 7. | Beltran L, Koenig M, Egner W, Howard M, Butt A, Austin MR, Patel D, Sanderson RR, Goubet S, Saleh F. High-titre circulating tissue transglutaminase-2 antibodies predict small bowel villous atrophy, but decision cut-off limits must be locally validated. Clin Exp Immunol. 2014;176:190-198. [RCA] [PubMed] [DOI] [Full Text] [Cited by in Crossref: 35] [Cited by in RCA: 47] [Article Influence: 4.3] [Reference Citation Analysis (0)] |


