Published online May 21, 2014. doi: 10.3748/wjg.v20.i19.5849
Revised: January 19, 2014
Accepted: February 17, 2014
Published online: May 21, 2014
Processing time: 178 Days and 0.1 Hours
AIM: To implement high-throughput 16S rDNA sequencing to study microbial diversity in the fecal matter of rats with acute lung injury/acute respiratory distress syndrome (ALI/ARDS).
METHODS: Intratracheal instillation of lipopolysaccharide was used to induce ALI, and the pathological changes in the lungs and intestines were observed. D-lactate levels and diamine oxidase (DAO) activities were determined by enzymatic spectrophotometry. The fragments encompassing V4 16S rDNA hypervariable regions were PCR amplified from fecal samples, and the PCR products of V4 were sequenced by Illumina MiSeq.
RESULTS: Increased D-lactate levels and DAO activities were observed in the model group (P < 0.01). Sequencing results revealed the presence of 3780 and 4142 species in the control and model groups, respectively. The percentage of shared species was 18.8419%. Compared with the control group, the model group had a higher diversity index and a lower number of species of Fusobacteria (at the phylum level), Helicobacter and Roseburia (at the genus level) (P < 0.01). Differences in species diversity, structure, distribution and composition were found between the control group and early ARDS group.
CONCLUSION: The detection of specific bacteria allows early detection and diagnosis of ALI/ARDS.
Core tip: This experimental study evaluated the possible association between acute respiratory distress syndrome (ARDS) and intestinal microflora using an animal model and high-throughput sequencing analysis. Differences in species diversity, structure, distribution and composition were found between the control group and early ARDS group. This study contributes to a better understanding of the mechanisms by which changes in the intestinal mucosal barrier and host microflora may be involved in the pathogenesis of ARDS.
- Citation: Li Y, Liu XY, Ma MM, Qi ZJ, Zhang XQ, Li Z, Cao GH, Li J, Zhu WW, Wang XZ. Changes in intestinal microflora in rats with acute respiratory distress syndrome. World J Gastroenterol 2014; 20(19): 5849-5858
- URL: https://www.wjgnet.com/1007-9327/full/v20/i19/5849.htm
- DOI: https://dx.doi.org/10.3748/wjg.v20.i19.5849
Acute respiratory distress syndrome (ARDS) is a continuous pathological process, with acute lung injury (ALI) at its early stage. According to Ashbaugh et al[1], ARDS is characterized by alveolar epithelial and endothelial barrier disruption, significant inflammation, gas exchange dysfunction and severe respiratory failure. Despite remarkable progress in the pathophysiology and standard treatment (i.e., supportive mechanical ventilation) of ARDS, the mortality rate remains high at approximately 40%-60%[2,3], making it the leading factor contributing to the high morbidity and mortality of patients in the intensive care unit[4,5]. ARDS results from sepsis, trauma, gastric aspiration, and pneumonia[6]. The most common precipitating factor of ARDS is sepsis. In 1988, Wilmore et al[7] proposed that the intestine is the target organ of ARDS. The intestine is considered to be the largest repository of bacteria and endotoxins. A weak or damaged intestinal barrier triggers the translocation of intestinal bacteria or endotoxins, leading to sepsis. Multiple organ dysfunction syndrome (MODS) is triggered by the chain reaction of cytokines and other inflammatory mediators. The serum level of endotoxic lipopolysaccharides (LPS) from Gram-negative bacteria is a predictive or prognostic factor for ARDS. Intratracheal LPS instillation has been used to induce sepsis-related ALI/ARDS[8] in animal models.
Approximately 1013-1014 microbes thrive in the intestine and cohabit discretely with the mucosal immune system[9]. About 1000 species of bacteria live in the human intestine. This number of bacteria is 10 times that found in cells in the body; in addition, the number of bacterial genes is 100 times higher than the genes of the human host[10,11]. The effects of bacterial genes in the large intestine have become a central issue among microbiologists. Normal intestinal flora can prevent infections caused by pathogens, provide nutrients, such as vitamin B and vitamin K, participate in the metabolism of carbohydrates and proteins, shape the mucosal immune system and serve as a biological barrier[12-14]. High-throughput sequencing greatly contributes to research on the diversity of environmental microbes, including uncultured microorganisms and trace amounts of bacteria.
Intestinal damage triggers or aggravates ARDS or MODS. However, the mechanism by which the intestine changes its mucosal barrier and microflora during ARDS remains unclear. High-throughput sequencing has contributed greatly to the research on intestinal flora. Recent studies have employed high-throughput sequencing to reveal the specific relationship between diseases and intestinal flora[15-18]. The present study aimed to determine the relationship between ARDS and intestinal flora using high-throughput sequencing. This study will provide new insights and a possible experimental basis for the early detection and diagnosis of ARDS in the future.
Sixteen male Sprague-Dawley rats weighing approximately 230 g were randomly divided into two groups (n = 8 for each group): a control/normal group and a LPS/model group. All animals were housed in autoclaved cages with free access to laboratory food and water, and were exposed to alternate cycles of 12 h of light and darkness at room temperature (25 °C). All experimental procedures complied with the Declaration of Helsinki of the World Medical Association and the protocols were approved by the Institutional Animal Care and Use Committee of Binzhou Medical University. LPS (Escherichia coli LPS, 055:B5), D-lactate and diamine oxidase (DAO) kits were purchased from the Sigma Chemical Company (St. Louis, MO, United States).
The rats were fasted overnight and given ad libitum access to water. The rats were anesthetized with 40 mg/kg of chloral hydrate and then fixed on an operating table. LPS (10 mg/kg body weight) in phosphate-buffered saline (PBS) was instilled intratracheally to induce ALI[19]. The normal group underwent the same procedure, but with intratracheal instillation of PBS. All rats were anesthetized and killed after 24 h.
The water content of the lungs was evaluated by calculating the wet/dry weight ratio. The left cranial lobe was excised, rinsed in PBS, blotted and then weighed to obtain the wet weight. The lung was dried at 80 °C for 72 h to constant weight to obtain the dry weight. The wet/dry ratio was calculated by dividing the wet weight by the dry weight.
The rats were perfused with PBS via the pulmonary artery. As soon as the chest and abdominal cavities were excised, portions of the lungs were immediately removed and immersed in 4% paraformaldehyde for 72 h at room temperature. These portions were then processed and embedded in paraffin. Tissue sections (4 μm thick) were prepared by embedding in paraffin. After hematoxylin and eosin (HE) staining, the slides were observed under a light microscope. Six visual fields were randomly observed on a slide under × 400 magnification. The lung injury score (LIS) was assessed using the method described by Nishina et al[20]. Lung injury was assessed by alveolar congestion, hemorrhage, infiltration or aggregation of neutrophils in the airspace or vessel wall and thickness of the alveolar wall or hyaline membrane. The severity of lung injury was scored as follows: 0, minimum; 1, mild; 2, moderate; 3, severe; and 4, maximum. Six high-magnification fields were randomly selected and graded for the average LIS for each stained sample.
The intestines, from the ileum to 5 cm above the cecum, were acquired immediately after the rats were killed. Tissues for histopathology were fixed with 4% formaldehyde. Paraffin-embedded samples were cut and stained using HE to detect histopathological changes. Another set of paraffin-embedded samples was used to observe ultrastructural changes. The samples were cut into 1 mm × 1 mm × 1 mm sections, pre-fixed with 3% glutaraldehyde, fixed with 1% osmium tetroxide, dehydrated in acetone (50%, 70%, 90% and 100%) and then embedded in Epon 812. Semi-thin sections were used for optical positioning, whereas ultra-thin sections were used for double staining with uranyl acetate and lead citrate. The sections were observed by electron microscopy.
Plasma was harvested from the collected abdominal aortic blood and kept at -20 °C. Permeability of the intestinal mucosa was assayed by measuring D-lactate and DAO levels in the plasma. Plasma D-lactate levels were measured by enzymatic spectrophotometric assay as previously described[21]. Plasma DAO activities were also determined by enzymatic spectrophotometry as previously described[22].
Rat colons were immediately excised and fecal samples were harvested for microbial DNA extraction using a QIAamp DNA stool minikit (Qiagen, West Sussex, United Kingdom) following the manufacturer’s instructions. The quality and quantity of genomic DNA were assessed with a Nanodrop spectrophotometer, with the A260/A280 ratio between 1.8 and 2.0 considered a criterion for quality control. No obvious RNA banding was shown by gel electrophoresis, and genomic bands were clear and complete. DNA was frozen at -80 °C prior to PCR amplification.
Fragments encompassing V4 16S rDNA hypervariable regions were PCR amplified from each of the 6 DNA samples using fusion primers (forward: 5’-Index + AYTGGGYDTAAAGNG-3’, reverse: 5’-TACNVGGGTATCTAATCC-3’) and universal primers (forward: 5’-AYTGGGYDTAAAGNG-3’, reverse: 5’-TACNVGGGTATCTAATCC-3’).
The annealing temperature and extension time were 50 °C and 30 s, respectively. The PCR conditions were as follows: 94 °C for 5 min, 25 cycles of 94 °C for 30 s, annealing temperature for 30 s and 72 °C for 30 s, 72 °C for 7 min and holding at 4 °C. PCR products were excised from 1% agarose gels and purified using a QIA quick Gel Extraction Kit. The PCR products of V4 were sequenced by Illumina MiSeq.
Quantitative data are reported as mean ± standard error of the mean. Statistical differences in basal characteristics between the groups were calculated by one-way analysis of variance and t test for continuous variables. P < 0.05 was considered statistically significant. All statistical analyses were performed using the SPSS 16.0 software.
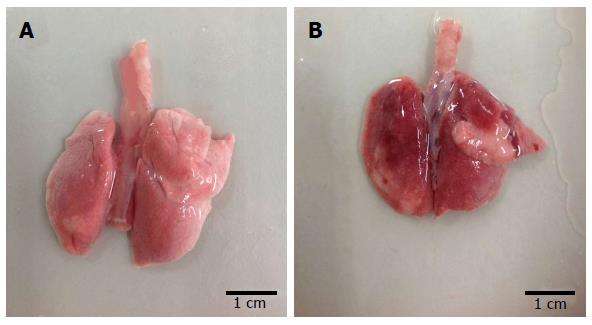
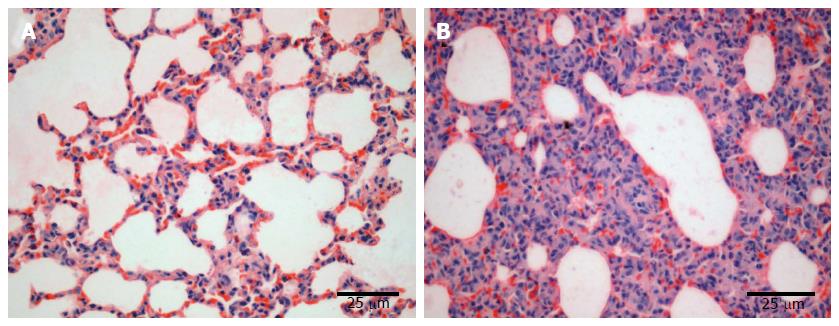
The lung tissue in the control group was pale pink with a smooth surface, good expansion, soft texture and no obvious abnormalities (Figure 1A). The lung tissue in the injury group appeared dark with sub-capsular hemorrhage, reddish liquid overflowing from the tangent plane and atelectasis (Figure 1B). The rats in the control group had slight pulmonary histological changes (Figure 2A), whereas those in the LPS group had the typical symptoms of ALI, with marked recruitment of neutrophils, alveolar hemorrhage and obvious alveolar wall thickening (Figure 2B).
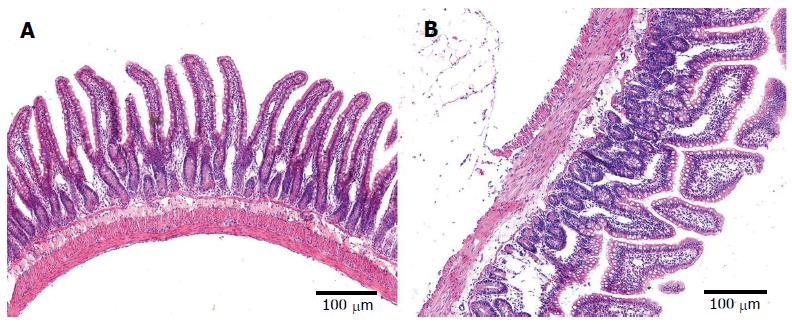
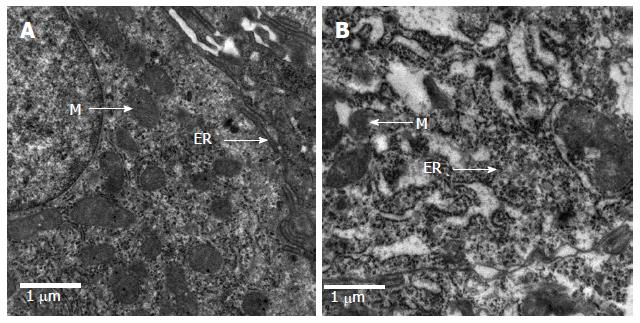
The epithelial cells of rats in the control group showed normal morphological characteristics, including a neatly arranged brush border, alternating cup-shaped cells and uniform cell size as observed under an optical microscope (Figure 3A). Ultrastructure was visible with normal mitochondria and endoplasmic reticulum (Figure 4A). In contrast, the epithelial cells of rats in the model group showed disorganized intestinal villi under a light microscope (Figure 3B) and slightly swollen mitochondria with a non-compact structure, expanded endoplasmic reticulum, structurally disordered cells and other cell damage, as observed by electron microscopy (Figure 4B).
The average LIS in the model group was significantly higher than that in the control group (P < 0.01) (Table 1). The wet/dry ratio significantly increased in the model group compared with the control group (P < 0.05) (Table 1). These two factors, together with pulmonary histopathology, demonstrated the successful ALI modeling.
Plasma D-lactate and DAO levels can reflect the presence of intestinal injuries, including intestinal mucosal barrier damage after ARDS. The levels of DAO and D-lactate significantly increased in the ALI group (11.79 ± 2.542 U/L and 619 ± 31.46 μg/L) compared with those in the normal group (3.14 ± 1.193 U/L and 561 ± 18.22 μg/L) (P < 0.01) (Table 1). These data suggest that the mucosal barrier was damaged.
Flash software was used to control the quality of the raw data by truncating or abandoning low-quality sequences. The ends of the corresponding sequences were connected. The sequences which were unable to connect were abandoned. According to the experimental requirements, the connected sequences were filtered for analysis. A total of 104 742 V4 16S rDNA sequence reads from the six samples, with an average of 17 457 sequence reads for each sample (the minimum and maximum numbers of reads per sample were 9170 and 29700, respectively), were used in this analysis. The average length of the sequence reads was 225 bp, and they were classified into different taxonomic categories using MGRAST[15].
According to the sequence similarity (> 97%), high-quality sequences were classified into multiple operational taxonomic units (OTUs) using Qiime to facilitate analysis. The OTU in each sample and the number of sequences in each OTU were counted to obtain the taxonomic information of the OTU. The taxon abundance of each sample was generated into 15 phyla, 27 classes, 48 orders, 71 families and 120 genera using mainly the RDP, Greengenes and SSU databases. Up to 3780 and 4142 species were found in the normal and model groups, respectively. The two groups shared 1256 (18.8419%) species, and the total richness for all groups was 6666.
Alpha diversity refers to the diversity in a specific area or ecosystem in terms of species richness. According to species richness in the list of OTUs in the sample, diversity, richness, coverage and evenness estimations were calculated for all data sets using Mother software. The Chao/Ace calculation is an estimator of phylotype richness, and the Shannon index of diversity reflects both the richness and community evenness. The model group had a higher richness index (Chao, 4940.6 and ACE, 9400.3) and lower diversity index (4.97) than the normal group (Chao, 4860.3, ACE, 8761.6 and Shannon, 5.09). These results suggested that the model group had higher levels of biodiversity and unevenness estimations than the normal group. Good’s coverage, a measure of sampling completeness, ranged between 92.1% and 92.7% for the data sets at a 97% similarity level (Table 2).
| Group | Chao | Ace | Shannon | Coverage |
| Normal | 4860.3 | 8761.6 | 5.09 | 0.921 |
| Model | 4940.6 | 9400.3 | 4.97 | 0.927 |
Fifteen phyla and 120 genera in total were found between the two groups. Compared with the normal group, the model group had a two-fold lower number of species of Spirochaetes, Fusobacteria and Deinococcus-Thermus [log2(DN/DM) > 1], but a higher number of species of Verrucomicrobia, Actinobacteria, Planctomycetes and Euryarchaeota [log2(DN/DM)< -1]. A significant difference in the number of species of Fusobacteria was found between the two groups (P < 0.05) (Table 3 and Figure 5A). Compared with the control group, the model group had more than a two-fold lower number of species of 25 genera, including Anaeroplasma, Desulfovibrio, Fusobacterium, Helicobacter, Roseburia and Sporobacter, but more than twice the number of species of 32 genera, including Aerococcus, Bifidobacterium, Coprococcus, Escherichia, Lactobacillus and Proteus. Significant differences in the number of species of Helicobacter and Roseburia were found between the two groups (P < 0.05) (Table 4 and Figure 5B). In the model group, the percentages of species that was more than two-fold lower and higher were 20% and 27% at the phylum level and 32% and 41% at the genus level compared with the normal group, while the percentages of species that was less than twice were 53% and 27% at the phylum and genus levels, respectively (Figure 5C).
| Log2 (N/M) | Taxon |
| Log2 (N/M)> 1 3 | Bacteria; Deinococcus-Thermus |
| Bacteria; Fusobacteriaa | |
| Bacteria; Spirochaetes | |
| Log2 (N/M)<-1 4 | Archaea; Euryarchaeota |
| Bacteria; Actinobacteria | |
| Bacteria; Planctomycetes | |
| Bacteria; Verrucomicrobia |
| Log2 (N/M) | Taxon |
| Log2 (N/M) > 1 25 | Bacteria; Tenericutes; Mollicutes; Anaeroplasmatales; Anaeroplasmataceae; Anaeroplasma |
| Bacteria; Spirochaetes; Spirochaetes; Spirochaetales; Brachyspiraceae; Brachyspira | |
| Bacteria; Bacteroidetes; Bacteroidia; Bacteroidales; Porphyromonadaceae; Butyricimonas | |
| Bacteria; Proteobacteria; Alphaproteobacteria; Caulobacterales; Caulobacteraceae; Caulobacter | |
| Bacteria; Bacteroidetes; Flavobacteria; Flavobacteriales; Flavobacteriaceae; Chryseobacterium | |
| Bacteria; Proteobacteria; Deltaproteobacteria; Desulfovibrionales; Desulfovibrionaceae; Desulfovibrio | |
| Bacteria; Proteobacteria; Gammaproteobacteria; Pseudomonadales; Moraxellaceae; Enhydrobacter | |
| Bacteria; Firmicutes; Clostridia; Clostridiales; Eubacteriaceae; Eubacterium | |
| Bacteria; Fusobacteria; Fusobacteria; Fusobacteriales; Fusobacteriaceae; Fusobacterium | |
| Bacteria; Proteobacteria; Epsilonproteobacteria; Campylobacterales; Helicobacteraceae; Helicobactera | |
| Bacteria; Aquificae; Aquificae; Aquificales; Aquificaceae; Hydrogenobacter | |
| Bacteria; Proteobacteria; Betaproteobacteria; Burkholderiales; Burkholderiaceae; Limnobacter | |
| Bacteria; Proteobacteria; Gammaproteobacteria; Pasteurellales; Pasteurellaceae; Mannheimia | |
| Bacteria; Proteobacteria; Betaproteobacteria; Methylophilales; Methylophilaceae; Methylophilus | |
| Bacteria; Proteobacteria; Gammaproteobacteria; Enterobacteriales; Enterobacteriaceae; Morganella | |
| Bacteria; Firmicutes; Clostridia; Clostridiales; Lachnospiraceae; Parasporobacterium | |
| Bacteria; Proteobacteria; Gammaproteobacteria; Pseudomonadales; Pseudomonadaceae; Pseudomonas | |
| Bacteria; Firmicutes; Clostridia; Clostridiales; Lachnospiraceae; Robinsoniella | |
| Bacteria; Firmicutes; Clostridia; Clostridiales; Lachnospiraceae; Roseburiac | |
| Bacteria; Actinobacteria; Actinobacteria; Actinomycetales; Micrococcaceae; Rothia | |
| Bacteria; Firmicutes; Erysipelotrichi; Erysipelotrichales; Erysipelotrichaceae; Sharpea | |
| Bacteria; Proteobacteria; Alphaproteobacteria; Sphingomonadales; Sphingomonadaceae; Sphingomonas | |
| Bacteria; Firmicutes; Clostridia; Clostridiales; Ruminococcaceae; Sporobacter | |
| Bacteria; Deinococcus-Thermus; Deinococci; Thermales; Thermaceae; Thermus | |
| Log2(N/M) <-1 32 | Bacteria; Firmicutes; Clostridia; Clostridiales; Veillonellaceae; Veillonella |
| Bacteria; Firmicutes; Bacilli; Lactobacillales; Aerococcaceae; Aerococcus | |
| Bacteria; Verrucomicrobia; Verrucomicrobiae; Verrucomicrobiales; Verrucomicrobiaceae; Akkermansia | |
| Bacteria; Bacteroidetes; Bacteroidia; Bacteroidales; Rikenellaceae; Alistipes | |
| Bacteria; Firmicutes; Erysipelotrichi; Erysipelotrichales; Erysipelotrichaceae; Allobaculum | |
| Bacteria; Proteobacteria; Alphaproteobacteria; Rhizobiales; Phyllobacteriaceae; Aminobacter | |
| Bacteria; Firmicutes; Clostridia; Clostridiales; Eubacteriaceae; Anaerofustis | |
| Bacteria; Firmicutes; Clostridia; Clostridiales; Lachnospiraceae; Anaerosporobacter | |
| Bacteria; Firmicutes; Clostridia; Clostridiales; Ruminococcaceae; Anaerotruncus | |
| Bacteria; Actinobacteria; Actinobacteria; Bifidobacteriales; Bifidobacteriaceae; Bifidobacterium | |
| Bacteria; Proteobacteria; Alphaproteobacteria; Rhizobiales; Bradyrhizobiaceae; Bradyrhizobium | |
| Bacteria; Actinobacteria; Actinobacteria; Actinomycetales; Brevibacteriaceae; Brevibacterium | |
| Bacteria; Proteobacteria; Alphaproteobacteria; Caulobacterales; Caulobacteraceae; Brevundimonas | |
| Bacteria; Firmicutes; Clostridia; Clostridiales; Ruminococcaceae; Butyricicoccus | |
| Bacteria; Firmicutes; Clostridia; Clostridiales; Clostridiaceae; Clostridium | |
| Bacteria; Firmicutes; Erysipelotrichi; Erysipelotrichales; Erysipelotrichaceae; Coprobacillus | |
| Bacteria; Firmicutes; Clostridia; Clostridiales; Lachnospiraceae; Coprococcus | |
| Bacteria; Actinobacteria; Actinobacteria; Actinomycetales; Corynebacteriaceae; Corynebacterium | |
| Bacteria; Actinobacteria; Actinobacteria; Coriobacteriales; Coriobacteriaceae; Enterorhabdus | |
| Bacteria; Proteobacteria; Gammaproteobacteria; Enterobacteriales; Enterobacteriaceae; Escherichia/Shigella | |
| Bacteria; Firmicutes; Clostridia; Clostridiales; Ruminococcaceae; Faecalibacterium | |
| Bacteria; Firmicutes; Bacilli; Lactobacillales; Lactobacillaceae; Lactobacillus | |
| Archaea; Euryarchaeota; Methanobacteria; Methanobacteriales; Methanobacteriaceae; Methanobrevibacter | |
| Bacteria; Firmicutes; Clostridia; Clostridiales; Incertae Sedis XIII; Mogibacterium | |
| Bacteria; Tenericutes; Mollicutes; Mycoplasmatales; Mycoplasmataceae; Mycoplasma | |
| Bacteria; Proteobacteria; Betaproteobacteria; Neisseriales; Neisseriaceae; Neisseria | |
| Bacteria; Firmicutes; Bacilli; Bacillales; Staphylococcaceae; Nosocomiicoccus | |
| Bacteria; Bacteroidetes; Bacteroidia; Bacteroidales; Porphyromonadaceae; Odoribacter | |
| Bacteria; Bacteroidetes; Bacteroidia; Bacteroidales; Prevotellaceae; Paraprevotella | |
| Bacteria; Proteobacteria; Gammaproteobacteria; Enterobacteriales; Enterobacteriaceae; Proteus | |
| Bacteria; Firmicutes; Clostridia; Clostridiales; Ruminococcaceae; Ruminococcus | |
| Bacteria; Firmicutes; Bacilli; Bacillales; Staphylococcaceae; Staphylococcus | |
| Bacteria; Firmicutes; Erysipelotrichi; Erysipelotrichales; Erysipelotrichaceae; Turicibacter |
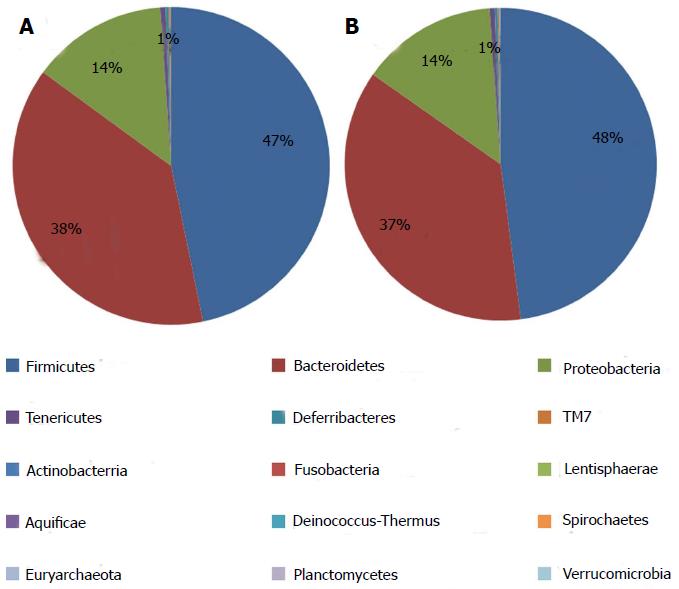
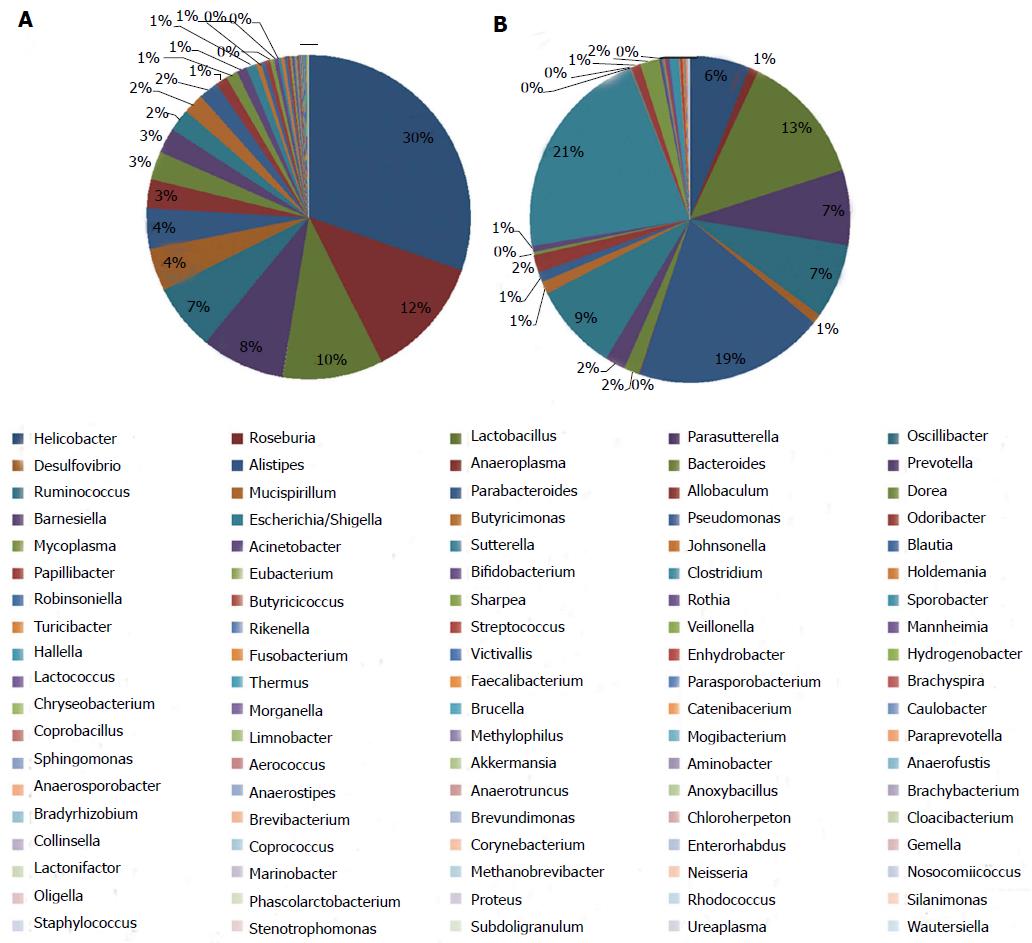
The information on classification and abundance in the OTU list and the map pie chart on each species distribution were sorted. At the phylum level, 15 phyla were found in both groups. In the normal group, Firmicutes, Bacteroidetes, Proteobacteria, Tenericutes, Deferribacteres, TM7, Actinobacteria, Lentisphaerae, Aquificae, Fusobacteria, Deinococcus-Thermus and Spirochaetes were found, whereas in the model group, Euryarchaeota, Verrucomicrobia and Planctomycetes with trace amounts of Fusobacteria, Deinococcus-Thermus and Spirochaetes were found. The percentage distributions of the microbiome community in the normal and model rats were 47 and 48 for Firmicutes, 38 and 37 for Bacteroidetes and 14 and 14 for Proteobacteria, respectively. Both groups had less than 1 for Tenericutes, Actinobacteria, Deinococcus-Thermus, Euryarchaeota and Fusobacteria (Figure 6). At the genus level, the percentage distributions of the microbiome community in the normal and model rats were 30 and 6 for Helicobacter, 12 and 1 for Roseburia, 10 and 13 for Lactobacillus, 8 and 7 for Parasutterella, 7 and 7 for Oscillibacter, 4 and 1 for Desulfovibrio, 4 and 19 for Alistipes, 2 and 9 for Ruminococcus and 1 and 21 for Escherichia, respectively (Figure 7).
β-diversity analysis
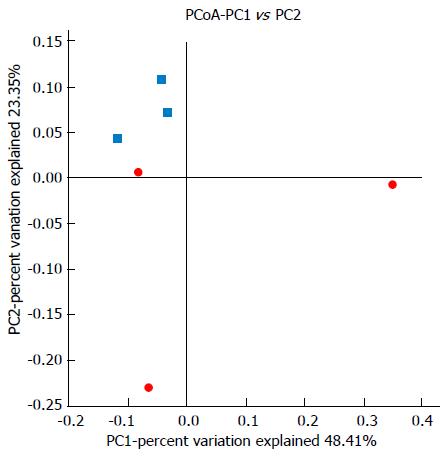
UniFrac β-diversity analysis represents the extent of similarity between different microbial communities. UniFrac PCoA (principal co-ordinate analysis) of 6666 OTUs (grouped at 97% sequence identity) showed a clear separation between the normal and model samples using weighted analysis (Figure 8). Percentage values at the axes indicate contribution of the principal components to the explanation of total variance in the dataset. The figure showed that the percentages of variation explained by PC1 and PC2 were 48.41% and 23.35%, respectively. The samples in the model group were well separated from those in the normal group based on the weighted UniFrac distances measured at the OTU level.
Intestinal barrier dysfunction can cause bacterial and endotoxin translocation, resulting in sepsis and eventually lung injury, the most important factor that initiates ARDS. However, the mechanism by which the intestine changes its mucosal barrier and microflora during ARDS remains unclear. The mucosa is an important aspect of bowel function, and the intestinal mucosal epithelial cells form a critical defensive barrier system against foreign bacteria. Disruption of the epithelial barrier results in bacterial recruitment and activation of mucosal immune cells, which initiate acute inflammation[23]. DAO activity is particularly high in the upper portion of the small intestinal villi; therefore, DAO level has been used as a marker of intestinal mucosal integrity[24]. Mammals only have L-lactate dehydrogenase and L-lactate as markers of cell hypoxemia, and the levels of these markers have been shown to correlate with the survival of septic shock patients[25,26]. However, bacteria have D-lactate dehydrogenase and produce D-lactate during fermentation. Thus, D-lactate levels in the blood not only reflect the status of intestinal mucosal damage, but also correspond to changes in intestinal mucosa permeability[27-28].
Intestinal flora generally does not change in healthy individuals, but can be affected by diseases. Scientists have studied the abundance and biodiversity of bacteria under healthy and disease conditions using high-throughput sequencing. An imbalance in gut microflora is also evident in diabetes[29], cancer[30-31] and obese patients[32]. Animal models provide the possibility of controlling these factors, a mechanistic understanding of host-microbial interactions and potentially allowing the rational design of future human studies. In this study, rats were killed within 24 h after intratracheal instillation of LPS. We investigated the characteristics of microflora in the fecal matter of rats using 16S rDNA-based molecular sequencing and found significant differences in the species and distribution between the model and control groups. The results showed higher biodiversity and species richness in the model group than in the control group. Compared with the model group, the control group had a significantly higher number of species of Fusobacteria (at the phylum level), Helicobacter and Roseburia, as determined by abundance difference analysis. This study is the first to reveal that the abundance of Helicobacter and Roseburia species significantly decreased in early ARDS, which may be the result of stress response. Increased microbial diversity and abundance were observed in the model group, but it is unknown whether these changes are due to passive damage to the body or a positive protective response mechanism. However, a close relationship was confirmed between the microflora and ARDS. ARDS can occur due to hypoxemia, activation of the systemic inflammatory response, injury to inflammatory mediators, damage by free radicals, immune destruction and irritation of the intestinal mucosa barrier, leading to intestinal bacterial translocation and changes in the intestinal environment. These mechanisms affect the distribution of intestinal flora.
In conclusion, research on the structure and function of intestinal microflora in ALI/ARDS can help to understand the close relationship between the lungs and the intestines and to provide a valid experimental basis for the important function of intestinal microflora in preventing and treating ALI/ARDS. We found that these microbes were involved in the pathogenesis of ARDS. This study is the first to employ high-throughput sequencing technology to determine changes in gut microbes in a rat ARDS model, and to reveal the pathogenesis of ARDS in this model. The results of this study may be used as a basis for improving the clinical treatment of ARDS. The detection of specific bacteria allows early detection and diagnosis of ALI/ARDS.
Intestinal barrier dysfunction can cause bacterial and endotoxin translocation, resulting in sepsis and eventually lung injury, the most important factor that initiates acute respiratory distress syndrome (ARDS). However, the mechanism by which the intestine changes its mucosal barrier and microflora during ARDS remains unclear. The intestinal flora generally does not change in healthy individuals, but it can be affected by diseases, such as ARDS.
Scientists have studied the abundance and biodiversity of bacteria under healthy and disease conditions using high-throughput sequencing. Recent studies have employed high-throughput sequencing to reveal the specific relationship between diseases and intestinal flora. Imbalance of gut microflora is also evident in diabetes, cancer and obese patients.
The results of this study may serve as a reference for elucidating the relationship between the lungs and intestines. This study is the first to employ high-throughput sequencing technology to determine changes in the gut microbes of rat models with ARDS and to further reveal the pathogenesis of ARDS.
The results of this study may be used as a basis for improving the clinical treatment of ARDS. Overall, the detection of specific bacteria allows early detection and diagnosis of acute lung injury (ALI)/ARDS in the future.
ARDS is a continuous pathological process, with ALI at its early stage. High-throughput sequencing is a technology used to sequence thousands to millions of DNA molecules, thus making a detailed and overall analysis of the transcriptome and the genome of a species possible, therefore it is also known as deep sequencing. High-throughput sequencing greatly contributes to the research on the diversity of environmental microbes, including uncultured microorganisms and trace amounts of bacteria.
This is an experimental study for evaluation of the possible association between ARDS and intestinal microflora using an animal model and the high-throughput sequencing analysis. The study contributes to a better understanding of mechanisms by which the changes in intestinal mucosa barrier and host microflora could be involved in the pathogenesis of ARDS. The investigational significance is high due to very strong clinical and translational potential.
P- Reviewers: Han N, Vorobjova T S- Editor: Qi Y L- Editor: Wang TQ E- Editor: Wu HL
| 1. | Ashbaugh DG, Bigelow DB, Petty TL, Levine BE. Acute respiratory distress in adults. Lancet. 1967;2:319-323. [RCA] [PubMed] [DOI] [Full Text] [Cited by in Crossref: 2410] [Cited by in RCA: 2241] [Article Influence: 38.6] [Reference Citation Analysis (0)] |
| 2. | Ware LB, Matthay MA. The acute respiratory distress syndrome. N Engl J Med. 2000;342:1334-1349. [RCA] [PubMed] [DOI] [Full Text] [Cited by in Crossref: 3976] [Cited by in RCA: 3861] [Article Influence: 154.4] [Reference Citation Analysis (0)] |
| 3. | Rubenfeld GD, Caldwell E, Peabody E, Weaver J, Martin DP, Neff M, Stern EJ, Hudson LD. Incidence and outcomes of acute lung injury. N Engl J Med. 2005;353:1685-1693. [RCA] [PubMed] [DOI] [Full Text] [Cited by in Crossref: 2636] [Cited by in RCA: 2798] [Article Influence: 139.9] [Reference Citation Analysis (0)] |
| 4. | Costa EL, Schettino IA, Schettino GP. The lung in sepsis: guilty or innocent? Endocr Metab Immune Disord Drug Targets. 2006;6:213-216. [RCA] [PubMed] [DOI] [Full Text] [Cited by in Crossref: 31] [Cited by in RCA: 41] [Article Influence: 2.2] [Reference Citation Analysis (0)] |
| 5. | Frutos-Vivar F, Ferguson ND, Esteban A. Epidemiology of acute lung injury and acute respiratory distress syndrome. Semin Respir Crit Care Med. 2006;27:327-336. [RCA] [PubMed] [DOI] [Full Text] [Cited by in Crossref: 53] [Cited by in RCA: 51] [Article Influence: 2.7] [Reference Citation Analysis (0)] |
| 6. | Matthay MA, Ware LB, Zimmerman GA. The acute respiratory distress syndrome. J Clin Invest. 2012;122:2731-2740. [RCA] [PubMed] [DOI] [Full Text] [Cited by in Crossref: 1156] [Cited by in RCA: 1389] [Article Influence: 106.8] [Reference Citation Analysis (0)] |
| 7. | Wilmore DW, Smith RJ, O’Dwyer ST, Jacobs DO, Ziegler TR, Wang XD. The gut: a central organ after surgical stress. Surgery. 1988;104:917-923. [PubMed] |
| 8. | Brigham KL, Meyrick B. Endotoxin and lung injury. Am Rev Respir Dis. 1986;133:913-927. [PubMed] |
| 9. | Ley RE, Peterson DA, Gordon JI. Ecological and evolutionary forces shaping microbial diversity in the human intestine. Cell. 2006;124:837-848. [RCA] [PubMed] [DOI] [Full Text] [Cited by in Crossref: 2162] [Cited by in RCA: 2281] [Article Influence: 120.1] [Reference Citation Analysis (0)] |
| 10. | Hooper LV, Gordon JI. Commensal host-bacterial relationships in the gut. Science. 2001;292:1115-1118. [RCA] [PubMed] [DOI] [Full Text] [Cited by in Crossref: 1598] [Cited by in RCA: 1561] [Article Influence: 65.0] [Reference Citation Analysis (0)] |
| 11. | Turnbaugh PJ, Ley RE, Hamady M, Fraser-Liggett CM, Knight R, Gordon JI. The human microbiome project. Nature. 2007;449:804-810. [RCA] [PubMed] [DOI] [Full Text] [Full Text (PDF)] [Cited by in Crossref: 4573] [Cited by in RCA: 3725] [Article Influence: 206.9] [Reference Citation Analysis (0)] |
| 12. | O’Hara AM, Shanahan F. The gut flora as a forgotten organ. EMBO Rep. 2006;7:688-693. [RCA] [PubMed] [DOI] [Full Text] [Cited by in Crossref: 1690] [Cited by in RCA: 1788] [Article Influence: 94.1] [Reference Citation Analysis (2)] |
| 13. | Hill DA, Artis D. Intestinal bacteria and the regulation of immune cell homeostasis. Annu Rev Immunol. 2010;28:623-667. [RCA] [PubMed] [DOI] [Full Text] [Cited by in Crossref: 457] [Cited by in RCA: 429] [Article Influence: 28.6] [Reference Citation Analysis (0)] |
| 14. | Macpherson AJ, Harris NL. Interactions between commensal intestinal bacteria and the immune system. Nat Rev Immunol. 2004;4:478-485. [RCA] [PubMed] [DOI] [Full Text] [Cited by in Crossref: 1099] [Cited by in RCA: 1142] [Article Influence: 54.4] [Reference Citation Analysis (0)] |
| 15. | Koren O, Goodrich JK, Cullender TC, Spor A, Laitinen K, Bäckhed HK, Gonzalez A, Werner JJ, Angenent LT, Knight R. Host remodeling of the gut microbiome and metabolic changes during pregnancy. Cell. 2012;150:470-480. [RCA] [PubMed] [DOI] [Full Text] [Cited by in Crossref: 1438] [Cited by in RCA: 1459] [Article Influence: 112.2] [Reference Citation Analysis (0)] |
| 16. | Vaziri ND, Wong J, Pahl M, Piceno YM, Yuan J, DeSantis TZ, Ni Z, Nguyen TH, Andersen GL. Chronic kidney disease alters intestinal microbial flora. Kidney Int. 2013;83:308-315. [RCA] [PubMed] [DOI] [Full Text] [Cited by in Crossref: 636] [Cited by in RCA: 823] [Article Influence: 63.3] [Reference Citation Analysis (0)] |
| 17. | Li Q, Wang C, Tang C, Li N, Li J. Molecular-phylogenetic characterization of the microbiota in ulcerated and non-ulcerated regions in the patients with Crohn’s disease. PLoS One. 2012;7:e34939. [RCA] [PubMed] [DOI] [Full Text] [Full Text (PDF)] [Cited by in Crossref: 41] [Cited by in RCA: 44] [Article Influence: 3.4] [Reference Citation Analysis (0)] |
| 18. | Zhao L, Wang G, Siegel P, He C, Wang H, Zhao W, Zhai Z, Tian F, Zhao J, Zhang H. Quantitative genetic background of the host influences gut microbiomes in chickens. Sci Rep. 2013;3:1163. [RCA] [PubMed] [DOI] [Full Text] [Full Text (PDF)] [Cited by in Crossref: 192] [Cited by in RCA: 239] [Article Influence: 19.9] [Reference Citation Analysis (0)] |
| 19. | Zhang XQ, Lv CJ, Liu XY, Hao D, Qin J, Tian HH, Li Y, Wang XZ. Genome-wide analysis of DNA methylation in rat lungs with lipopolysaccharide-induced acute lung injury. Mol Med Rep. 2013;7:1417-1424. [RCA] [PubMed] [DOI] [Full Text] [Cited by in Crossref: 20] [Cited by in RCA: 27] [Article Influence: 2.3] [Reference Citation Analysis (0)] |
| 20. | Nishina K, Mikawa K, Takao Y, Maekawa N, Shiga M, Obara H. ONO-5046, an elastase inhibitor, attenuates endotoxin-induced acute lung injury in rabbits. Anesth Analg. 1997;84:1097-1103. [PubMed] |
| 21. | Fürst W, Schiesser A. Test for stereospecifity of an automated Dd-lactate assay based on selective removal of Ll-lactate. Anal Biochem. 1999;269:214-215. [RCA] [PubMed] [DOI] [Full Text] [Cited by in Crossref: 10] [Cited by in RCA: 12] [Article Influence: 0.5] [Reference Citation Analysis (0)] |
| 22. | Li JY, Lu Y, Hu S, Sun D, Yao YM. Preventive effect of glutamine on intestinal barrier dysfunction induced by severe trauma. World J Gastroenterol. 2002;8:168-171. [PubMed] |
| 23. | Goto Y, Kiyono H. Epithelial barrier: an interface for the cross-communication between gut flora and immune system. Immunol Rev. 2012;245:147-163. [RCA] [PubMed] [DOI] [Full Text] [Cited by in Crossref: 135] [Cited by in RCA: 151] [Article Influence: 11.6] [Reference Citation Analysis (0)] |
| 24. | Bounous G, Echavé V, Vobecky SJ, Navert H, Wollin A. Acute necrosis of the intestinal mucosa with high serum levels of diamine oxidase. Dig Dis Sci. 1984;29:872-874. [RCA] [PubMed] [DOI] [Full Text] [Cited by in Crossref: 23] [Cited by in RCA: 26] [Article Influence: 0.6] [Reference Citation Analysis (0)] |
| 25. | Bakker J, Gris P, Coffernils M, Kahn RJ, Vincent JL. Serial blood lactate levels can predict the development of multiple organ failure following septic shock. Am J Surg. 1996;171:221-226. [RCA] [PubMed] [DOI] [Full Text] [Cited by in Crossref: 513] [Cited by in RCA: 487] [Article Influence: 16.8] [Reference Citation Analysis (0)] |
| 26. | Dell’Aglio DM, Perino LJ, Kazzi Z, Abramson J, Schwartz MD, Morgan BW. Acute metformin overdose: examining serum pH, lactate level, and metformin concentrations in survivors versus nonsurvivors: a systematic review of the literature. Ann Emerg Med. 2009;54:818-823. [RCA] [PubMed] [DOI] [Full Text] [Cited by in Crossref: 102] [Cited by in RCA: 103] [Article Influence: 6.4] [Reference Citation Analysis (0)] |
| 27. | Isbir CS, Ergen A, Tekeli A, Zeybek U, Gormus U, Arsan S. The effect of NQO1 polymorphism on the inflammatory response in cardiopulmonary bypass. Cell Biochem Funct. 2008;26:534-538. [RCA] [PubMed] [DOI] [Full Text] [Cited by in Crossref: 7] [Cited by in RCA: 12] [Article Influence: 0.7] [Reference Citation Analysis (0)] |
| 28. | Johnston SD, Smye M, Watson RP. Intestinal permeability tests in coeliac disease. Clin Lab. 2001;47:143-150. [PubMed] |
| 29. | Stachowicz N, Kiersztan A. [The role of gut microbiota in the pathogenesis of obesity and diabetes]. Postepy Hig Med Dosw (Online). 2013;67:288-303. [RCA] [PubMed] [DOI] [Full Text] [Cited by in Crossref: 9] [Cited by in RCA: 15] [Article Influence: 1.3] [Reference Citation Analysis (0)] |
| 30. | Rana SV. Importance of methanogenic flora in intestinal toxicity during 5-fluorouracil therapy for colon cancer. J Clin Gastroenterol. 2013;47:9-11. [RCA] [PubMed] [DOI] [Full Text] [Cited by in Crossref: 2] [Cited by in RCA: 3] [Article Influence: 0.3] [Reference Citation Analysis (0)] |
| 31. | Orlando A, Russo F. Intestinal microbiota, probiotics and human gastrointestinal cancers. J Gastrointest Cancer. 2013;44:121-131. [RCA] [PubMed] [DOI] [Full Text] [Cited by in Crossref: 17] [Cited by in RCA: 16] [Article Influence: 1.3] [Reference Citation Analysis (0)] |
| 32. | Fei N, Zhao L. An opportunistic pathogen isolated from the gut of an obese human causes obesity in germfree mice. ISME J. 2013;7:880-884. [RCA] [PubMed] [DOI] [Full Text] [Full Text (PDF)] [Cited by in Crossref: 422] [Cited by in RCA: 542] [Article Influence: 41.7] [Reference Citation Analysis (0)] |


