Copyright
©2013 Baishideng Publishing Group Co.
World J Gastroenterol. Dec 21, 2013; 19(47): 9020-9033
Published online Dec 21, 2013. doi: 10.3748/wjg.v19.i47.9020
Published online Dec 21, 2013. doi: 10.3748/wjg.v19.i47.9020
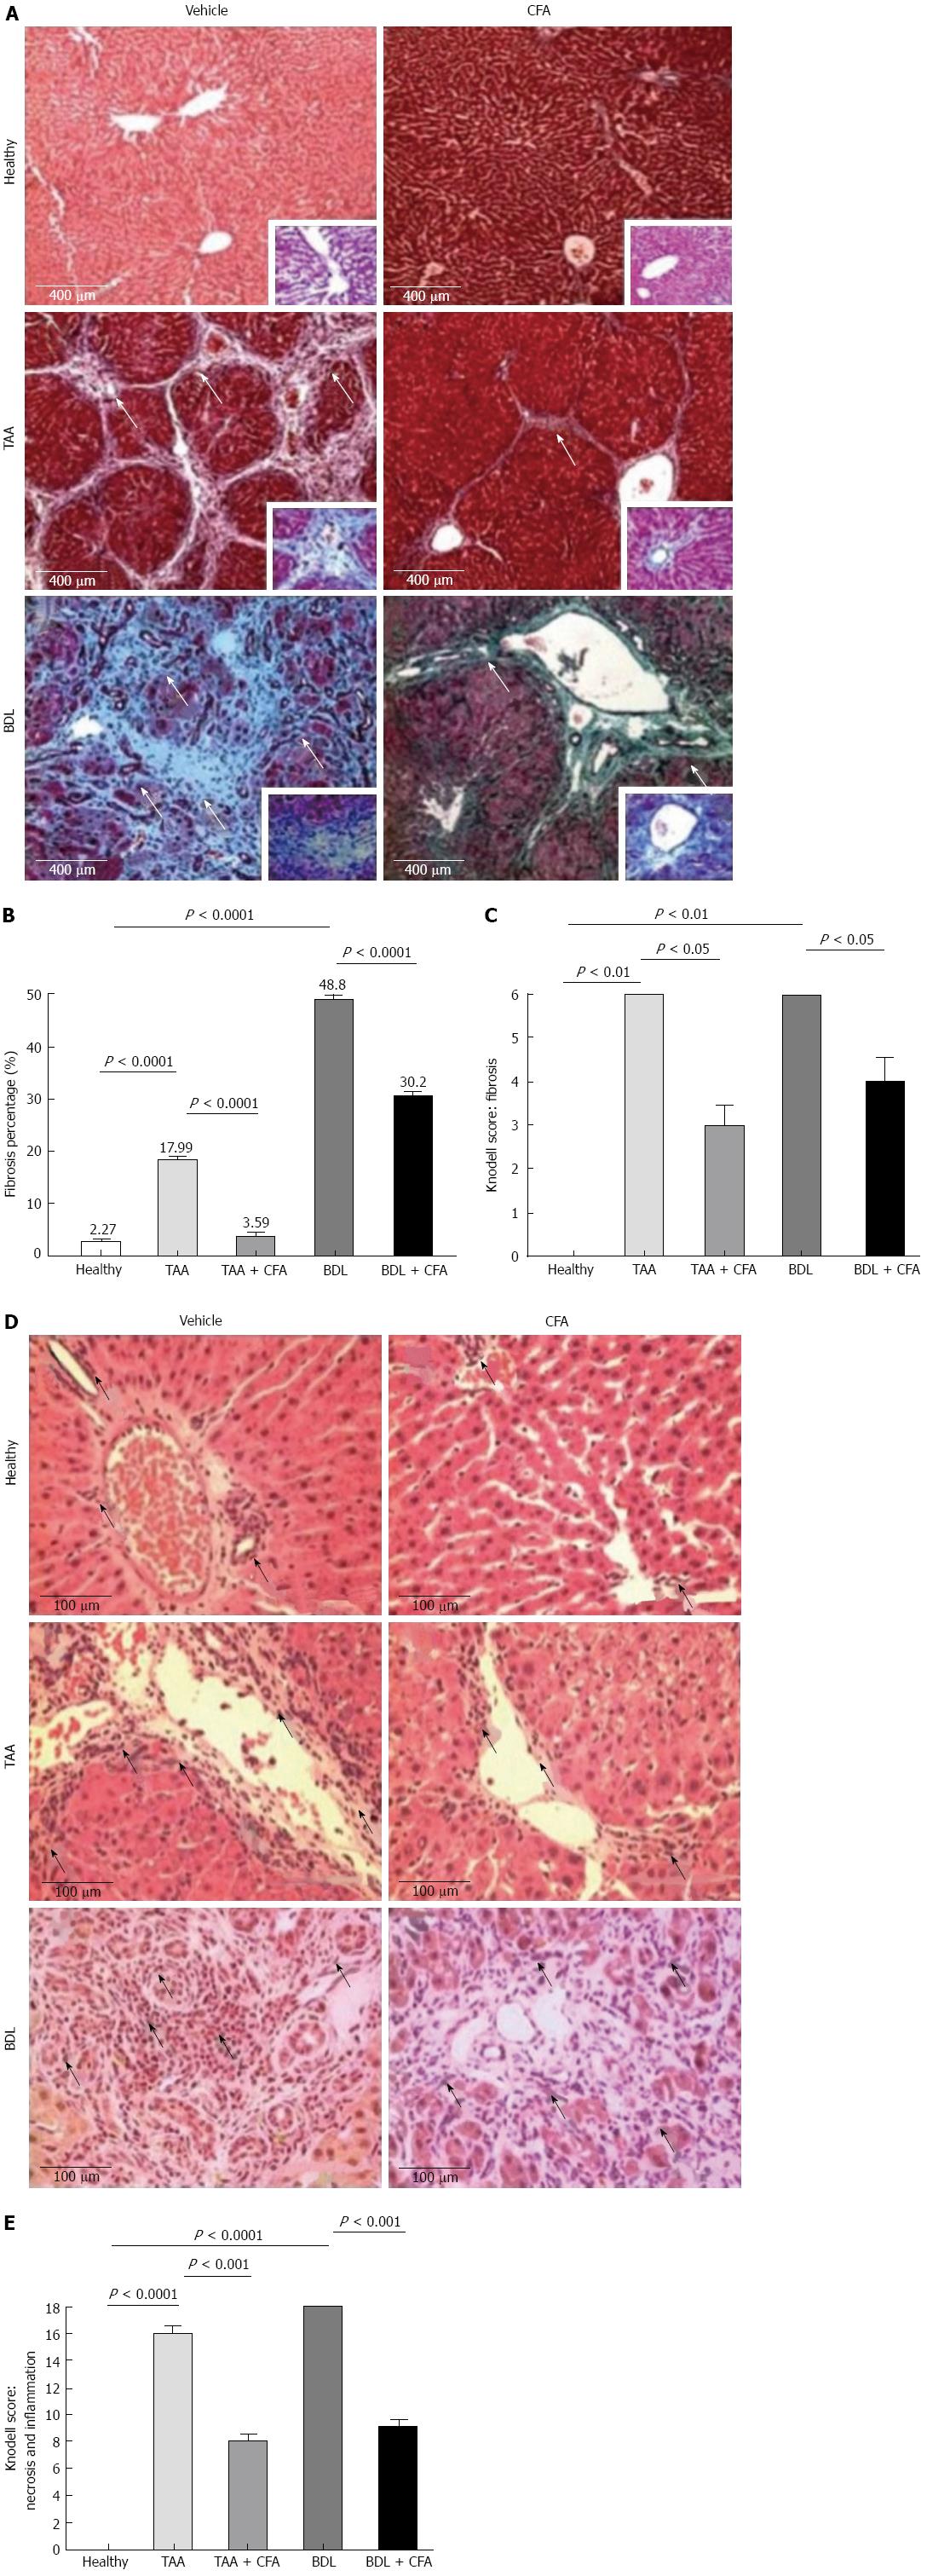
Figure 1 Macroscopic and histological differences and fibrosis index with caffeine treatment.
A: Liver fibrosis percentage of healthy rats, caffeine (CFA)-treated, thioacetamide (TAA)-intoxicated, TAA-intoxicated treated with CFA, bile duct ligation (BDL) rats, BDL rats treated with CFA. Sections, 4 μm thick, stained with Masson’s trichrome, × 10. White arrows show the extracellular matrix (ECM) (fibrosis); B: Fibrosis quantification. Fibrosis percentages are shown, they were obtained by computer-assisted morphometric analysis (Software Image pro plus 6.3); C: Knodell Index for fibrosis, sections 4 μm thick, stained with Masson’s trichrome, × 10; D: Inflammatory infiltrate amount. Sections 4 μm thick, stained with hematoxylin and eosin, × 40. Black arrows show inflammatory cells; E: Knodell Index for fibrosis, sections 4 μm thick, stained with hematoxylin and eosin, × 40.
- Citation: Gordillo-Bastidas D, Oceguera-Contreras E, Salazar-Montes A, González-Cuevas J, Hernández-Ortega LD, Armendáriz-Borunda J. Nrf2 and Snail-1 in the prevention of experimental liver fibrosis by caffeine. World J Gastroenterol 2013; 19(47): 9020-9033
- URL: https://www.wjgnet.com/1007-9327/full/v19/i47/9020.htm
- DOI: https://dx.doi.org/10.3748/wjg.v19.i47.9020


