Published online Dec 14, 2011. doi: 10.3748/wjg.v17.i46.5075
Revised: June 9, 2011
Accepted: June 16, 2011
Published online: December 14, 2011
AIM: To investigate osteopontin expression and its association with hepatopathologic changes in BALB/C mice infected with Schistosoma japonicum.
METHODS: The schistosomal hepatopathologic mouse model was established by abdominal infection with schistosomal cercaria. Liver samples were obtained from mice sacrificed at 6, 8, 10, 14, and 18 wk after infection. Liver histopathological changes were observed with hematoxylin-eosin and Masson trichrome staining. The expression of osteopontin was determined with immunohistochemistry, reverse transcription-polymerase chain reaction, and Western blotting. The expression of α-smooth muscle actin (α-SMA) and transforming growth factor-β1 (TGF-β1) were determined by immunohistochemistry. Correlations of osteopontin expression with other variables (α-SMA, TGF-β1, hepatopathologic features including granuloma formation and degree of liver fibrosis) were analyzed.
RESULTS: Typical schistosomal hepatopathologic changes were induced in the animals. Dynamic changes in the expression of osteopontin were observed at week 6. The expression increased, peaked at week 10 (P < 0.01), and then gradually decreased. Positive correlations between osteopontin expression and α-SMA (r = 0.720, P < 0.01), TGF-β1 (r = 0.905, P < 0.01), granuloma formation (r = 0.875, P < 0.01), and degree of liver fibrosis (r = 0.858, P < 0.01) were also observed.
CONCLUSION: Osteopontin may play an important role in schistosomal hepatopathology and may promote granuloma formation and liver fibrosis through an unexplored mechanism.
-
Citation: Chen BL, Zhang GY, Yuan WJ, Wang SP, Shen YM, Yan L, Gu H, Li J. Osteopontin expression is associated with hepatopathologic changes in
Schistosoma japonicum infected mice. World J Gastroenterol 2011; 17(46): 5075-5082 - URL: https://www.wjgnet.com/1007-9327/full/v17/i46/5075.htm
- DOI: https://dx.doi.org/10.3748/wjg.v17.i46.5075
Schistosomiasis remains a huge threat to human health in tropical areas. Almost 12% of the population is in danger of this disease, with more than 200 million people infected annually[1]. In the past few decades, this disease has re-emerged and is still endemic in marsh, lake, and even mountainous regions of China, causing social hardship and economic burden[2]. It is now believed that the immune response of humans to schistosome eggs and the granulomatous responses they induce are the major causes of pathology in schistosomiasis[3]. The granulomas that form around the eggs impair blood flow in the liver and consequently induce portal hypertension[4]. On the other hand, the granulomas destroy the eggs and sequester or neutralize pathogenic egg antigens, leading to fibrosis in host tissues[5]. Once the immune response is activated, it is unlikely to be self-limiting, and schistosomiasis liver damage will continue, even after effective insecticide treatment[6]. Increasing reports of praziquantel treatment failures have highlighted the need for advanced knowledge of schistosomal hepatopathologic mechanisms and for new therapeutic strategies.
Osteopontin is granulomatogenic and has chemokine functions (mediating T lymphocyte and macrophage migration), cytokine activity (modulating T-helper 1 and 2 cytokine production), and several inflammatory and anti-inflammatory effects (regulation of nitric oxide generation)[7]. Recent work has demonstrated the important role osteopontin plays in mediating hepatic inflammation[8]. Upregulation of osteopontin expression early in the development of steatohepatitis, and its possible role in signaling the onset of liver injury and fibrosis in experimental nonalcoholic steatohepatitis have been reported[9].
These limited findings led us to hypothesize that osteopontin may be engaged in the immunopathogenesis of schistosomiasis liver damage. In our current study, we investigated the dynamic changes in osteopontin expression in Schistosoma japonicum (S. japonicum)-infected mouse liver. We also examined the relationship between osteopontin and hepatopathology and potential promoters of fibrosis progression such as hepatic stellate cells (HSCs) and transforming growth factor-β1 (TGF-β1) to obtain possible clues for further studies on the cellular and molecular mechanisms involved in schistosomal hepatopathology.
Six-week-old BALB/C female mice were purchased from the Experimental Animal Center (Central South University, Changsha, Hunan, China). All animal experiments were performed in accordance with the Chinese Council on the Animal Care Guide for the Care and Use of Laboratory Animals. Oncomelania hupensis harboring S. japonicum cercariae were obtained from the Center for Schistosomiasis Control and Prevention (Yueyang, Hunan, China).
One hundred BALB/C mice were randomly divided into the control group and the model group (n = 50 each). Mice in the model group were percutaneously infected with S. japonicum by placing a glass slide carrying 15 ± 1 cercariae in non-chlorine water on its abdomen for 20 min. Mice in the control group were treated with non-chlorine water containing no cercariae. All mice were kept at 20-25 °C in a 12-h light/12-h dark cycle with free access to food and water. At 6, 8, 10, 14, and 18 wk after infection, 10 mice from each group were randomly selected and sacrificed. Liver tissues were extracted and cut into two parts: the left lobes of the liver were fixed in 4% paraformaldehyde for 12 h; the remaining portion of the liver was preserved at -80 °C until use.
Paraformaldehyde-fixed liver specimens were dehydrated in a graded alcohol series. Following xylene treatment, the specimens were embedded in paraffin blocks, cut into 5-μm thick sections, and placed on glass slides. The sections were then stained with hematoxylin and eosin (HE) and Masson trichrome (MT) according to standard procedures. To describe and evaluate liver pathological changes, a pathologist who was blinded to the research design examined 10 different low-power fields of HE- and MT-stained sections (selected fields were in almost the same location) for each mouse. In addition, the percentage of collagen calculated by a multimedia color image analysis system (Image-Pro Plus 6.0) was measured as a relative objective index (because a histological/fibrosis score that is evaluated by pathologists is susceptible to the ability and subjective judgment of the pathologist) to evaluate the degree of liver fibrosis. Each MT-stained section was examined at 100 × magnification. Every field analyzed contained a granuloma, portal area, or a centrilobular vein. Fibrotic areas were scanned and summed by the software. The percentage of collagen was expressed as the ratio of the collagen-containing area to the whole area, and the result was determined as the mean of ten different fields of each section. Furthermore, the granuloma dimension was also measured at a magnification of 100× using an ocular micrometer. Only non-confluent granulomas containing eggs in their centers were measured[10]. Granuloma dimension = maximum width × maximum length. Mean granuloma dimension of each section = sum of all granuloma dimensions in each section/number of granuloma in each section.
Immunohistochemical staining was performed with the PV-6001/6002 Two-Step IHC Detection Reagent (ZSGB-BIO, China). The sections were dewaxed, dehydrated, immersed in citrate buffer (0.01 mol/L, pH 6.0), heated at 100 °C in a microwave oven 6 × 2 min, incubated in 3% H2O2 in deionized water for 10 min to block endogenous peroxidase activity, and washed 2 × 3 min with phosphate-buffered saline (PBS). The sections were then incubated overnight at 4 °C with antibodies against osteopontin (mouse monoclonal; 1:300; Santa Cruz Biotechnology, United States), α-SMA (mouse monoclonal; 1:300; Santa Cruz Biotechnology), and TGF-β1 (rabbit polyclonal; 1:300; Santa Cruz Biotechnology). After washing 2 × 3 min with PBS, the appropriate second antibody was added to the sections and incubated at 37 °C for 30 min. Then, the sections were washed 2 × 3 min with PBS, and the color was developed with diaminobenzidine (DAB) for about 5 min. Nuclei were lightly counterstained with hematoxylin. Negative controls included incubation with PBS without the primary antibody. The integral optical density (IOD) was measured with Image-Pro Plus 6.0, and the result was determined as the sum of five different fields (one in the center and four in the periphery) of each section. The IOD of the target protein was defined as the sum of the optical densities of all the positive pixels in the image, which represents the quantity of the targeted protein. The IOD is considered to be more accurate than average optical density as it considers both the intensity and area.
Total RNA was extracted from frozen liver tissue with TRIZOL Reagent (Invitrogen, United States). Complementary DNA (cDNA) was synthesized from total RNA using a ReverTra Ace-α-TM First Strand cDNA Synthesis kit (Toyobo, Japan). Relative quantification of target gene expression was performed using the housekeeping gene, glyceraldehyde-3-phosphate dehydrogenase (GAPDH) as an internal control. The primer sequences were osteopontin forward 5′-CCAGGTTTCTGATGAACAGT-3′ and reverse 5′-GTGTGTTTCCAGACTTGGTT-3′, which yielded a fragment of 193 bp, and GAPDH forward 5′-AACTTTGGCATTGTGGAAGG-3′ and reverse 5′-GGATGCAGGGATGATGTTCT-3′, which yielded a fragment of 132 bp. For the first step, the following components were mixed to obtain the specified concentrations in a final 20 μL reaction volume: 1 μL denatured total RNA (1 μg/μL), 4 μL 5 × buffer, 2 μL dNTP mixture (10 mmol/L), 1 μL RNase inhibitor (10 U/μL), 10 μL RNase-free H2O, 1 μL Oligo (dT)20 (10 pmol/μL), and 1 μL ReverTra Ace. The reaction was performed at 42 °C for 20 min, followed by 99 °C for 5 min, and 4 °C for 5 min. In the second step, 1 μL cDNA was mixed with 0.5 μL each sense and anti-sense primers (100 μmol/L each), 2 μL dNTP mixture (2 mmol/L), 1.5 μL MgCl2 (25 mmol/L), 2 μL 10 × polymerase chain reaction (PCR) buffer, 0.5 μL Taq DNA Polymerase (500 U), and 12 μL PCR H2O. PCR was performed as follows: denaturation at 95 °C for 5 min; 32 cycles of denaturation at 94 °C for 30 s, annealing at 55 °C for 30 s, and elongation at 72 °C for 30 s; and final elongation at 72 °C for 5 min. The PCR products were separated by electrophoresis on 1.5% agarose gels (sample volume: 10 μL, voltage: 120 V) and visualized with ethidium bromide staining and ultraviolet illumination. We used gel OD analysis software (Gel-Pro 4.0) to scan and calculate the IOD of strips. The relative mRNA expression of osteopontin was represented as the ratio of osteopontin:IOD and GAPDH:IOD.
Frozen tissue specimens (500 mg) were homogenized on ice in 1 mL lysate prepared from a Total Protein Extraction kit (ProMab, United States) and then ultrasonicated for 3 × 3 s. The crude protein fractions were obtained by centrifuging the homogenates at 9000 ×g for 10 min at 4 °C. The supernatant was used as the protein fraction. Gel samples were prepared by mixing protein samples with sample buffer and boiling at 100 °C for 3 min. Nuclear and cytoplasmic proteins were separated with 12% sodium dodecyl sulfate-polyacrylamide gel electrophoresis in running buffer. After electrophoresis, the proteins were transferred to nitrocellulose membrane (Pierce, United States) in transfer buffer at 300 mA constant current for 70 min on ice. Non-specific binding sites were blocked by incubating in PBS containing 5% nonfat milk for 2 h at 37 °C. Membranes were then incubated with primary antibodies (mouse osteopontin monoclonal; 1:500; Santa Cruz Biotechnology and mouse monoclonal GAPDH; 1:1000; ProMab, United States) overnight at 4 °C. The membranes were then washed 5 × 4 min with PBS-Tween 20 (PBST) and incubated with secondary antibody (horseradish peroxidase-conjugated goat anti-mouse IgG; 1:50 000; Zymed, United States) for 1 h at 37 °C. After the membranes were washed 5 × 4 min in PBST, enhanced chemiluminescence detection of the target protein was performed. The film was scanned, and the image was analyzed with Gel-Pro 4.0. The relative levels of osteopontin were represented as the ratio of osteopontin:IOD and GAPDH:IOD.
Statistical analysis was performed using SPSS 13.0 software. Data were expressed as mean ± SD. A normality test was performed before statistical analysis. Comparisons between groups and time points were performed using one-way analysis of variation (homogeneity of variance: S-N-K; heterogeneity of variance: Tamhane). Correlation analysis was performed with linear regression. P values less than 0.01 (heterogeneity of variance) or 0.05 were considered statistically significant.
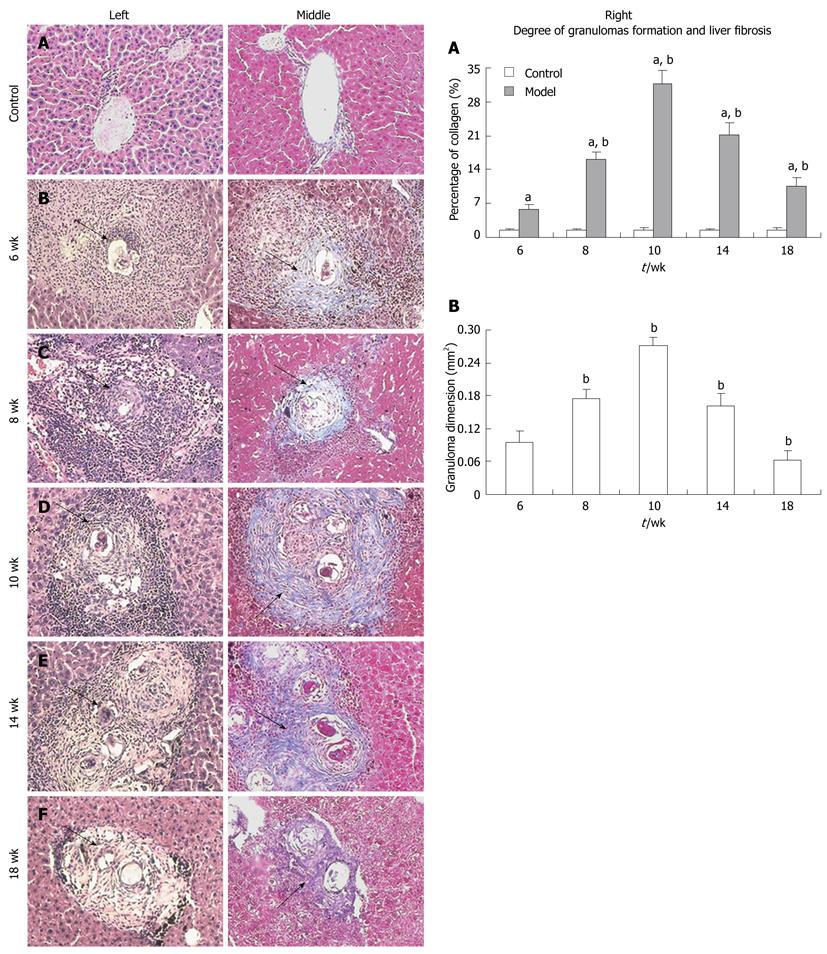
Both HE and MT staining revealed a parallel change over time (Figure 1, left and middle). The control group showed normal hepatocyte morphology (Figure 1A), but the model group showed typical hepatopathological characteristics of schistosomiasis with remarkable acute granuloma formation and subsequent liver fibrosis from week 6 through week 18 (Figure 1B-F). At week 6, inflammatory cells had infiltrated around the schistosome eggs and formed granulomas, which were mainly distributed in portal areas; collagen fibers were only interspersed among the periphery of the granulomas (Figure 1B). The granuloma size and the quantity of inflammatory cells increased at week 8. Numerous fibrocytes appeared at the periphery of the lesions, and the collagen fibers became longer and thicker (Figure 1C). The granulomas reached their peak in size and quantity at week 10 (Figure 1D). Numerous inflammatory cells such as neutrophils, lymphocytes, and eosinophils were seen infiltrating in the granulomas, and numerous collagen fibers were wrapped or stretched into the interior of the granulomas. Some fibers extended from portal areas or inflammatory lesions to the lobule, which had been cut apart and re-built. In some serious cases, pseudolobules formed. At week 14, fibrocytes and collagen fibers eventually became the predominant feature of granulomas and formed typical chronic granulomas, whereas other cell types decreased in number (Figure 1E). The schistosome eggs degenerated and disintegrated at week 18, and fibrosis was obviously reduced but more stable (Figure 1F). The collagen percentage and the granuloma dimension in each group also showed a similar change over time (Figure 1, graphs A and B, right).
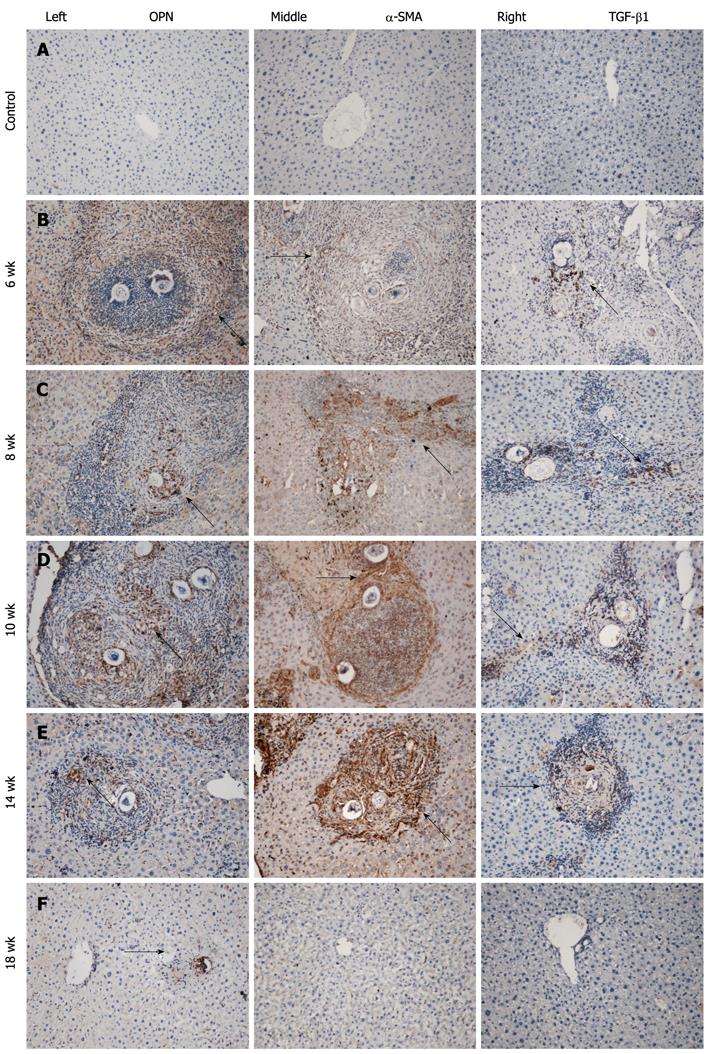
Immunohistochemistry for osteopontin, α-SMA, and TGF-β1 demonstrated a similar change that paralleled the development of hepatopathology over time (Figure 2A-F, left to right). Few if any, scarcely distributed cells with faint staining were seen in the normal control group (Figure 2A, left to right) throughout the experiment. At week 6 in the model group, positively stained cells were widely distributed in the area of inflammatory cell infiltration, which formed acute granulomas (Figure 2B, left to right). Strongly upregulated expression of these proteins was seen from week 8 to week 10. Many densely stained positive cells surrounded and infiltrated into the egg granulomas, accumulated in fibrotic areas, and stretched along the fibrous septum (Figure 2C and D, left to right). At week 14, there were still many positive cells distributed in the fibrotic granulomas and dispersed at the periphery of the granulomas. However, the expression weakened and returned to near normal levels at week 18 (Figure 2E and F, left to right). The IODs of immunostaining of individual proteins in the groups over time are shown in Table 1.
| Groups | Staining | Week 6 | Week 8 | Week 10 | Week 14 | Week 18 |
| Control group IOD | Osteopontin (× 102) | 0.52 ± 0.06 | 0.55 ± 0.07 | 0.56 ± 0.06 | 0.50 ± 0.06 | 0.50 ± 0.06 |
| α-SMA (× 102)3 | 0 | 0 | 0 | 0 | 0 | |
| TGF-β1 (× 103) | 0.20 ± 0.02 | 0.21 ± 0.02 | 0.20 ± 0.02 | 0.20 ± 0.03 | 0.20 ± 0.02 | |
| Model group IOD | Osteopontin (× 102) | 6.45 ± 0.5412 | 10.21 ± 0.8012 | 31.20 ± 2.8312 | 6.00 ± 0.5412 | 2.26 ± 0.2812 |
| α-SMA (× 102) | 0.93 ± 0.092 | 18.19 ± 1.622 | 39.13 ± 4.372 | 30.93 ± 3.872 | 1.45 ± 0.162 | |
| TGF-β1 (× 103) | 2.52 ± 0.2412 | 4.90 ± 0.5012 | 9.20 ± 1.2512 | 3.84 ± 0.3612 | 0.19 ± 0.022 |
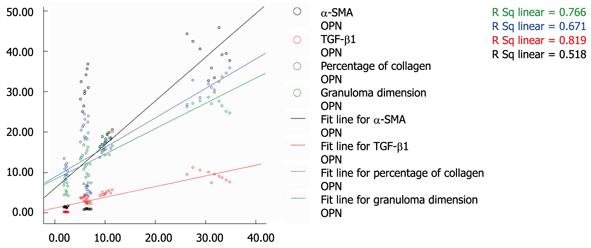
Correlation analysis revealed that the expression of osteopontin was positively correlated with expression of α-SMA and TGF-β1, and with hepatopathological changes (Figure 3). The R-square values were 0.720, 0.905, 0.815, and 0.875 for osteopontin expression with α-SMA, TGF-β1, percentage of collagen, and granuloma dimension, respectively (P < 0.01), implying that the expression of osteopontin may play an important role in the development of liver damage in S. japonicum-infected mice in this study.
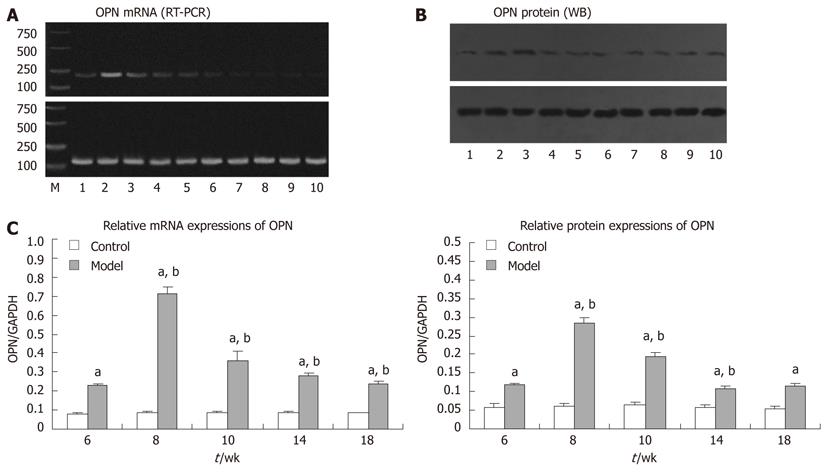
Consistent with the above results, parallel changes were seen in the expression of osteopontin mRNA and protein (Figure 4). The control group showed no changes in expression throughout the experiment, but the expression levels of both osteopontin mRNA and protein in the model group were upregulated at week 6, reached a peak at week 8 (P < 0.05), and decreased gradually. Expression levels remained higher than those in the control group (P < 0.05).
Osteopontin is considered a strong chemoattractant and proinflammatory molecule that is involved in a wide range of physiologic and pathologic events, including angiogenesis, tumor metastasis, wound healing, tissue remodeling, and fibrosis[11-13]. Osteopontin is believed to constitute the central pathway of HSC activation, a key step in the development of hepatic fibrosis[14,15]. However, the role of osteopontin in schistosomal liver damage should be explored further.
In our current study, typical hepatopathological changes were induced in S. japonicum-infected animals. Over time during the experiment, the infected liver showed granuloma formation and obvious fibrosis that appeared at week 6 and peaked from week 8 to 14. Accompanying this pathological change, osteopontin expression (mRNA and protein) was highly upregulated and showed a strong correlation with pathologic changes in the liver and with the immunohistochemistry profiles of α-SMA and TGF-β1. Thus, our data imply involvement of osteopontin in the development of schistosomal hepatopathologic changes.
Determining the mechanisms and the detailed biological role of osteopontin in the process of schistosomal hepatopathology is beyond the scope of our current experiment, but other reports suggest some possibilities. Niki et al[16] reported that α-SMA is significantly increased following HSC activation and is considered a marker for HSC activation. TGF-β1 is not only upregulated following HSC activation, but also directly activates HSCs through the TGF-β1/Smad signal transduction pathway, leading to hepatic fibrosis[17]. The upregulated expression of both α-SMA and TGF-β1 and their positive correlation with osteopontin expression observed in this study add more evidence supporting their important role in the process of schistosomal hepatopathology and liver fibrosis.
In summary, typical schistosomal hepatopathological changes occurred during this experiment. The development of hepatopathology, including granuloma formation and liver fibrosis, was accompanied by dynamic expression of osteopontin, which correlated well with the expression of both α-SMA and TGF-β1 over time. Thus, osteopontin may play a key role in schistosomal hepatopathology, the mechanisms of which will require additional studies.
There are currently few effective therapies for Schistosoma japonicum (S. japonicum)-infected patients due to a lack of understanding of appropriate intervention targets. Further studies on new cellular and molecular mechanisms are urgently needed as the global S. japonicum epidemic is becoming more serious.
Osteopontin, which is a chemoattractant and proinflammatory molecule, has been shown to be involved in tissue injury and remodeling in other diseases. However, its roles in schistosomal liver damage have yet to be explored.
This study first reports the dynamic changes in osteopontin expression (mRNA and protein) and its associations with pathologic changes in the liver of BALB/C mice infected with S. japonicum. This study analyzes the correlations of osteopontin expression with α-SMA and TGF-β1 expression and hepatopathologic features including granuloma formation and liver fibrosis.
By increasing our understanding of whether and how osteopontin is involved in schistosomal liver damage, this study may provide clues for further studies on the cellular and molecular mechanisms of schistosomal hepatopathology.
The study is novel and the methodology is good.
Peer reviewers: Satoshi Mamori, MD, PhD, Department of Gastroenterology and Hepatology, Shinko Hospital, 1-4-47 Wakihama-cho, Chuo-ku, Kobe, Hyogo 651-0072, Japan; Hussein M Atta, MD, PhD, Professor, Department of Surgery, Faculty of Medicine, Minia University, Misr-Aswan Road, El-Minia 61519, Egypt
S- Editor Sun H L- Editor Cant MR E- Editor Zhang DN
| 1. | Steinmann P, Keiser J, Bos R, Tanner M, Utzinger J. Schistosomiasis and water resources development: systematic review, meta-analysis, and estimates of people at risk. Lancet Infect Dis. 2006;6:411-425. [RCA] [PubMed] [DOI] [Full Text] [Cited by in Crossref: 1429] [Cited by in RCA: 1452] [Article Influence: 76.4] [Reference Citation Analysis (0)] |
| 2. | Zhou XN, Wang LY, Chen MG, Wu XH, Jiang QW, Chen XY, Zheng J, Utzinger J. The public health significance and control of schistosomiasis in China--then and now. Acta Trop. 2005;96:97-105. [RCA] [PubMed] [DOI] [Full Text] [Cited by in Crossref: 286] [Cited by in RCA: 296] [Article Influence: 14.8] [Reference Citation Analysis (0)] |
| 3. | Gryseels B, Polman K, Clerinx J, Kestens L. Human schistosomiasis. Lancet. 2006;368:1106-1118. [RCA] [PubMed] [DOI] [Full Text] [Cited by in Crossref: 1526] [Cited by in RCA: 1530] [Article Influence: 80.5] [Reference Citation Analysis (0)] |
| 4. | Boros DL. Immunopathology of Schistosoma mansoni infection. Clin Microbiol Rev. 1989;2:250-269. [PubMed] |
| 5. | Wilson MS, Mentink-Kane MM, Pesce JT, Ramalingam TR, Thompson R, Wynn TA. Immunopathology of schistosomiasis. Immunol Cell Biol. 2007;85:148-154. [RCA] [PubMed] [DOI] [Full Text] [Full Text (PDF)] [Cited by in Crossref: 377] [Cited by in RCA: 358] [Article Influence: 19.9] [Reference Citation Analysis (0)] |
| 6. | Chapadeiro E, Pitanga LC. [On the reversal of schistosomiasis hepatic fibrosis after specific therapy. Histopathologic study]. Rev Soc Bras Med Trop. 1996;30:53-56. [PubMed] |
| 7. | Nanas JN, Kontoyannis DA, Alexopoulos GP, Anastasiou-Nana MI, Tsagalou EP, Stamatelopoulos SF, Moulopoulos SD. Long-term intermittent dobutamine infusion combined with oral amiodarone improves the survival of patients with severe congestive heart failure. Chest. 2001;119:1173-1178. [RCA] [PubMed] [DOI] [Full Text] [Cited by in Crossref: 245] [Cited by in RCA: 268] [Article Influence: 10.7] [Reference Citation Analysis (0)] |
| 8. | Apte UM, Banerjee A, McRee R, Wellberg E, Ramaiah SK. Role of osteopontin in hepatic neutrophil infiltration during alcoholic steatohepatitis. Toxicol Appl Pharmacol. 2005;207:25-38. [RCA] [PubMed] [DOI] [Full Text] [Cited by in Crossref: 84] [Cited by in RCA: 79] [Article Influence: 4.0] [Reference Citation Analysis (0)] |
| 9. | Sahai A, Malladi P, Melin-Aldana H, Green RM, Whitington PF. Upregulation of osteopontin expression is involved in the development of nonalcoholic steatohepatitis in a dietary murine model. Am J Physiol Gastrointest Liver Physiol. 2004;287:G264-G273. [PubMed] |
| 10. | Host response to eggs of S. mansoni. I. Granuloma formation in the unsensitized laboratory mouse. Am J Pathol. 1962;41:711-731. [PubMed] |
| 11. | Lorena D, Darby IA, Gadeau AP, Leen LL, Rittling S, Porto LC, Rosenbaum J, Desmoulière A. Osteopontin expression in normal and fibrotic liver. altered liver healing in osteopontin-deficient mice. J Hepatol. 2006;44:383-390. [RCA] [PubMed] [DOI] [Full Text] [Cited by in Crossref: 66] [Cited by in RCA: 75] [Article Influence: 3.9] [Reference Citation Analysis (0)] |
| 12. | Xie H, Song J, Du R, Liu K, Wang J, Tang H, Bai F, Liang J, Lin T, Liu J. Prognostic significance of osteopontin in hepatitis B virus-related hepatocellular carcinoma. Dig Liver Dis. 2007;39:167-172. [RCA] [PubMed] [DOI] [Full Text] [Cited by in Crossref: 43] [Cited by in RCA: 52] [Article Influence: 2.9] [Reference Citation Analysis (0)] |
| 13. | Kim J, Ki SS, Lee SD, Han CJ, Kim YC, Park SH, Cho SY, Hong YJ, Park HY, Lee M. Elevated plasma osteopontin levels in patients with hepatocellular carcinoma. Am J Gastroenterol. 2006;101:2051-2059. [RCA] [PubMed] [DOI] [Full Text] [Cited by in Crossref: 93] [Cited by in RCA: 103] [Article Influence: 5.4] [Reference Citation Analysis (0)] |
| 14. | Lee SH, Seo GS, Park YN, Yoo TM, Sohn DH. Effects and regulation of osteopontin in rat hepatic stellate cells. Biochem Pharmacol. 2004;68:2367-2378. [RCA] [PubMed] [DOI] [Full Text] [Cited by in Crossref: 71] [Cited by in RCA: 68] [Article Influence: 3.4] [Reference Citation Analysis (0)] |
| 15. | Moreira RK. Hepatic stellate cells and liver fibrosis. Arch Pathol Lab Med. 2007;131:1728-1734. [PubMed] |
| 16. | Niki T, Pekny M, Hellemans K, Bleser PD, Berg KV, Vaeyens F, Quartier E, Schuit F, Geerts A. Class VI intermediate filament protein nestin is induced during activation of rat hepatic stellate cells. Hepatology. 1999;29:520-527. [RCA] [PubMed] [DOI] [Full Text] [Cited by in Crossref: 204] [Cited by in RCA: 199] [Article Influence: 7.7] [Reference Citation Analysis (0)] |
| 17. | Wada W, Kuwano H, Hasegawa Y, Kojima I. The dependence of transforming growth factor-beta-induced collagen production on autocrine factor activin A in hepatic stellate cells. Endocrinology. 2004;145:2753-2759. [RCA] [PubMed] [DOI] [Full Text] [Cited by in Crossref: 60] [Cited by in RCA: 69] [Article Influence: 3.3] [Reference Citation Analysis (0)] |


