Copyright
©2011 Baishideng Publishing Group Co.
World J Gastroenterol. Dec 14, 2011; 17(46): 5075-5082
Published online Dec 14, 2011. doi: 10.3748/wjg.v17.i46.5075
Published online Dec 14, 2011. doi: 10.3748/wjg.v17.i46.5075
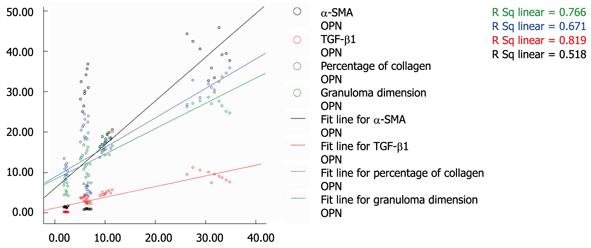
Figure 3 Correlation of osteopontin mRNA expression with α-SMA, TGF-β1, percentage of collagen, and the granuloma dimensions in the model group.
x-axis: IOD of osteopontin (× 102); y-axis: Black line: IOD of α-SMA (× 102); Red line: IOD of TGF-β1 (× 103); Blue line: Collagen (%); Green line: Granuloma dimension, mm2 (× 102). OPN: Osteopontin; SMA: Smooth muscle actin; TGF: Transforming growth factor.
-
Citation: Chen BL, Zhang GY, Yuan WJ, Wang SP, Shen YM, Yan L, Gu H, Li J. Osteopontin expression is associated with hepatopathologic changes in
Schistosoma japonicum infected mice. World J Gastroenterol 2011; 17(46): 5075-5082 - URL: https://www.wjgnet.com/1007-9327/full/v17/i46/5075.htm
- DOI: https://dx.doi.org/10.3748/wjg.v17.i46.5075


