Published online Feb 28, 2010. doi: 10.3748/wjg.v16.i8.966
Revised: December 31, 2009
Accepted: January 7, 2010
Published online: February 28, 2010
AIM: To test if inflammation also interferes with liver stiffness (LS) assessment in alcoholic liver disease (ALD) and to provide a clinical algorithm for reliable fibrosis assessment in ALD by FibroScan® (FS).
METHODS: We first performed sequential LS analysis before and after normalization of serum transaminases in a learning cohort of 50 patients with ALD admitted for alcohol detoxification. LS decreased in almost all patients within a mean observation interval of 5.3 d. Six patients (12%) would have been misdiagnosed with F3 and F4 fibrosis but LS decreased below critical cut-off values of 8 and 12.5 kPa after normalization of transaminases.
RESULTS: Of the serum transaminases, the decrease in LS correlated best with the decrease in glutamic oxaloacetic transaminase (GOT). No significant changes in LS were observed below GOT levels of 100 U/L. After establishing the association between LS and GOT levels, we applied the rule of GOT < 100 U/L for reliable LS assessment in a second validation cohort of 101 patients with histologically confirmed ALD. By excluding those patients with GOT > 100 U/L at the time of LS assessment from this cohort, the area under the receiver operating characteristic (AUROC) for cirrhosis detection by FS improved from 0.921 to 0.945 while specificity increased from 80% to 90% at a sensitivity of 96%. A similar AUROC could be obtained for lower F3 fibrosis stage if LS measurements were restricted to patients with GOT < 50 U/L. Histological grading of inflammation did not further improve the diagnostic accuracy of LS.
CONCLUSION: Coexisting steatohepatitis markedly increases LS in patients with ALD independent of fibrosis stage. Postponing cirrhosis assessment by FS during alcohol withdrawal until GOT decreases to < 100 U/mL significantly improves the diagnostic accuracy.
- Citation: Mueller S, Millonig G, Sarovska L, Friedrich S, Reimann FM, Pritsch M, Eisele S, Stickel F, Longerich T, Schirmacher P, Seitz HK. Increased liver stiffness in alcoholic liver disease: Differentiating fibrosis from steatohepatitis. World J Gastroenterol 2010; 16(8): 966-972
- URL: https://www.wjgnet.com/1007-9327/full/v16/i8/966.htm
- DOI: https://dx.doi.org/10.3748/wjg.v16.i8.966
Alcoholic liver disease (ALD) is the most common cause of liver cirrhosis in the Western world. It typically presents with various histological features ranging from steatosis to steatohepatitis and fibrosis/cirrhosis. Liver biopsy is currently considered the gold standard for assessing hepatic fibrosis or cirrhosis in these patients. However, it is an invasive procedure, with rare but potentially life-threatening complications[1]. In addition, the accuracy of liver biopsy in assessing fibrosis is limited owing to sampling error and interobserver variability[2-6].
Transient elastography (FibroScan®) is a novel rapid and noninvasive method to assess liver fibrosis via liver stiffness (LS)[7]. LS measurements can be routinely performed in more than 95% of patients but is limited in those with severe obesity and ascites[8]. LS has mainly been studied in patients with viral hepatitis, but also ALD, and LS was shown to be strongly associated with the degree of liver fibrosis in all of these patients[9-14]. In these studies, cut-off values have been defined that allow the diagnosis of advanced fibrosis (F3/F4). Despite some variability, cut-off values of 8.0 and 12.5 kPa are widely accepted to identify patients with F3 and F4 fibrosis, respectively. These cut-off values are used in parts of our study for comparison purposes.
Although LS closely correlates with fibrosis stage, it also increases in patients with mild[15,16] or acute hepatitis[17], cholestasis[18] and liver congestion[19], independent of the degree of fibrosis. High transaminase counts, cholestasis and liver congestion can even cause LS that exceeds cut-off values for F4 fibrosis (cirrhosis)[17-19]. Since steatohepatitis often coexists with all stages of fibrosis in patients with ALD it may directly interfere with reliable assessment of fibrosis in these patients. Indeed, unusually high cut-off values for liver cirrhosis (19.5 kPa[13] and 22.6 kPa[14]) have been reported recently for cirrhosis in patients with ALD compared to cut-off values of around 12-14 kPa in viral cirrhosis[12]. In these ALD studies, patients had elevated serum transaminases but the impact of alcoholic steatohepatitis (ASH) on LS was not considered.
The aim of the present sequential FibroScan (FS) study was to determine the impact of ASH on LS and to develop recommendations for non-invasive fibrosis assessment in patients with ALD. We eventually demonstrate that such selection criteria improve the diagnostic value of FS.
Patients were examined after obtaining informed consent. The study was approved by the Ethical Committee of the University of Heidelberg.
Learning cohort: In the first part of the study, sequential analysis of LS was performed in 50 patients with ALD presenting at Salem Medical Center/University of Heidelberg from June 2007 to March 2009 for alcohol detoxification. The cohort consisted of 37 male and 13 female patients with ALD. The mean age was 55.8 ± 10.8 years. Observation intervals ranged from 2-10 d (mean 5.3 d). Longer time intervals were excluded to avoid potential changes in fibrosis stage. Patients showed typical laboratory findings of ASH with glutamic oxaloacetic transaminase (GOT) higher than serum glutamic pyruvic transaminase (GPT), steatosis in abdominal ultrasound and various degrees of LS. Patients’ characteristics are detailed in Table 1.
| Parameter | Learning cohort (n = 50) | Validation cohort (n = 101) | ||
| mean | SD | mean | SD | |
| Male | 37 | 73 | ||
| Female | 13 | 28 | ||
| Age (yr) | 55.8 | 10.8 | 53.2 | 10.6 |
| BMI (kg/m²) | 26.0 | 4.4 | 25.4 | 4.2 |
| GOT (U/L) | 135.2 | 99.9 | 95.0 | 76.0 |
| GPT (U/L) | 104.6 | 173.4 | 90.2 | 133.7 |
| GGT (U/L) | 591.1 | 828.0 | 568.6 | 762.8 |
| AP (U/L) | 129.8 | 102.7 | 131.9 | 110.4 |
| Bilirubin (mg/dL) | 2.1 | 3.3 | 2.0 | 3.9 |
| Albumin (g/dL) | 4.0 | 0.6 | 4.0 | 0.7 |
| Protein (g/dL) | 7.0 | 0.7 | 7.0 | 0.8 |
| Quick (%) | 98.5 | 19.5 | 95.3 | 20.8 |
| INR | 1.0 | 0.2 | 1.0 | 0.2 |
| Urea | 32.5 | 42.5 | 27.1 | 31.8 |
| Creatinine (mg/dL) | 0.9 | 0.5 | 0.8 | 0.4 |
| PTT (s) | 34.9 | 7.6 | 35.1 | 7.9 |
| Hb (g/dL) | 13.7 | 1.9 | 13.5 | 2.0 |
| Hk (%) | 39.9 | 5.3 | 39.7 | 5.6 |
| Erythrocytes (/pL) | 4.1 | 0.6 | 4.0 | 0.6 |
| Leukocytes (/nL) | 7.0 | 2.0 | 7.3 | 2.9 |
| Thrombocytes (/nL) | 202.5 | 99.2 | 204.5 | 112.5 |
| Glucose (mg/dL) | 100.1 | 20.7 | 97.2 | 18.9 |
| HbA1C (%) | 5.7 | 1.7 | 5.5 | 1.3 |
| Triglycerides (mg/dL) | 222.4 | 259.5 | 204.1 | 208.8 |
| Cholesterin (mg/dL) | 217.5 | 51.8 | 212.5 | 63.6 |
| Ferritin (ng/mL) | 636.3 | 580.7 | 671.7 | 589.4 |
| Transferrin (g/L) | 2.2 | 0.4 | 2.1 | 0.5 |
| Iron (μg/dL) | 109.0 | 51.9 | 107.1 | 59.6 |
| CRP (mg/dL) | 2.2 | 3.8 | 2.3 | 3.1 |
| Alcohol (g/d) | 144.1 | 106.1 | 146.8 | 100.8 |
| LS (kPa) | 20.1 | 24.3 | 20.4 | 22.4 |
Alcohol detoxification was performed using a chlormethiazole standard tapering protocol for 3 to 10 d. Measurements of LS were performed on the day of admission and on the day of discharge from Salem Medical Center. Patients with additional or other liver disease and co-morbidities known to interfere with LS measurements such as liver tumors, congestive heart failure or extrahepatic cholestasis were excluded from the study.
Validation cohort: In the second part of our study we included 101 patients with histologically staged ALD, a full set of blood tests and FS examination at the time of liver biopsy. The cohort included 73 men and 28 women with a mean age of 53.6 ± 10.6 years. More patient details are given in Table 1. Importantly, the learning cohort and validation cohort did not differ significantly with regard to clinical parameters, age or gender. Liver biopsies were staged according to the Kleiner Score F0-F4[20]. F4 fibrosis was found in 26 patients (25.7%), F3 in 19 patients (18.8%), F2 in 36 patients (36.6%), F1 in 14 patients (13.8%), and F0 in 6 patients (5.9%). Thus, 45% had significant fibrosis stage F3-4.
LS was measured by FS (Echosens, Paris, France) as described recently in detail using the M probe[7]. The tip of the probe transducer was placed on the skin between the rib bones and the level of the right lobe of the liver. The measurement depth was between 25 and 65 mm below the skin surface. Ten measurements were performed with success rates of at least 60%. The results were expressed in kilopascals. The median value was taken as the representative value. Based on previous studies[10] and a recent meta-analysis[12], cut-off values of 8.0 and 12.5 kPa were considered to be optimal for detecting F3 and F4 fibrosis stages, respectively. LS values from 2.4 to 5.5 kPa are considered as normal[10] although no large F0 validated control groups have been studied so far. The mean interquartile range (IQR) was 16% in all measurements. FS measurements with an IQR higher than 40% were excluded. Five of the initial 106 patients (3.2%) were excluded because of invalid LS measurements or high IQR values.
Ultrasound examination was routinely performed in addition to FS measurements to exclude extrahepatic cholestasis, liver congestion or liver tumors after patients had fasted for at least 6 h Liver cirrhosis was suspected when 2 of the following criteria were present: (1) nodular aspect of the liver surface; (2) portal vein diameter > 12 mm; (3) collateral circulation; and (4) hypertrophy of segment 4 (quadrate lobe)[21].
Liver biopsy specimens were fixed in formalin and embedded in paraffin. All biopsy specimens were analyzed independently by 2 experienced pathologists (TL, PS) blinded to the results of FS and other clinical data. Liver fibrosis and necroinflammatory activity in patients with ALD were scored according to the recently established Kleiner score[20]. The length of each liver biopsy specimen (in millimeters) and the number of fragments were recorded. Only biopsies > 15 mm were included.
Correlations between changes in laboratory findings (serum transaminases, cholestasis parameters), LS and histological scores were calculated using the Spearman correlation for nonparametric variables (regression coefficient r, P). Differences were considered significant at P < 0.05. The diagnostic performance of FS was assessed by using receiver operating characteristic (ROC) curves. A patient was assessed as positive according to whether LS was greater than a given cut-off value. The ROC curve is a plot of sensitivity vs 1-specificity for all possible cut-off values. The most commonly used index of accuracy is the area under the ROC curve (AUROC), with values close to 1.0 indicating high diagnostic accuracy. As can be seen in the Results section from the box plot, only fibrosis stages F3 and F4 were successfully differentiated by FS. Therefore, AUROC and cut-off values were only determined for these fibrosis stages. All statistical analyses were performed with SPSS, version 12.0.1 (SPSS, Inc., Chicago, USA).
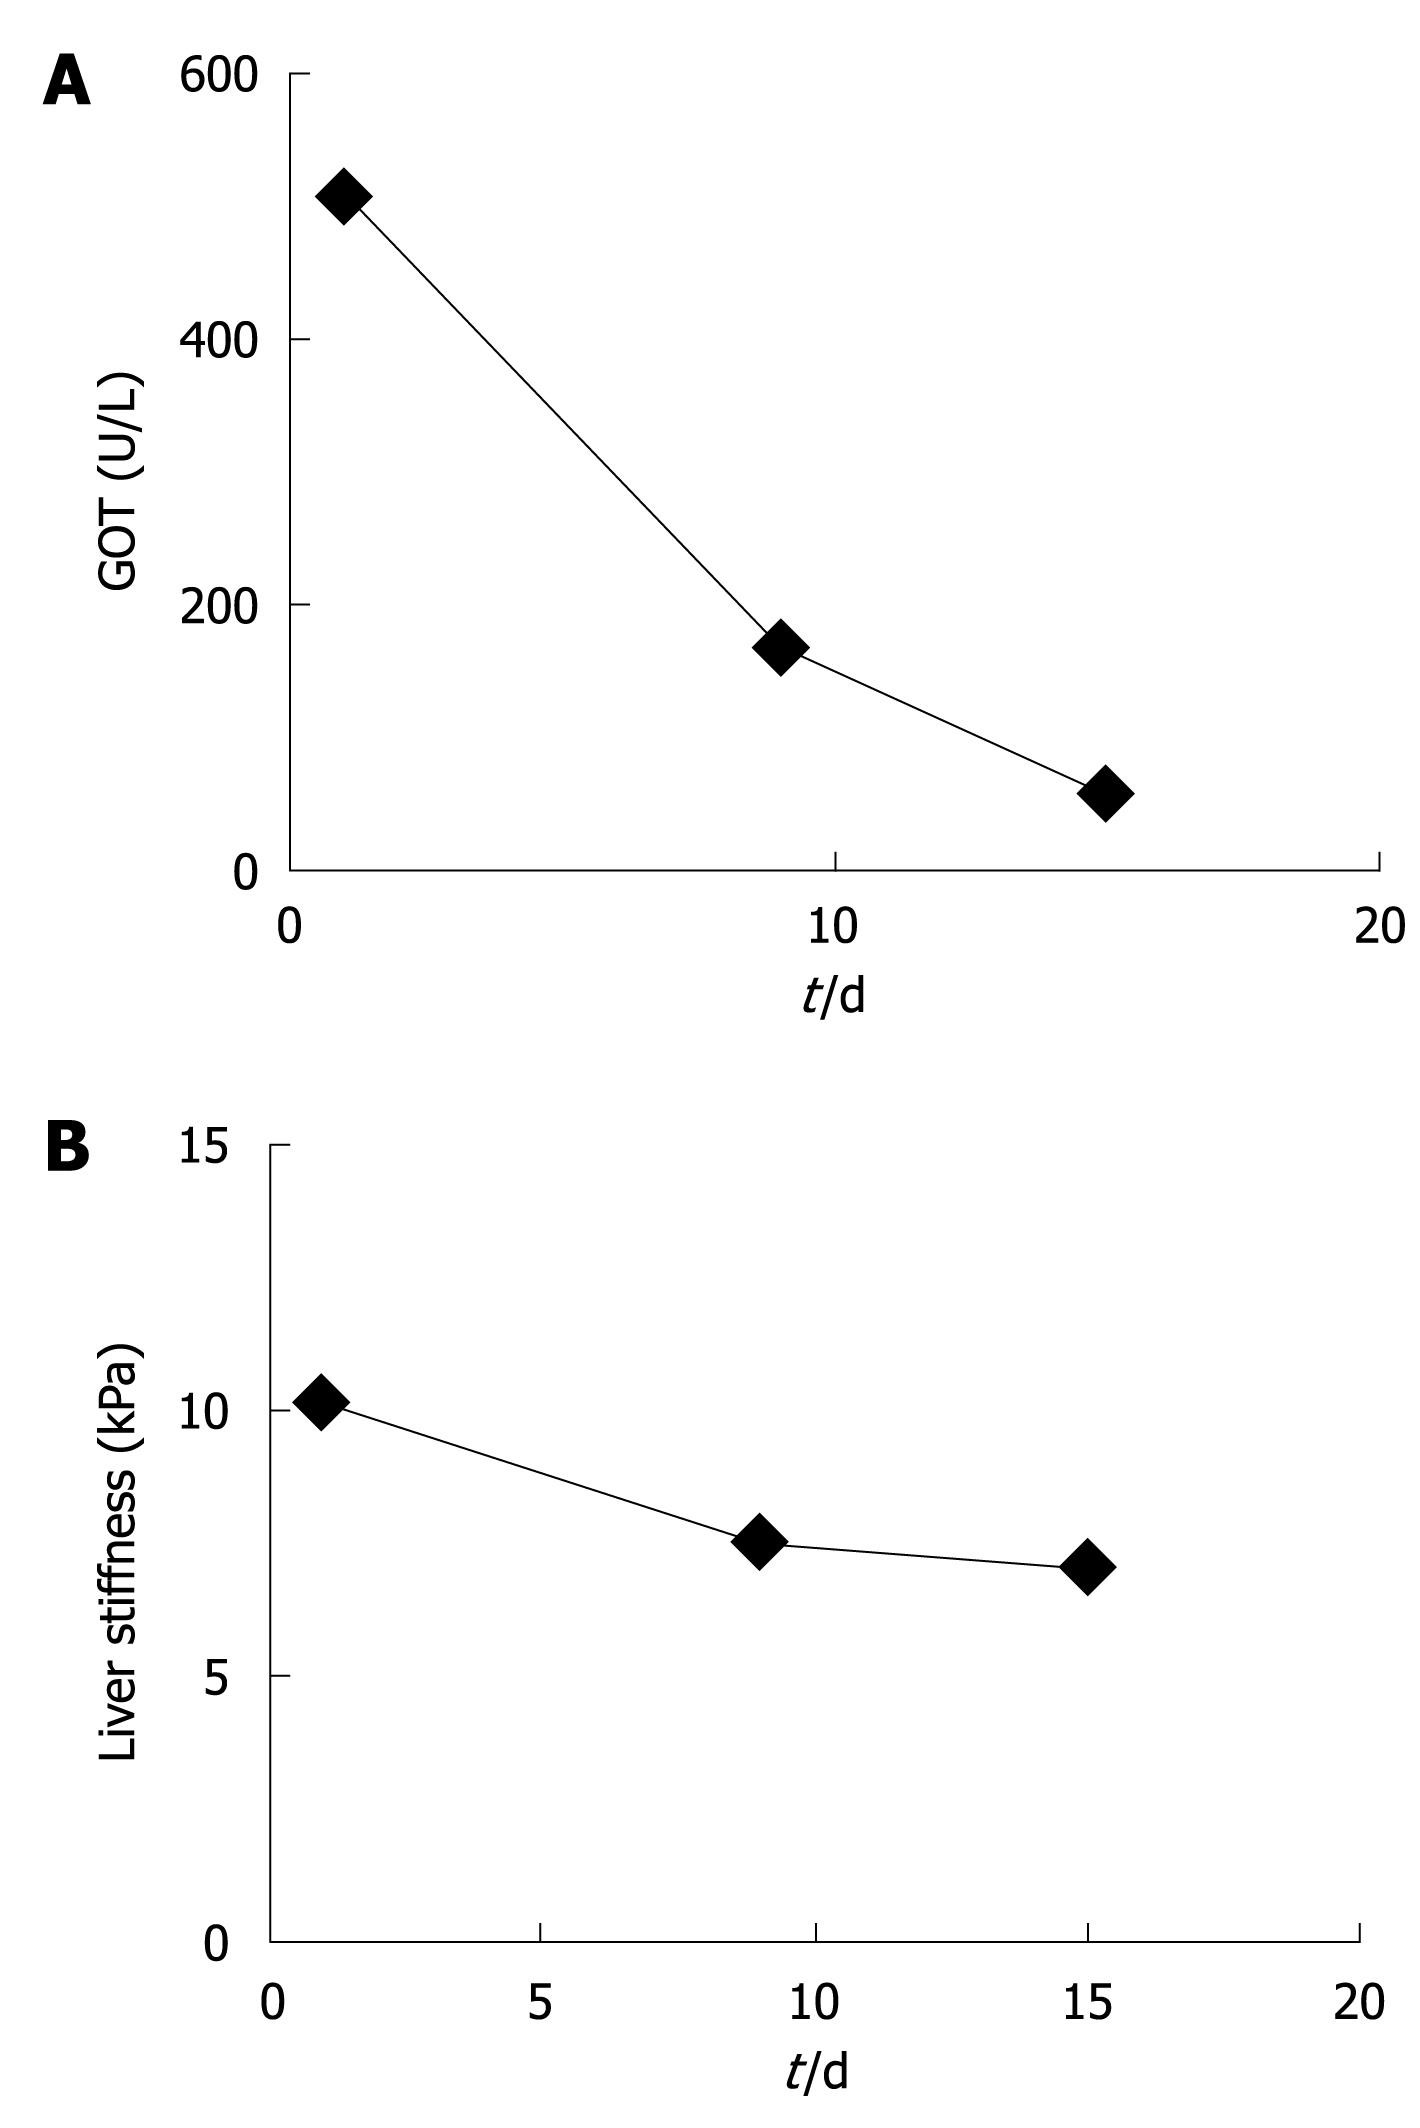
At first presentation, this female patient with chronic alcohol abuse presented with typical clinical and laboratory findings of acute and severe ASH with GOT of 511 U/L, GPT of 255 U/L and bilirubin of 3.5 mg/dL. The initial LS was 10.2 kPa which suggested advanced F3 fibrosis (Figure 1A and B). Within 9 d of alcohol detoxification, GOT decreased to 164 U/L and LS to 7.6 kPa. After another 6 d, GOT had almost normalized (55 U/L) while LS stabilized at 7.1 kPa. At the same time bilirubin had completely normalized. The patient was biopsied and histology confirmed a mild perivenular and periportal fibrosis (F2). This single case clearly demonstrated that LS increased as a result of steatohepatitis, irrespective of liver fibrosis. It also suggested that laboratory parameters such as GOT levels could be valuable bedside criteria to identify patients qualifying for reliable fibrosis assessment by FS.
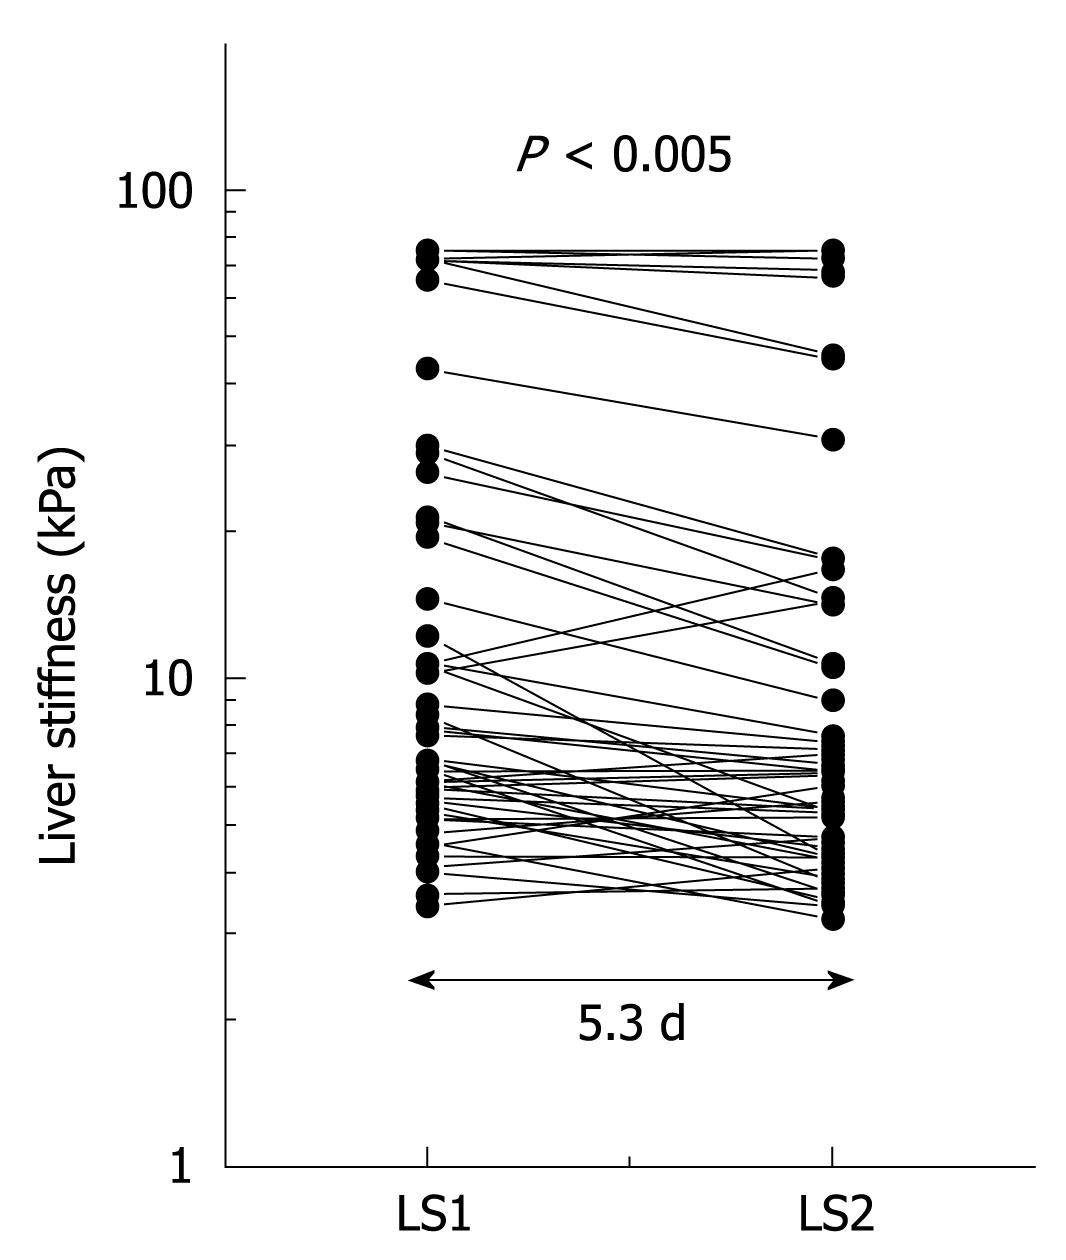
The observation above prompted us to sequentially study LS in patients with ALD undergoing alcohol detoxification under clinical surveillance (learning cohort). LS and serum transaminase activities in patients with various stages of fibrosis and steatohepatitis were obtained before and after detoxification from alcohol. Initial LS ranged from 2.5 to 75 kPa with 20 patients exceeding the cut-off value for F4 cirrhosis at 12.5 kPa. During the observation interval LS decreased significantly (P < 0.001; mean decrease in LS, 3.5 kPa; maximum decrease, 26.3 kPa). LS decreased in 6 patients (12%) below critical cut-off values of 12.5 kPa for F4 cirrhosis (n = 2) and 8.0 kPa for F3 fibrosis (n = 4). Figure 2 shows the 2 sequential LS measurements depicted as a semilogarithmic plot. A decrease in LS correlated significantly with a decrease in GOT (r = 0.30, P < 0.05) and bilirubin (r = 0.37, P < 0.05). In 50% of patients, transaminases completely normalized during alcohol detoxification.
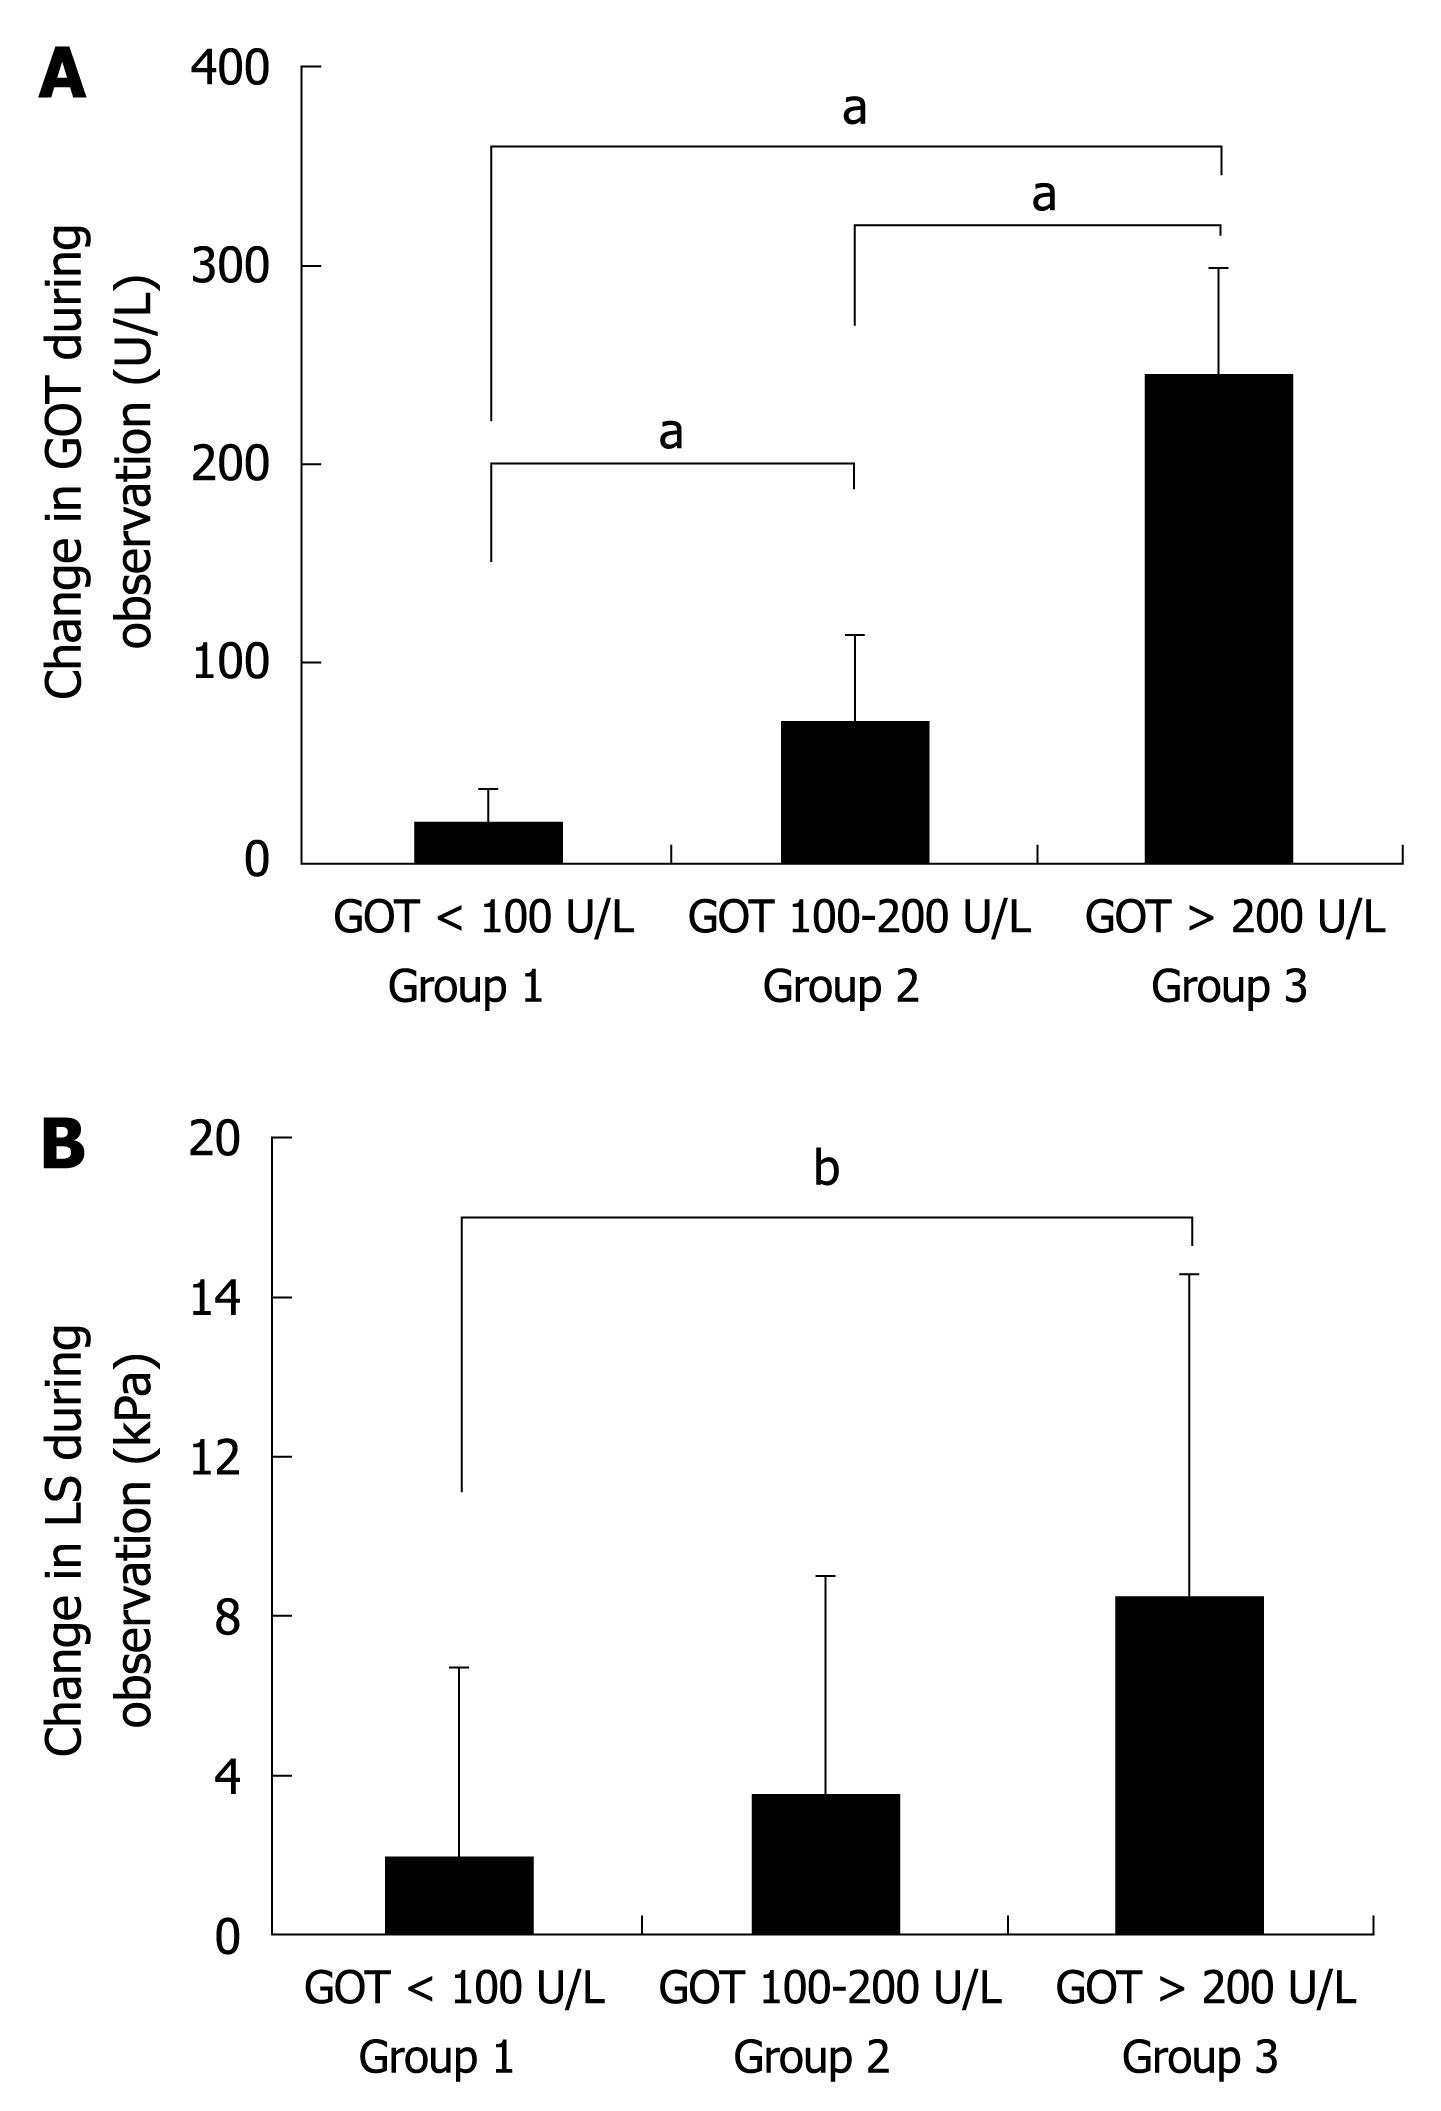
It is known that in ALD patients GOT levels highly correlate with histological degree of ASH[22,23]. We therefore divided all 50 patients into 3 groups according to their degree of inflammation (mild, medium, severe) represented by their initial levels of GOT (not shown). Group 1 included patients with severe ASH and GOT levels > 200 U/L, group 2 contained patients with GOT values between 100 and 200 U/L and group 3 patients with GOT values below 100 U/L. There was no significant difference between the 3 groups with respect to LS, observation interval, and IQR. However, as shown in Figure 3A, all groups differed significantly with regard to the mean decrease in GOT during alcohol withdrawal. Group 1 showed a mean GOT decrease of 244.8 U/L, group 2 of 70.1 U/L, and group 3 of 15.0 U/L. At the same time, LS decreased by 8.4, 3.5 and 1.8 kPa in groups 1, 2 and 3, respectively (Figure 3B) with a significant difference between group 1 and 3 (P < 0.01). In group 1, 6 out of 8 patients (75%) showed a decrease in LS below critical cut-off values for F3/F4 fibrosis of 8.0 and 12.5 kPa (not shown). In contrast, only 2 patients crossed the critical cut-off value in group 2 (9%) and none in group 3.
Two patients had an increase in LS from 10.2 to 14.4 kPa and 10.7 to 16.4 kPa during alcohol detoxification therapy. Patient 35 showed an increase in GOT levels and compliance to alcohol abstinence could be questioned in this case while the reason for increased LS in the other patient remained unclear. In conclusion, LS is more likely to decrease in ALD patients with high initial GOT levels but remains stable once GOT levels are below 100 U/L.
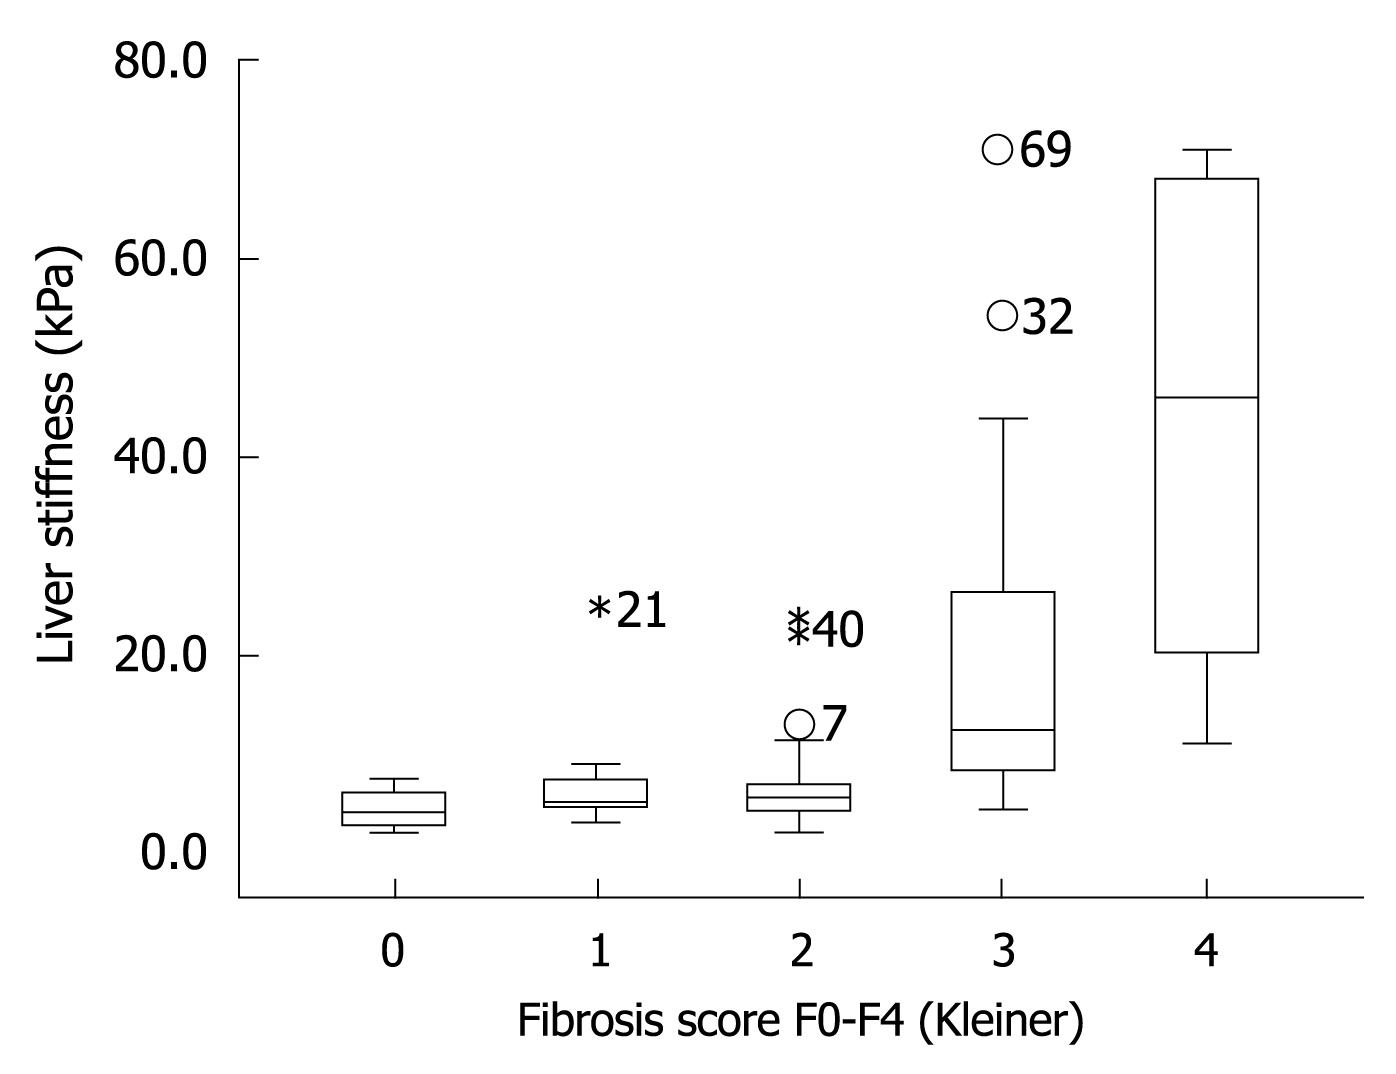
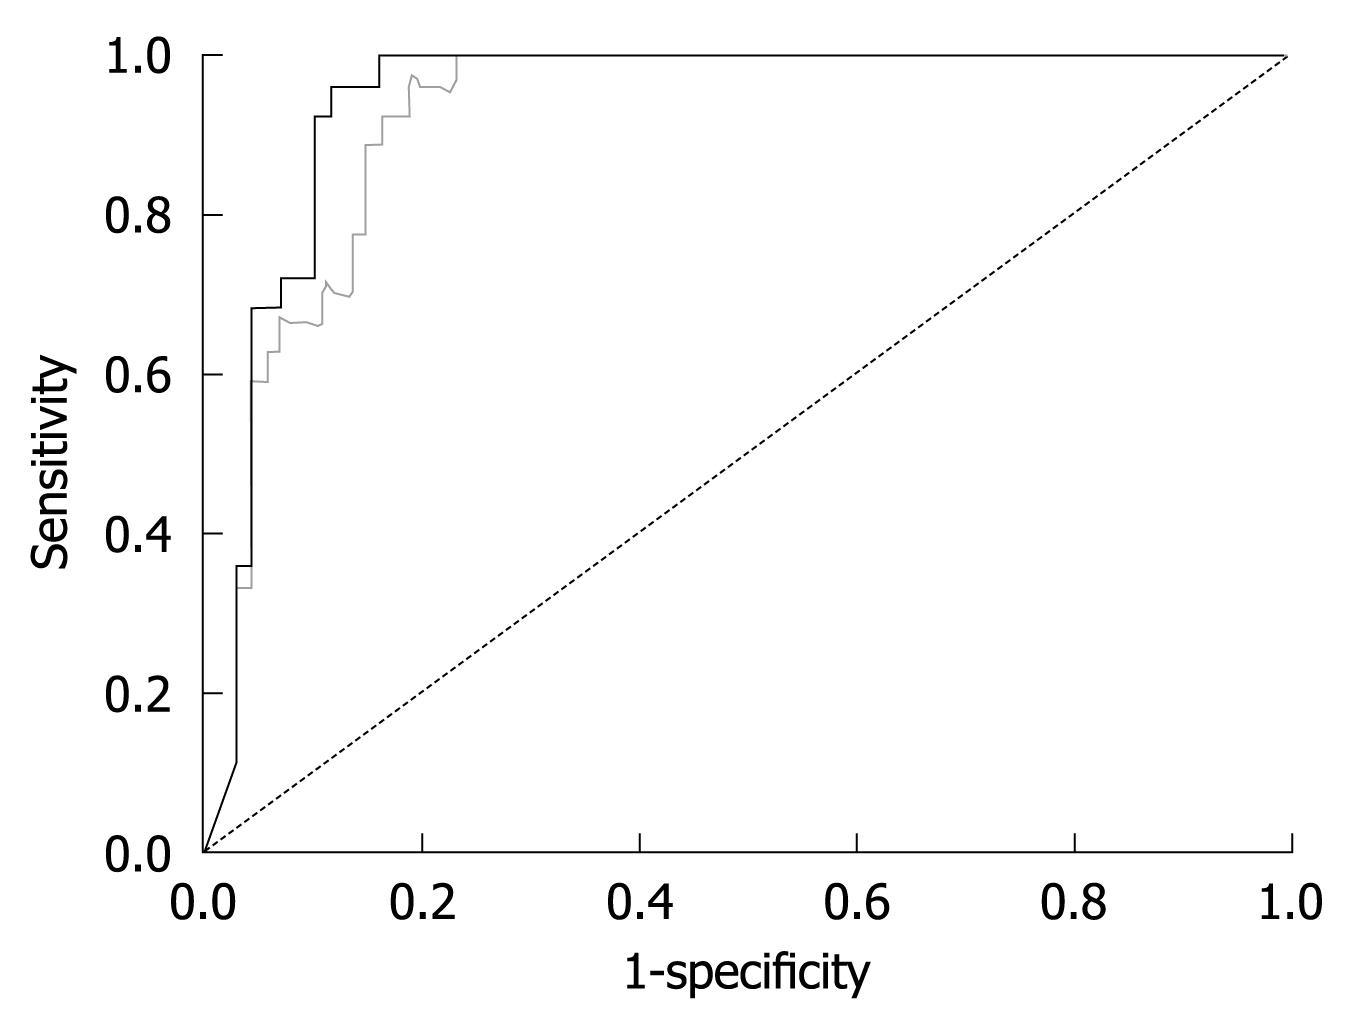
The finding that LS remained stable once GOT levels were below 100 U/L led us to the hypothesis that the diagnostic accuracy of FS will increase when ALD patients with GOT > 100 U/L are excluded. To test this hypothesis, we prospectively studied LS in our validation cohort of 101 consecutive patients with biopsy-staged ALD including or excluding patients with GOT > 100 U/L. The patients’ characteristics are given in Table 1. Including all patients we were able to show that LS correlated highly significantly with the histological fibrosis score (r = 0.72, P < 0.001) thus confirming recent studies[13,14]. As seen in the box plot (Figure 4), markedly elevated LS was mainly observed in advanced fibrosis (F3 and F4). Figure 5 shows the ROC curve for F4 fibrosis in the cohort of 101 patients including all patients (gray line). AUROC, which represents the diagnostic accuracy of a novel method as compared to the gold/best standard (histology) for fibrosis stage F4 was 0.921 (95% confidence interval, 0.87-0.97) (Table 2). We then identified 15 of these 101 patients (14.8%) with laboratory signs of significant ASH with an elevated GOT > 100 U/L. In 9 of these patients, there was a discrepancy between LS values of > 12.5 kPa but no histological evidence of liver cirrhosis. After exclusion of these patients with GOT > 100 U/L, AUROC for cirrhosis assessment by FS increased from 0.921 to 0.946, while specificity increased significantly from 80% to 90% at a sensitivity of 96%. Exclusion of patients with only a slight elevation of GOT (> 50 U/L) or histological signs of steatohepatitis did not further improve diagnostic accuracy for F4 fibrosis in our patient cohort. In contrast, diagnostic accuracy for F3 fibrosis (cut-off value 8 kPa) further improved when excluding patients with GOT > 50 U/L (Table 2). In summary, these data demonstrated that excluding patients with laboratory signs of ASH significantly improved the diagnostic accuracy of FS in detecting fibrosis.
| Area under the curve (AUROC) | Std. error | Cut-off value (kPa) | Sensitivity | Specificity | Number of includedpatients | |
| F4 | 0.921 | 0.03 | 11.5 | 1.00 | 0.77 | 101 |
| 12.51 | 0.961 | 0.801 | 1011 | |||
| F4 without GOT > 100 U/L | 0.944 | 0.02 | 11.5 | 1.00 | 0.84 | 86 |
| 12.51 | 0.951 | 0.901 | 861 | |||
| F4 without GOT > 50 U/L | 0.945 | 0.03 | 10.4 | 1.00 | 0.87 | 66 |
| 12.51 | 0.921 | 0.911 | 661 | |||
| F3/4 | 0.914 | 0.03 | 8.0 | 0.91 | 0.75 | 101 |
| F3/4 without GOT > 100 U/L | 0.922 | 0.03 | 8.0 | 0.87 | 0.87 | 80 |
| F3/4 without GOT > 50 U/L | 0.946 | 0.03 | 8.0 | 1.00 | 0.84 | 67 |
LS correlates well with the histological stage of liver fibrosis in various liver diseases including patients with ALD[7-14]. However, independent of the degree of fibrosis, LS is also increased in patients with inflammatory hepatitis[15-17], congestive heart failure[19] and cholestasis[18]. Therefore, refined clinical algorithms are required to exclude patients with increased LS as a result of such confounding factors.
We here found in a learning cohort of 50 patients with ALD that LS decreased significantly in patients with ALD following alcohol detoxification and resolution of steatohepatitis as measured by transaminases. The decrease in LS during alcohol detoxification could not be explained by changes in fibrosis stage given the short observation interval of 5.3 d. Therefore any change in LS must be attributed to other factors, most likely steatohepatitis. Of the serum transaminases, GOT showed the greatest correlation with the decrease in LS. This emphasizes the role of steatohepatitis in reversible elevation of LS. In fact, no significant changes in LS were observed in patients with GOT < 100 U/L, which fits clinical data indicating that at GOT levels < 100 U/L no relevant steatohepatitis has been demonstrated[22,23].
After demonstrating that resolution of steatohepatitis decreased LS, we tested the hypothesis that the accuracy of cirrhosis detection can be increased by excluding patients with clinically relevant steatohepatitis. A validation cohort of 101 patients with histologically confirmed ALD was established and we compared FS accuracy in the whole cohort, and after excluding those patients with relevant clinical steatohepatitis (defined as GOT > 100 U/L). Indeed, including only ALD patients with GOT levels < 100 U/L increased the sensitivity and specificity of LS in diagnosing liver cirrhosis. We therefore suggest that GOT levels should be considered when assessing fibrosis by transient elastography in patients with ALD, and that elevated LS values at GOT > 100 U/L should be interpreted with caution because of the possibility of falsely elevated LS as a result of steatohepatitis.
This improvement in diagnostic accuracy is remarkable since any increase in AUROC above 0.9 is an important improvement given a prevalence of significant disease (F3/F4) of > 40% and an assumed ‘best scenario’ of liver biopsy accuracy of 90%[24]. We would also like to point out that the impact of these novel criteria clearly depends on the percentage of patients with significant ASH, which was rather low (< 15%) in our study cohort. The combined effect of both inflammation and fibrosis on LS in patients with ALD may also explain the unusually high cut-off values for F4 cirrhosis of 19.5 kPa and 22.6 kPa and a rather low AUROC of 0.87 that has recently been reported in patients with ALD[13,14].
Although the rule of GOT < 100 U/L seems to be sufficient to eliminate any inflammation-based interference on F4 fibrosis assessment by FS, even modest signs of inflammation become relevant for lower fibrosis stages such as F3. Thus, our analysis showed that assessment of F3 fibrosis by FS was further improved if LS measurements were restricted to patients with completely normalized GOT levels. This outcome can be explained by the fact that the cut-off value for F3 fibrosis (8 kPa) can be easily reached by even mild steatohepatitis.
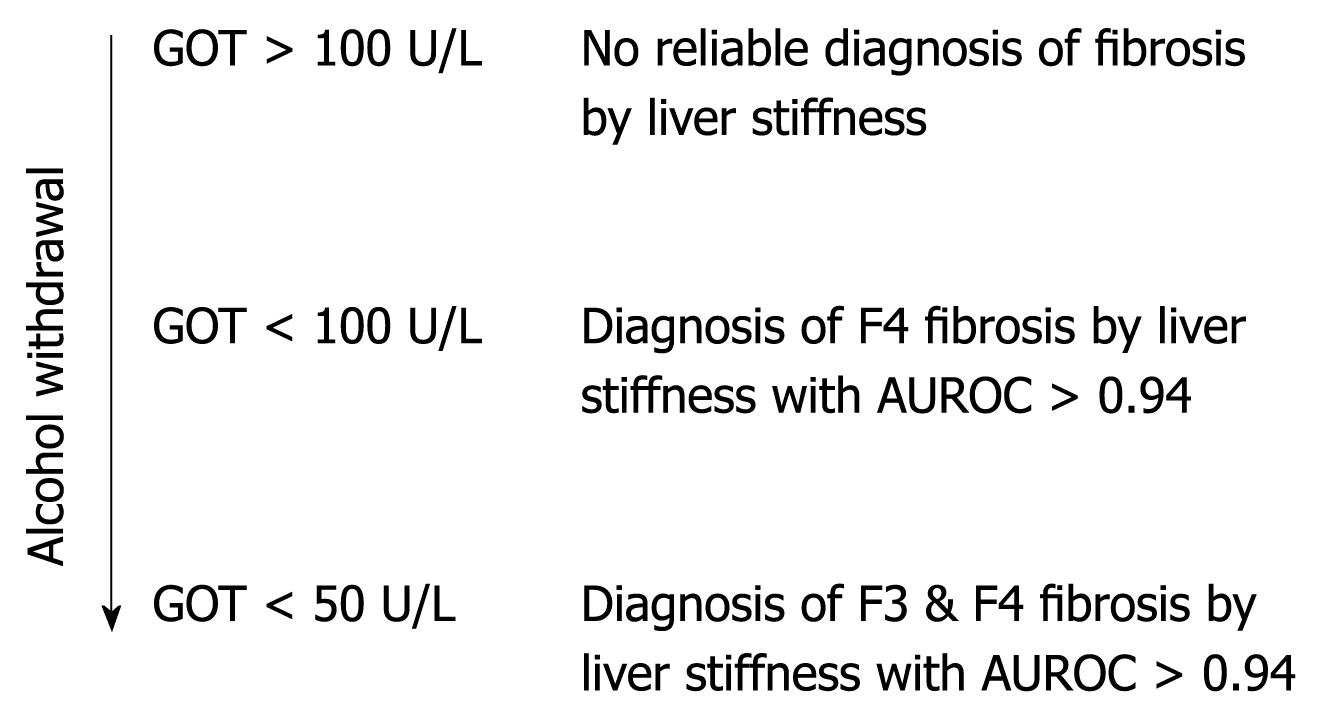
We conclude that, in patients with ALD, a more accurate noninvasive assessment of fibrosis stage by transient elastography can be achieved if the degree of steatohepatitis is considered. A clinical algorithm is proposed in Figure 6. It should be mentioned that other known interferences with LS assessment such as liver metastasis, mechanic cholestasis[18] or liver congestion[19] should also be excluded at the time of transient elastography. Finally, we suggest that these criteria may also be useful in improving the assessment of noninvasive fibrosis by FS in patients with other liver diseases.
Transient elastography (Fibroscan®) is a new ultrasound technology where the liver stiffness (LS) is measured via propagation velocity of an ultrasound wave. LS is low (2-6 kPa) in the soft healthy liver but dramatically increased in liver cirrhosis (up to 75 kPa). Fibroscan is now widely studied since it is a reliable, easy to perform and noninvasive bedside test to screen for liver cirrhosis. However, recent studies showed that LS is also increased under conditions other than cirrhosis namely liver congestion, cholestasis and inflammation (hepatitis). In particular, inflammation is a common confounding factor for chronic liver disease and novel algorithms are required to clearly determine whether LS is increased as a result of cirrhosis or inflammation. Dr. Sebastian Mueller and his colleagues from Heidelberg University identified in their recent study novel bedside criteria that allowed the differentiation of cirrhosis from inflammation in patients with alcoholic liver disease (ALD), the most common liver disease in developed countries.
In a cohort of 50 patients who were hospitalized for alcohol withdrawal LS was analyzed for about a week in parallel with liver blood tests. LS decreased in all patients during alcohol withdrawal owing to reduction in liver inflammation and normalization of liver blood tests. In 6 of these 50 patients, the initial LS value had suggested liver cirrhosis but, after alcohol withdrawal, it decreased below the critical cut-off and misdiagnosis of liver cirrhosis could be avoided. Glutamic oxaloacetic transaminase (GOT) values > 100 U/L indicated inflammatory interference, while at lower counts LS was a reliable parameter for determining inflammation-independent liver fibrosis. Therefore the hypothesis was generated that measuring LS after resolution of the inflammation and at GOT levels < 100 U/L would result in more accurate assessment of LS. To test this hypothesis 100 patients with ALD underwent liver biopsy and LS determination at the same time. Comparing the stage of liver fibrosis assessed by liver biopsy with LS showed concordance in 92% of patients. When those patients with elevated liver enzyme counts > 100 U/L were excluded, transient elastography increased in accuracy for diagnosing liver cirrhosis to 94.5%.
The study defined novel bedside criteria based on liver transaminases that optimized noninvasive diagnosis of liver cirrhosis in patients with ALD. Active inflammation of the liver (steatohepatitis) should be excluded first by blood tests prior to the noninvasive assessment of liver fibrosis by transient elastography. If GOT levels are < 100 U/L, the LS value can identify liver fibrosis and can be used as a diagnostic tool.
The novel criteria should be applied to all LS measurements with ongoing steatohepatitis (increased transaminases in the blood test). Thus, a blood test is required for the correct interpretation of LS data. These novel criteria probably also hold true for other liver disease.
This is an interesting paper on a highly relevant topic. The presence of steatohepatitis was evidenced by increased GOT.
Peer reviewer: Dr. Søren Møller, Chief, Physician, Department of Clinical Physiology 239, Hvidovre Hospital, Kettegaard alle 30, DK-2650 Hvidovre, Denmark
S- Editor Wang YR L- Editor Cant MR E- Editor Zheng XM
| 1. | Bravo AA, Sheth SG, Chopra S. Liver biopsy. N Engl J Med. 2001;344:495-500. [Cited in This Article: ] |
| 2. | Abdi W, Millan JC, Mezey E. Sampling variability on percutaneous liver biopsy. Arch Intern Med. 1979;139:667-669. [Cited in This Article: ] |
| 3. | Bedossa P, Dargère D, Paradis V. Sampling variability of liver fibrosis in chronic hepatitis C. Hepatology. 2003;38:1449-1457. [Cited in This Article: ] |
| 4. | Cadranel JF, Rufat P, Degos F. Practices of liver biopsy in France: results of a prospective nationwide survey. For the Group of Epidemiology of the French Association for the Study of the Liver (AFEF). Hepatology. 2000;32:477-481. [Cited in This Article: ] |
| 5. | Maharaj B, Maharaj RJ, Leary WP, Cooppan RM, Naran AD, Pirie D, Pudifin DJ. Sampling variability and its influence on the diagnostic yield of percutaneous needle biopsy of the liver. Lancet. 1986;1:523-525. [Cited in This Article: ] |
| 6. | Regev A, Berho M, Jeffers LJ, Milikowski C, Molina EG, Pyrsopoulos NT, Feng ZZ, Reddy KR, Schiff ER. Sampling error and intraobserver variation in liver biopsy in patients with chronic HCV infection. Am J Gastroenterol. 2002;97:2614-2618. [Cited in This Article: ] |
| 7. | Sandrin L, Fourquet B, Hasquenoph JM, Yon S, Fournier C, Mal F, Christidis C, Ziol M, Poulet B, Kazemi F. Transient elastography: a new noninvasive method for assessment of hepatic fibrosis. Ultrasound Med Biol. 2003;29:1705-1713. [Cited in This Article: ] |
| 8. | Foucher J, Castéra L, Bernard PH, Adhoute X, Laharie D, Bertet J, Couzigou P, de Lédinghen V. Prevalence and factors associated with failure of liver stiffness measurement using FibroScan in a prospective study of 2114 examinations. Eur J Gastroenterol Hepatol. 2006;18:411-412. [Cited in This Article: ] |
| 9. | Erhardt A, Lörke J, Vogt C, Poremba C, Willers R, Sagir A, Häussinger D. [Transient elastography for diagnosing liver cirrhosis]. Dtsch Med Wochenschr. 2006;131:2765-2769. [Cited in This Article: ] |
| 10. | Castéra L, Vergniol J, Foucher J, Le Bail B, Chanteloup E, Haaser M, Darriet M, Couzigou P, De Lédinghen V. Prospective comparison of transient elastography, Fibrotest, APRI, and liver biopsy for the assessment of fibrosis in chronic hepatitis C. Gastroenterology. 2005;128:343-350. [Cited in This Article: ] |
| 11. | Ganne-Carrié N, Ziol M, de Ledinghen V, Douvin C, Marcellin P, Castera L, Dhumeaux D, Trinchet JC, Beaugrand M. Accuracy of liver stiffness measurement for the diagnosis of cirrhosis in patients with chronic liver diseases. Hepatology. 2006;44:1511-1517. [Cited in This Article: ] |
| 12. | Friedrich-Rust M, Ong MF, Martens S, Sarrazin C, Bojunga J, Zeuzem S, Herrmann E. Performance of transient elastography for the staging of liver fibrosis: a meta-analysis. Gastroenterology. 2008;134:960-974. [Cited in This Article: ] |
| 13. | Nguyen-Khac E, Chatelain D, Tramier B, Decrombecque C, Robert B, Joly JP, Brevet M, Grignon P, Lion S, Le Page L. Assessment of asymptomatic liver fibrosis in alcoholic patients using fibroscan: prospective comparison with seven non-invasive laboratory tests. Aliment Pharmacol Ther. 2008;28:1188-1198. [Cited in This Article: ] |
| 14. | Nahon P, Kettaneh A, Tengher-Barna I, Ziol M, de Lédinghen V, Douvin C, Marcellin P, Ganne-Carrié N, Trinchet JC, Beaugrand M. Assessment of liver fibrosis using transient elastography in patients with alcoholic liver disease. J Hepatol. 2008;49:1062-1068. [Cited in This Article: ] |
| 15. | Coco B, Oliveri F, Maina AM, Ciccorossi P, Sacco R, Colombatto P, Bonino F, Brunetto MR. Transient elastography: a new surrogate marker of liver fibrosis influenced by major changes of transaminases. J Viral Hepat. 2007;14:360-369. [Cited in This Article: ] |
| 16. | Arena U, Vizzutti F, Corti G, Ambu S, Stasi C, Bresci S, Moscarella S, Boddi V, Petrarca A, Laffi G. Acute viral hepatitis increases liver stiffness values measured by transient elastography. Hepatology. 2008;47:380-384. [Cited in This Article: ] |
| 17. | Sagir A, Erhardt A, Schmitt M, Häussinger D. Transient elastography is unreliable for detection of cirrhosis in patients with acute liver damage. Hepatology. 2008;47:592-595. [Cited in This Article: ] |
| 18. | Millonig G, Reimann FM, Friedrich S, Fonouni H, Mehrabi A, Büchler MW, Seitz HK, Mueller S. Extrahepatic cholestasis increases liver stiffness (FibroScan) irrespective of fibrosis. Hepatology. 2008;48:1718-1723. [Cited in This Article: ] |
| 19. | Millonig G, Friedrich S, Adolf S, Fonouni H, Golriz M, Mehrabi A, Stiefel P, Pöschl G, Büchler MW, Seitz HK. Liver stiffness is directly influenced by central venous pressure. J Hepatol. 2010;52:206-210. [Cited in This Article: ] |
| 20. | Kleiner DE, Brunt EM, Van Natta M, Behling C, Contos MJ, Cummings OW, Ferrell LD, Liu YC, Torbenson MS, Unalp-Arida A. Design and validation of a histological scoring system for nonalcoholic fatty liver disease. Hepatology. 2005;41:1313-1321. [Cited in This Article: ] |
| 21. | Di Lelio A, Cestari C, Lomazzi A, Beretta L. Cirrhosis: diagnosis with sonographic study of the liver surface. Radiology. 1989;172:389-392. [Cited in This Article: ] |
| 22. | Talley NJ, Roth A, Woods J, Hench V. Diagnostic value of liver biopsy in alcoholic liver disease. J Clin Gastroenterol. 1988;10:647-650. [Cited in This Article: ] |
| 23. | Chedid A, Mendenhall CL, Gartside P, French SW, Chen T, Rabin L. Prognostic factors in alcoholic liver disease. VA Cooperative Study Group. Am J Gastroenterol. 1991;86:210-216. [Cited in This Article: ] |


