Copyright
©The Author(s) 2003.
World J Gastroenterol. Jul 15, 2003; 9(7): 1521-1524
Published online Jul 15, 2003. doi: 10.3748/wjg.v9.i7.1521
Published online Jul 15, 2003. doi: 10.3748/wjg.v9.i7.1521
Figure 1 SDS-PAGE analyses of the purified HBx.
SDS-PAGE showed a single band at the expected molecular weights (lane 1).
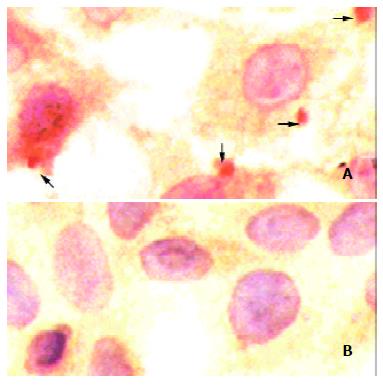
Figure 2 Immunocytochemical detection of HBx aggregates within HepG2 cells (magnification, × 400).
HBx aggregates were clearly visible as granules within the cytoplasm (A). HBx could not be detected within control cells transfected with pIRES-EGFP (B).
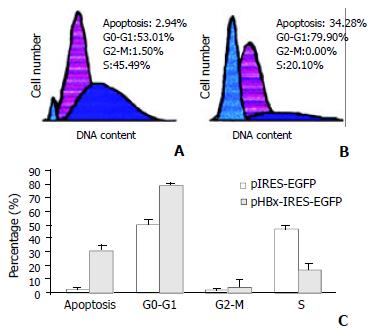
Figure 3 Flow cytometric analysis of apoptosis and cell cycle phases of HepG2 cells.
(A) Control cells transfected with vector alone did not contain HBx. (B) Cells transiently transfected with the HBx expression plasmid. Apoptosis was significantly increased in HepG2 cells compared with control cells without HBx (C, P < 0.02). Cells displayed a marked decrease in S phase (P < 0.02) and demonstrated an evident increase in G0-G1 fraction (P < 0.01) with control expression vector that lacked the HBx gene (C).
- Citation: Song CZ, Bai ZL, Song CC, Wang QW. Aggregate formation of hepatitis B virus X protein affects cell cycle and apoptosis. World J Gastroenterol 2003; 9(7): 1521-1524
- URL: https://www.wjgnet.com/1007-9327/full/v9/i7/1521.htm
- DOI: https://dx.doi.org/10.3748/wjg.v9.i7.1521


