Copyright
©The Author(s) 2003.
World J Gastroenterol. May 15, 2003; 9(5): 978-983
Published online May 15, 2003. doi: 10.3748/wjg.v9.i5.978
Published online May 15, 2003. doi: 10.3748/wjg.v9.i5.978
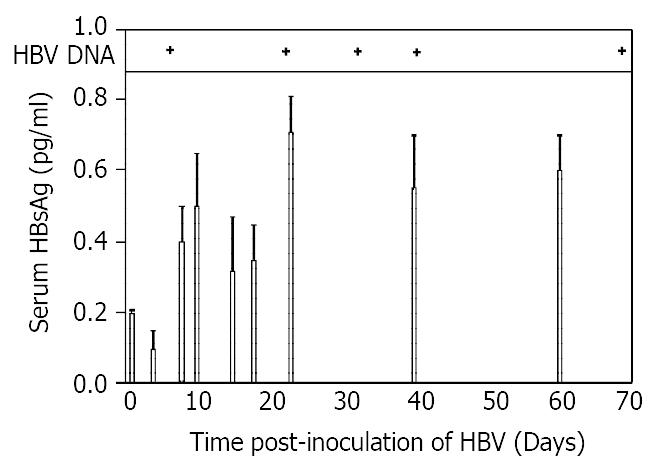
Figure 1 Composite time course of HBsAg, HBV DNA in serum.
Levels of HBsAg in rat serum were measured as a function of time after inoculation using an enzyme-linked immunoassay kit as described in Materials and Methods. Assays were done in triplicate, and the results expressed as means ± SD in units of pg/ml serum. HBV DNA was extracted from rat serum, and amplified with primers spanning nt 2079-2434 of the adw HBV genome. Upper panel, serum positive for HBV DNA. Lower panel, HBsAg levels.
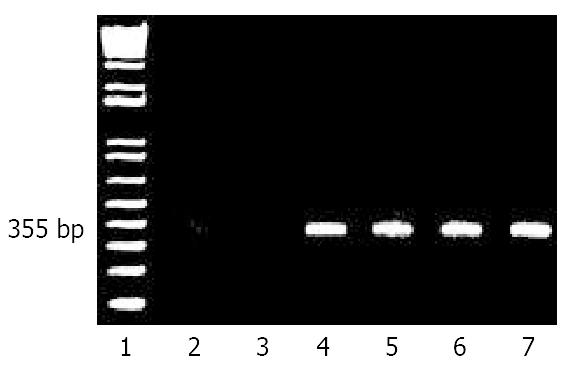
Figure 2 Detection and time course of HBV RNA in liver.
Poly A(+) RNA from livers were isolated, reverse transcribed and amplified by PCR as described in Materials and Methods to generate a 355 bp fragment. Lane 1, molecular size markers; lane 2, normal untreated rat liver; lane 3, Huh7 human liver cell line; lane 4, HepG2 2.2.15 cells which constitutively pro-duce infectious HBV particles. Livers from rats after tolerization and transplantation with human hepatocytes and subsequent inoculation with HBV after 1 week, lane 5; 6 weeks, lane 6, and 14 weeks, lane 7.
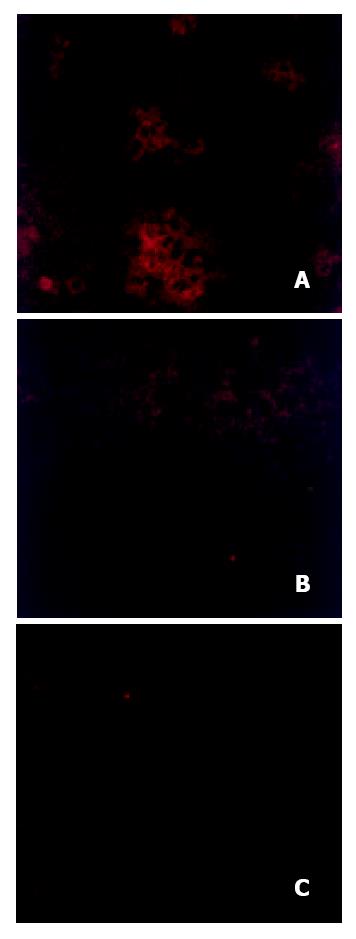
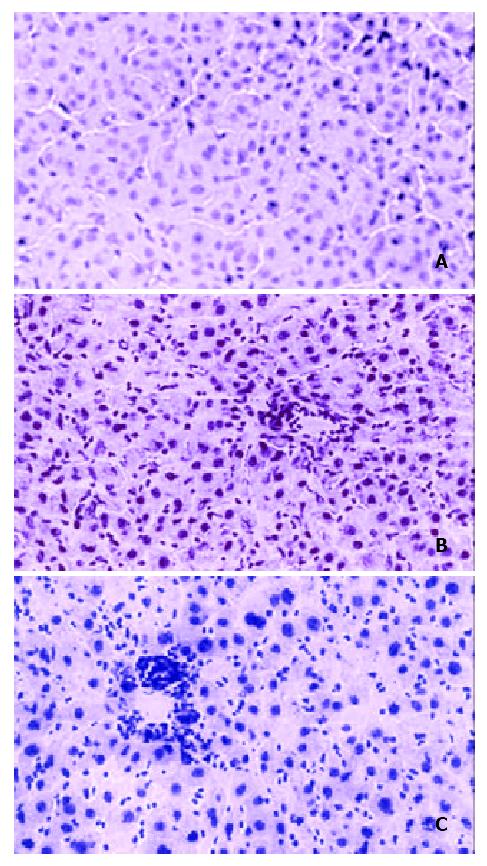
Figure 3 Detection of HBcAg in livers of rats transplanted and inoculated with HBV.
Livers were removed 14 weeks after inoculation with HBV, incubated with anti-HbcAb and rhodamine-conjugated secondary antibody as described in Materials and Methods. Figure 3A, a rat tolerized, transplanted, and inoculated with HBV; Figure 3B a rat tolerized and inoculated, but not transplanted; Figure 3C, an untreated rat.
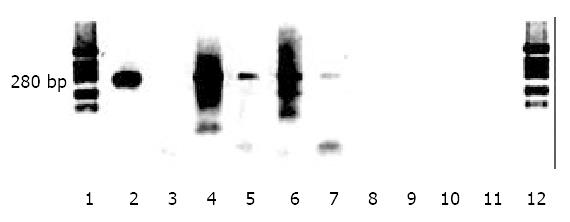
Figure 4 Detection of HBV cccDNA in liver.
Low molecular weight DNA was extracted from liver, digested with Mung Bean nuclease or amplified by PCR without nuclease digestion as described in Materials and Methods. Lane 1, molecular weight markers; lane 2, 5 μg DNA from HepG2 2.2.15 cell media (containing partially double stranded viral DNA); lane 3, 25 μg DNA from HepG2 2.2.15 cell media plus 0.1 U Mung Bean nuclease pretreatment; lane 4, 5 μg DNA from HepG2 2. 2.15 cell layer; lane 5, 5 μg DNA from HepG2 2.2.15 cell layer plus 0.1 U nuclease pretreatment; lane 6, 5 μg liver DNA from a tolerized, transplanted and HBV inoculated rat; lane 7, 5 μg liver DNA from a tolerized, transplanted and HBV inoculated rat; plus 0.1 U nuclease; lane 8, 5 μg liver DNA from a non-transplanted rat inoculated with HBV; lane 9, 5 μg liver DNA from a non-transplanted rat inoculated with HBV plus 0.1 U nuclease; lane 10, 5 μg DNA from an untreated rat; lane 11, 5 μg DNA from an untreated rat plus 0.1 U nuclease; lanes 1 and 12, molecular size markers.
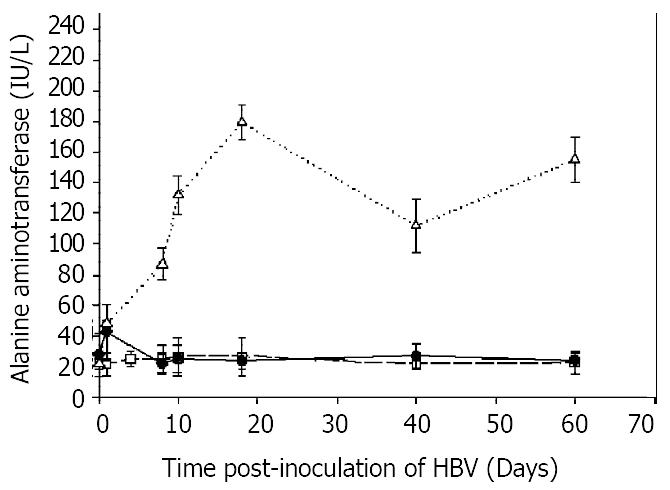
Figure 5 Time course of ALT.
To detect possible liver damage following inoculation of HBV, aliquots of rat serum, 10 μl, were assayed for ALT spectrophotometrically as described in Materials and methods. All assays were performed in triplicate and results expressed as means ± SD in units of IU/L. Rats tolerized transplanted and inoculated with HBV, open triangles; rats inoculated with HBV, had a slight increase in ALT on the first day, solid squares; rats transplanted, but not inoculated with HBV, open squares.
- Citation: Wu CH, Ouyang EC, Walton C, Promrat K, Forouhar F, Wu GY. Hepatitis B virus infection of transplanted human hepatocytes causes a biochemical and histological hepatitis in immunocompetent rats. World J Gastroenterol 2003; 9(5): 978-983
- URL: https://www.wjgnet.com/1007-9327/full/v9/i5/978.htm
- DOI: https://dx.doi.org/10.3748/wjg.v9.i5.978


