Copyright
©The Author(s) 2003.
World J Gastroenterol. Apr 15, 2003; 9(4): 660-664
Published online Apr 15, 2003. doi: 10.3748/wjg.v9.i4.660
Published online Apr 15, 2003. doi: 10.3748/wjg.v9.i4.660
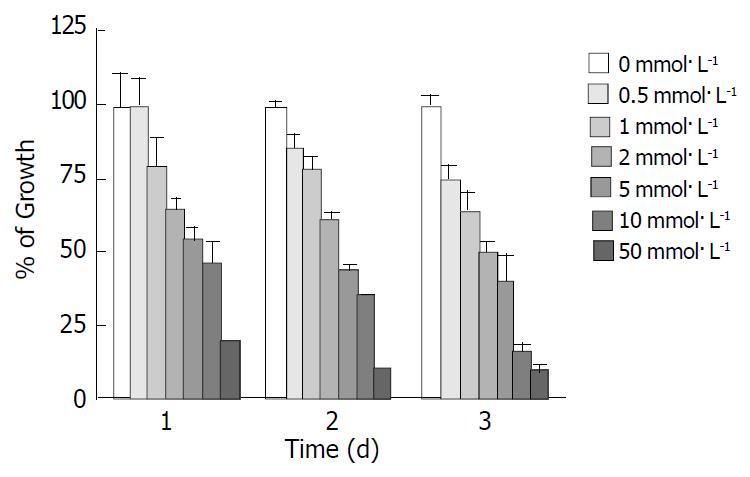
Figure 1 Effect of tributyrin on cell growth in SGC-7901 cells.
The cells were treated with various concentrations of tribu-tyrin for 24, 48 and 72 h. The antiproliferative effect was mea-sured by MTT assay. Results were expressed as the means ± SD from three independent determinations.
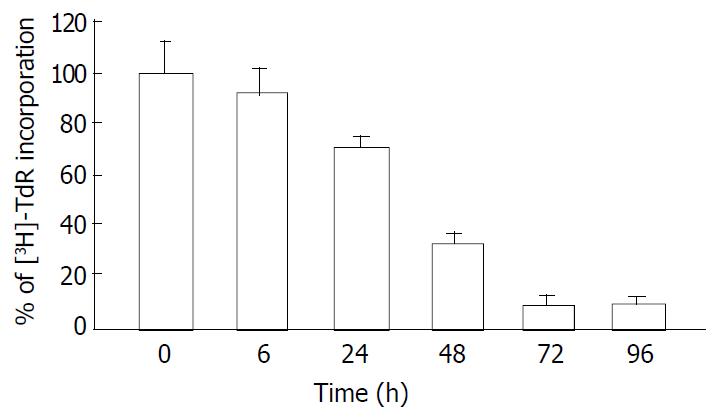
Figure 2 Inhibitory effect of tributyrin on DNA synthesis in-corporated with 3H-TdR.
With the concentration of 2 mmol·L-1, tributyrin inhibited the [3H]-TdR uptake by SGC-7901 cells in a time-dependent manner. Results were expressed as means ± SD from three independent determinations.
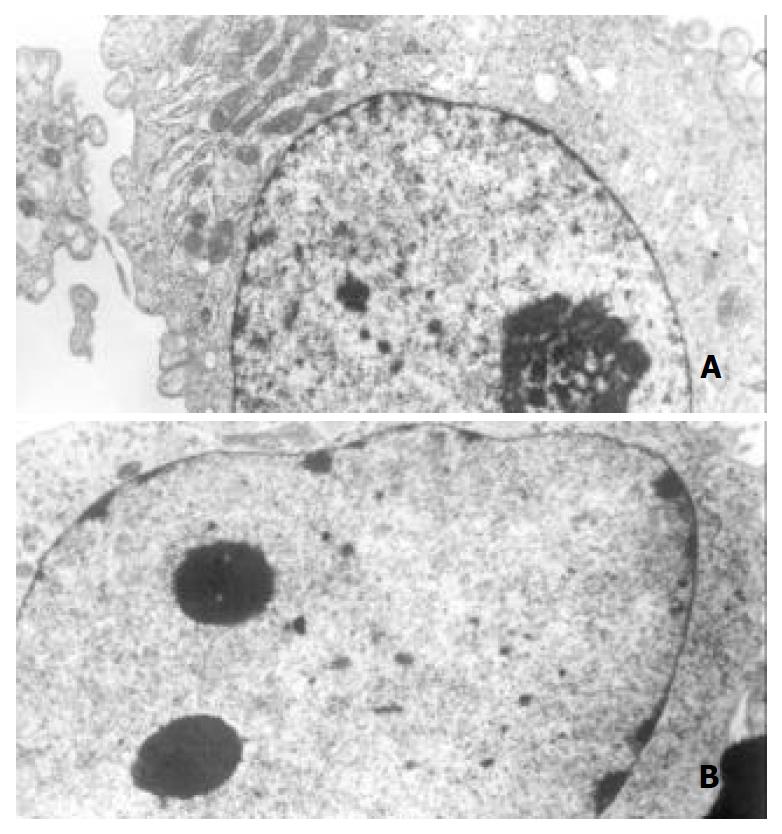
Figure 3 Ultrastructural changes of the gastric cancer cells treated with 2 mmol·L-1 tributyrin for 48 h.
(A) The control SGC-7901 cell; (B) the experimental cell showing early changes of apoptosis in which nuclear chromatin condensation and cell shrinkage were observed (B).
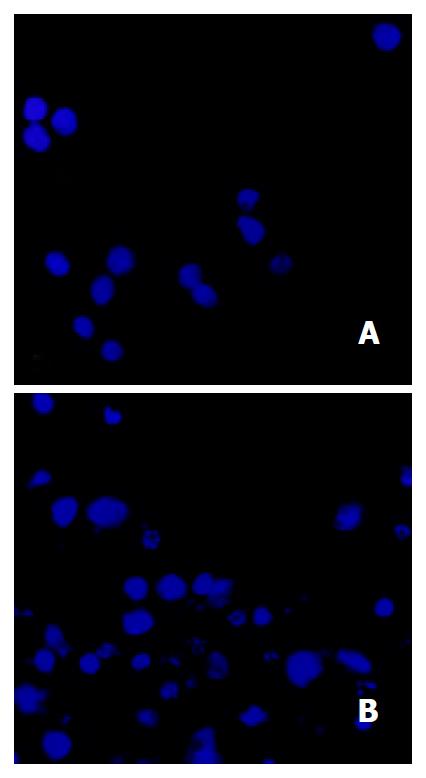
Figure 4 Tributyrin-induced apoptosis in SGC-7901 cells stained with Hoechst-33258.
A: the control SGC-7901 cells; B: the experimental cells showing nuclear shrinkage or fragmentation.
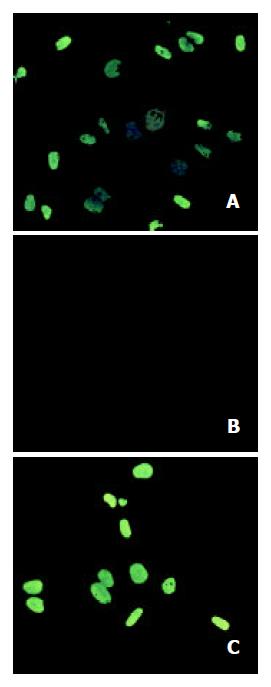
Figure 5 Tributyrin-induced apoptosis by TUNEL assay.
A: the positive control cells; B: the negative control cells; C: the experi-mental cells treated with tributyrin at 2 mmol·L-1 for 2 d.
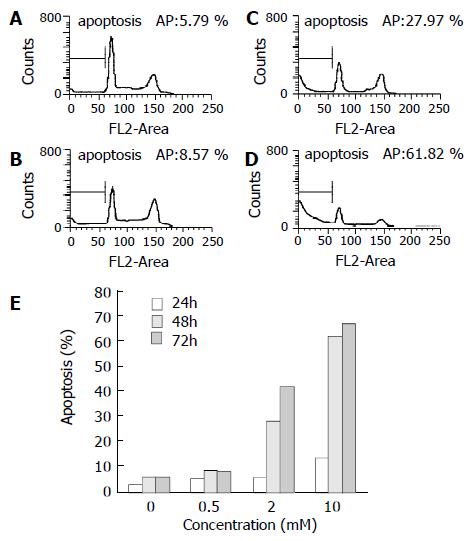
Figure 6 Tributyrin-induced apoptosis in SGC-7901 cells by flow cytometry.
(A) The control cells, (B)-(D) The experimental cells treated with tributyrin at 0.5, 2 and 10 mmol·L-1 respectively for 48 h. (E) Apoptosis rates in SGC-7901 cells treated with 0.5, 2 and 10 mmol·L-1 or without tributyrin for the indicated times.
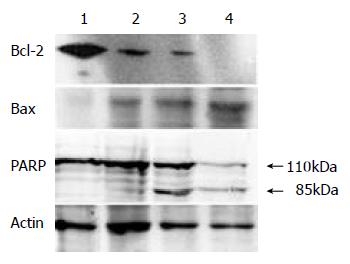
Figure 7 The expression of Bcl-2, Bax protein and PARP cleav-age in tributyrin-treated SGC-7901 cells.
(1) The control cells; (2)-(4) The experimental cells treated with tributyrin for 48 h at 0.5, 2 and 10 mmol.L-1, respectively.
- Citation: Yan J, Xu YH. Tributyrin inhibits human gastric cancer SGC-7901 cell growth by inducing apoptosis and DNA synthesis arrest. World J Gastroenterol 2003; 9(4): 660-664
- URL: https://www.wjgnet.com/1007-9327/full/v9/i4/660.htm
- DOI: https://dx.doi.org/10.3748/wjg.v9.i4.660


