Copyright
©The Author(s) 2003.
World J Gastroenterol. Mar 15, 2003; 9(3): 622-626
Published online Mar 15, 2003. doi: 10.3748/wjg.v9.i3.622
Published online Mar 15, 2003. doi: 10.3748/wjg.v9.i3.622
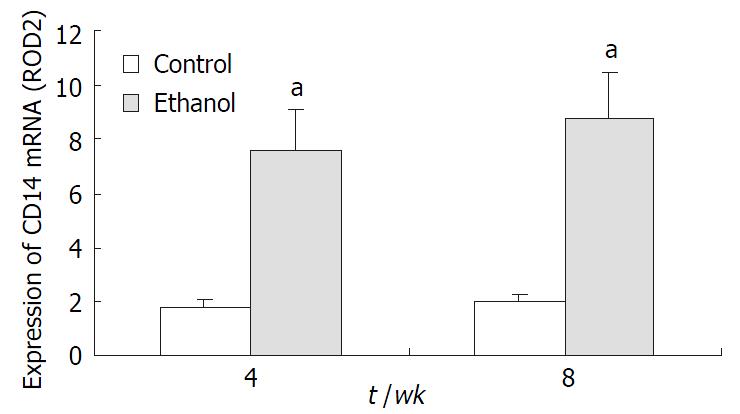
Figure 1 Expression of CD14 mRNA in KCs.
aP < 0.05 vs controls.
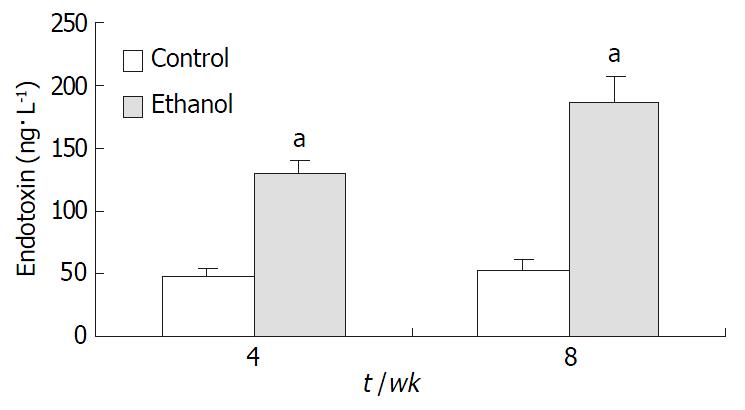
Figure 2 Changes of endotoxin levels.
aP < 0.05, vs controls.
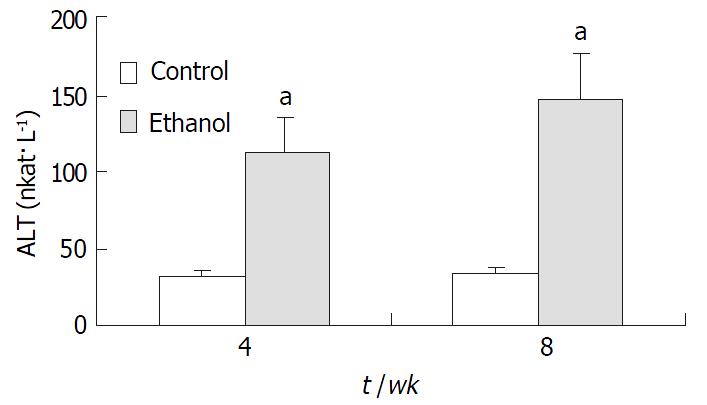
Figure 3 Changes of serum alanine transaminase levels.
aP < 0.05, vs controls.
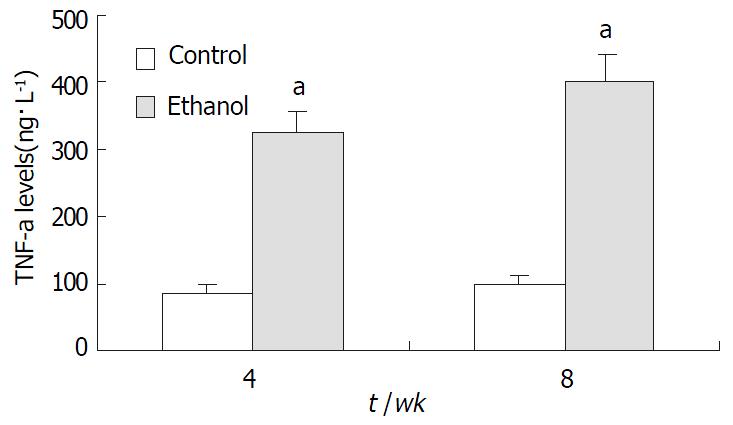
Figure 4 Changes of TNF-α concentrations.
aP < 0.05 vs controls.
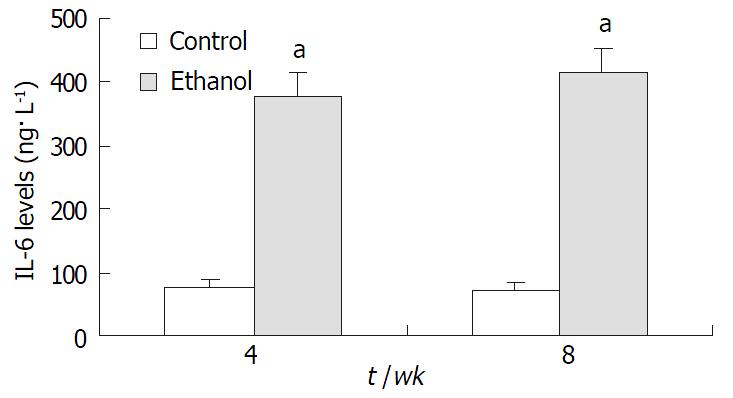
Figure 5 Changes of IL-6 concentations.
aP < 0.05 vs controls.
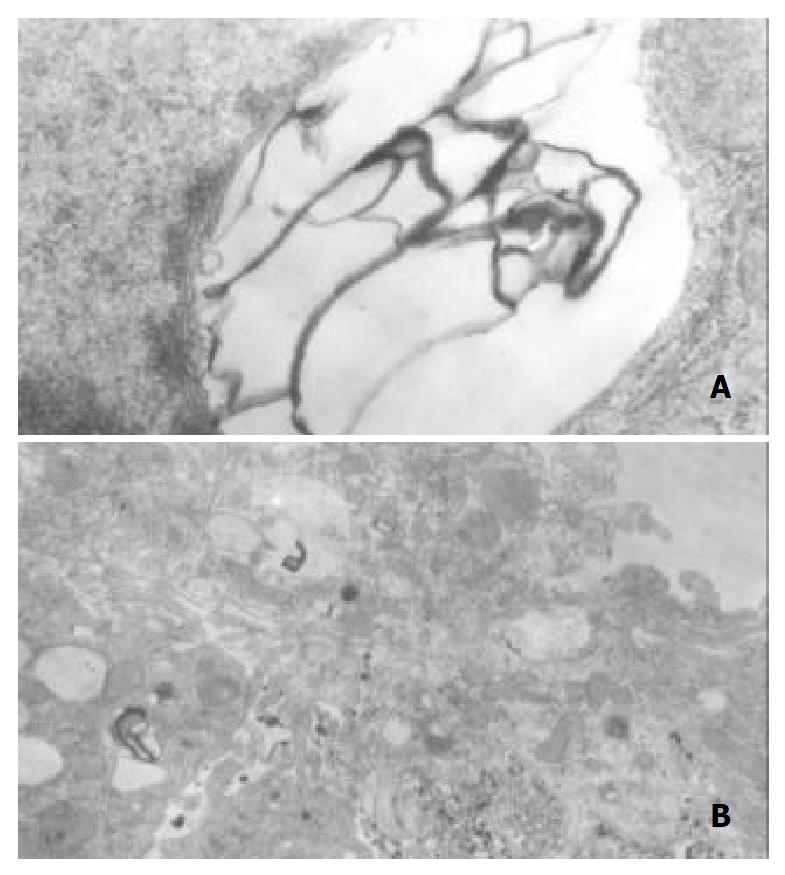
Figure 6 Ethanol-fed rats.
A: Huge focal cytoplasmic degen-eration in the cytoplasm of hepatocyte TEM × 30000; B: Many focal cytoplasmic degeneration and myelin figures in the cyto-plasm of KC TEM × 15000.
- Citation: Dai LL, Gong JP, Zuo GQ, Wu CX, Shi YJ, Li XH, Peng Y, Deng W, Li SW, Liu CA. Synthesis of endotoxin receptor CD14 protein in Kupffer cells and its role in alcohol-induced liver disease. World J Gastroenterol 2003; 9(3): 622-626
- URL: https://www.wjgnet.com/1007-9327/full/v9/i3/622.htm
- DOI: https://dx.doi.org/10.3748/wjg.v9.i3.622


