Copyright
©The Author(s) 2003.
World J Gastroenterol. Mar 15, 2003; 9(3): 479-484
Published online Mar 15, 2003. doi: 10.3748/wjg.v9.i3.479
Published online Mar 15, 2003. doi: 10.3748/wjg.v9.i3.479
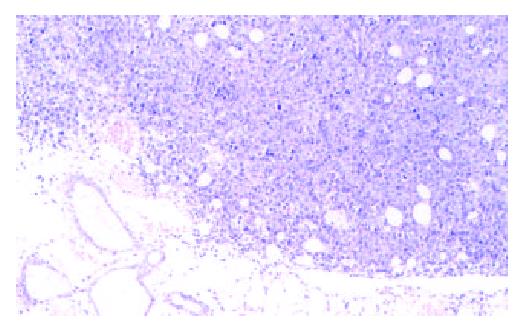
Figure 1 Tumor tissue after 14 d subcutaneous incubation.
HE, 3.3 × 10
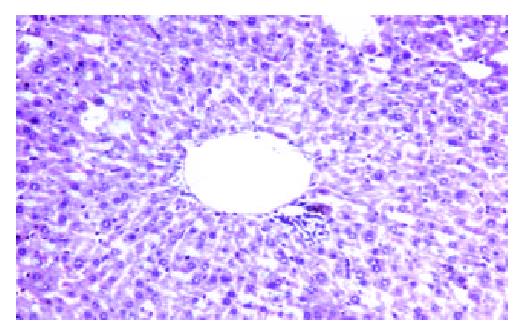
Figure 2 Liver tissue of 14 d after hybrid vaccine injection by tail veil HE, 3.
3 × 20.
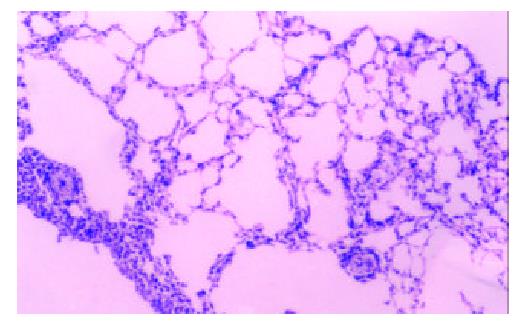
Figure 3 Lung tissue of 14 d after hybrid vaccine injection by tail veil HE, 3.
3 × 20.
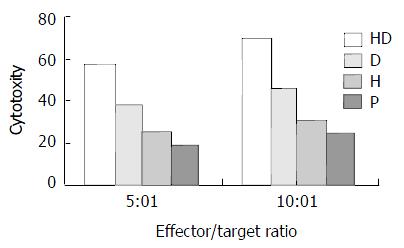
Figure 4 CTL activity of different subgroup at different effec-tor/target ratio.
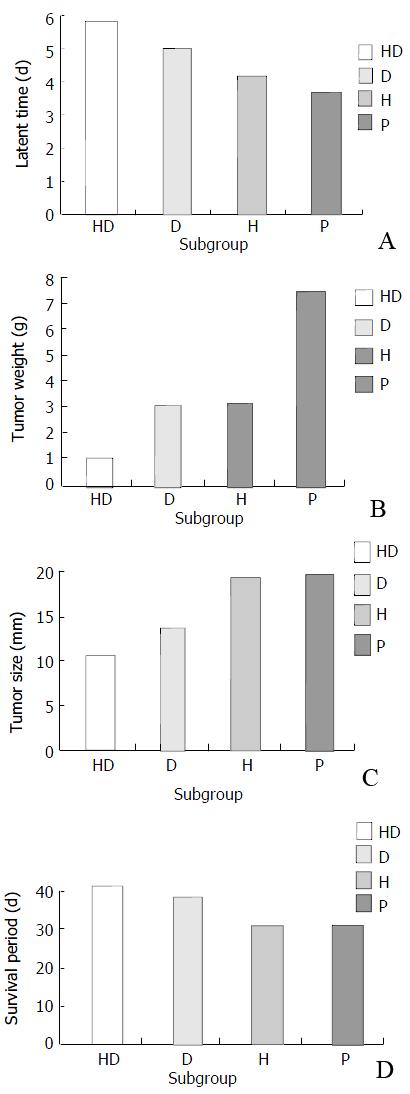
Figure 5 A: Comparison of latent time among different subgroups.
B: Comparison of tumor weight among different subgroups. C: Comparison of tumor size among different subgroups. D: Comparison of survival period among different subgroups.
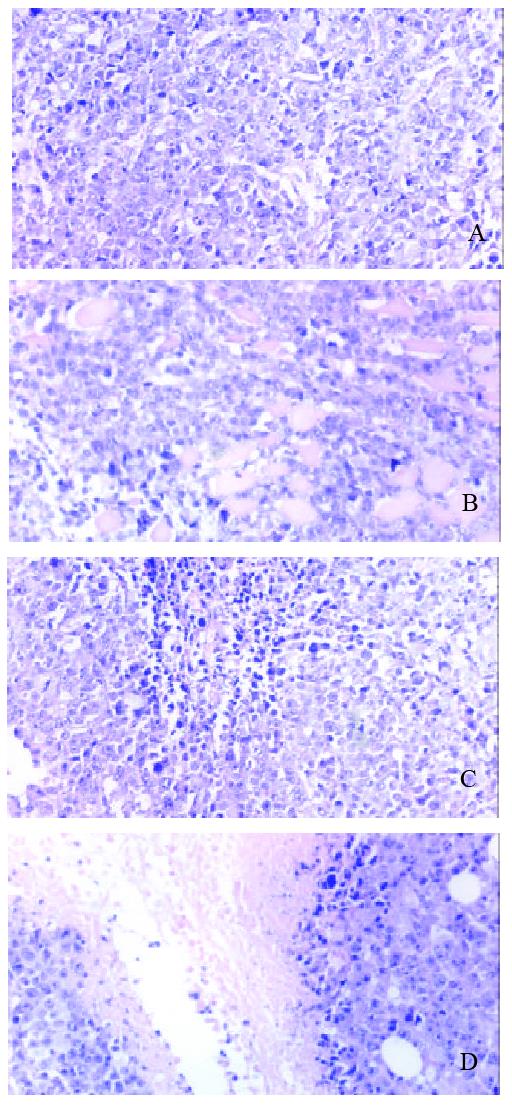
Figure 6 A: There isn’t obvious necrosis in tumor tissue of 14 d in pretective group P subgroup.
HE, 3.3×20. B: There is dot like necrosis in tumor tissue of 14 d in pretective group H subgroup. HE, 3.3×20. C: There is sheet like necrosis in tumor tissue of 14 d in pretective group D subgroup. HE, 3.3×20. D: There is extensive necrosis in tumor tissue of 14 d in pretective group HD subgroup. HE, 3.3 × 20.
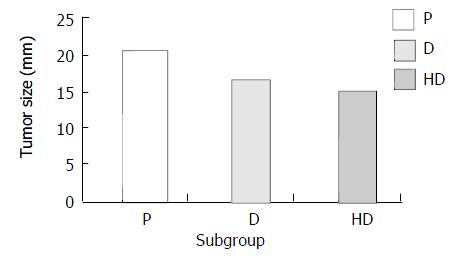
Figure 7 Comparison of tumor size on day 14 among different subgroups of therapeutic group.
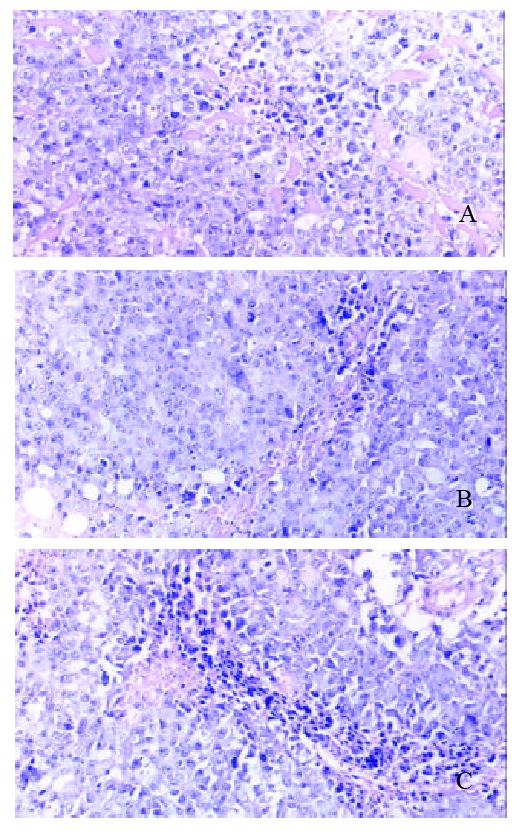
Figure 8 A: There is dot or sheet like necrosis in tumor tissue of 14d in therapeutic group P subgroup.
HE, 20×3.3. B: There is sheet like necrosis in tumor tissue of 14 d in therapeutic group D subgroup. HE, 20×3.3. C: There is sheet like necrosis in tumor tissue of 14 d in therapeutic group HD subgroup. HE, 20 × 3.3.
-
Citation: Zhang JK, Li J, Zhang J, Chen HB, Chen SB. Antitumor immunopreventive and immunotherapeutic effect in mice induced by hybrid vaccine of dendritic cells and hepatocarcinoma
in vivo . World J Gastroenterol 2003; 9(3): 479-484 - URL: https://www.wjgnet.com/1007-9327/full/v9/i3/479.htm
- DOI: https://dx.doi.org/10.3748/wjg.v9.i3.479


