Copyright
©The Author(s) 2003.
World J Gastroenterol. Mar 15, 2003; 9(3): 474-478
Published online Mar 15, 2003. doi: 10.3748/wjg.v9.i3.474
Published online Mar 15, 2003. doi: 10.3748/wjg.v9.i3.474
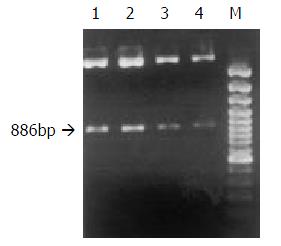
Figure 1 pRcHCNS3-5’digested with Xbal.
Lane M:DNA marker (GenerulerTM 100bpDNA). Lane: 1, 2, 3, 4 plasmid pRcHCNS3-5’ with 886bp fragment. ( × 100).
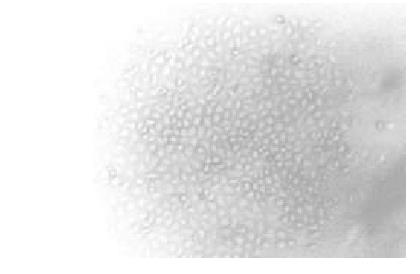
Figure 2 Colony formation of pRcHCNS3-5’ transfected QSG7701 cells in G418 ( × 100).
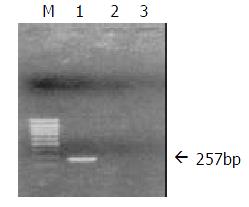
Figure 3 PCR analysis of DNA from QSG7701 transfected with pRcHCNS3-5’ and pRcCMV; Lane M: 100bp marker; Lane 1: pRcHCNS3-5’ transfected cells; Lane 2: pRcCMV transfected cells; Lane 3: QSG parental cells.
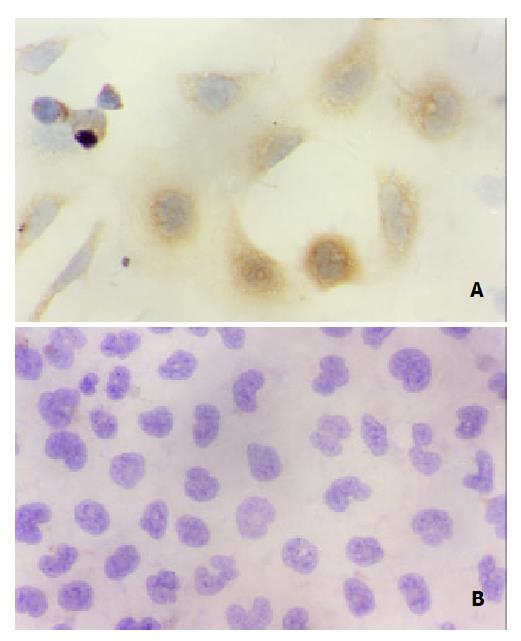
Figure 4 Immunohistochemistry analysis (S-P) of HCV N protein expression in pRcHCNS3-5’ transfected cells (up) and the negative control without positive signal (down) (×400).
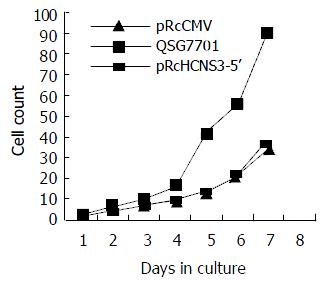
Figure 5 Proliferation rate of cells transfected with pRcHCNS3-5’, pRcCMV and parental QSG7701cells.
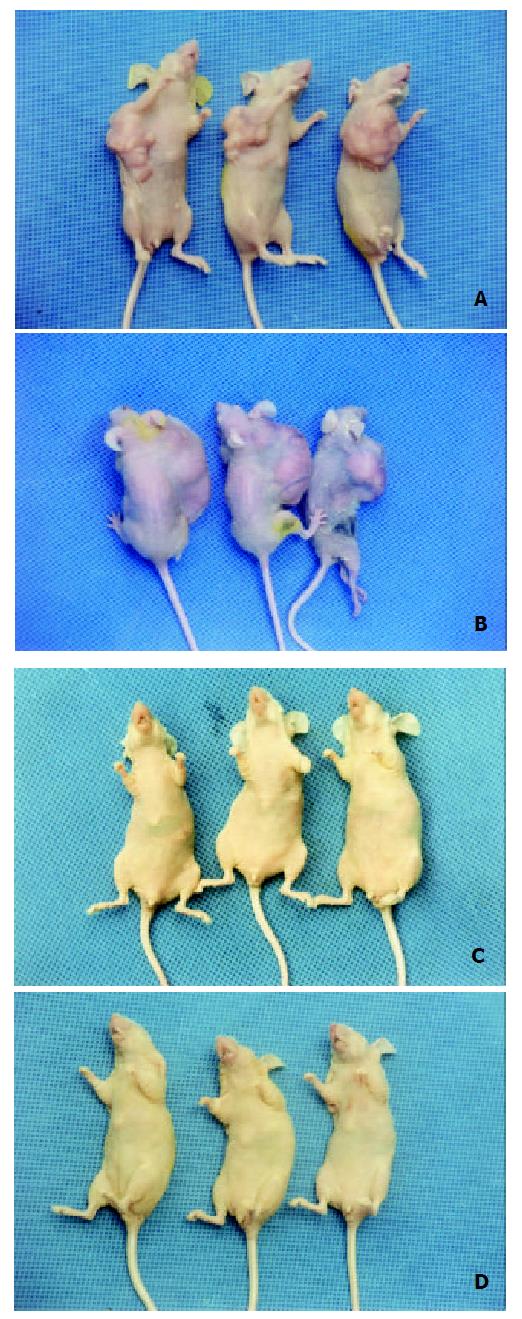
Figure 6 Tumor development in nude mice, 6a, 6b, 6c and 6d show inoculated with pRcHCNS3-5’transfecting QSG7701 cells, HepG2 cells, QSG7701 cells transfected with pRcCMV and pa-rental QSG7701 cells, respectively.
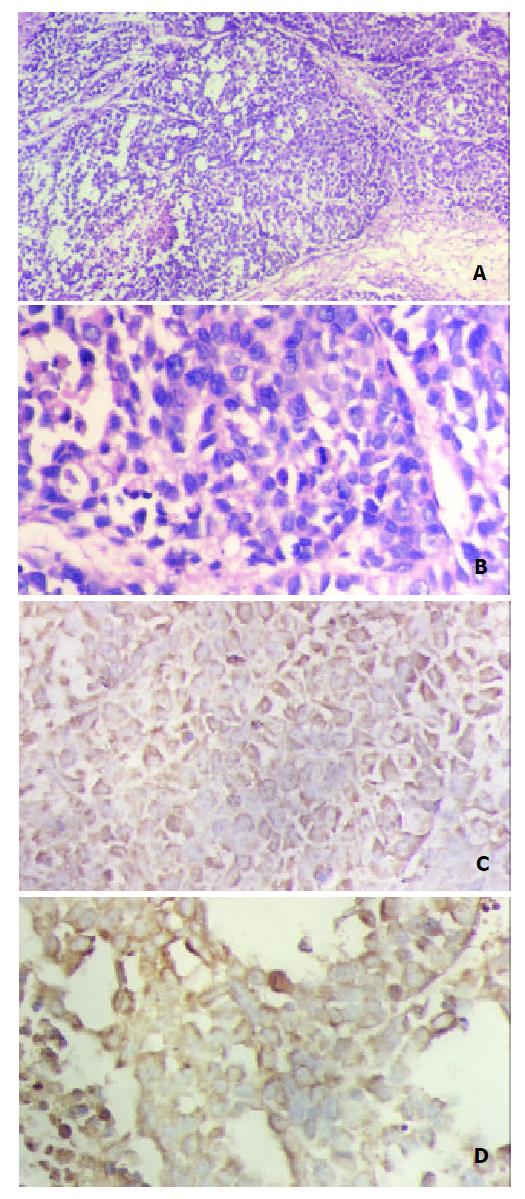
Figure 7 pRcHCNS3-5’ induced hepatacellular carcinoma (7a HE×100, 7b HE×400), HCV NS3 (7c) and c-myc (7d) protein expressing in the tumor tissue by immunohistochemistry (S-P), the positive signals are both in cytoplasm ( × 400).
- Citation: He QQ, Cheng RX, Sun Y, Feng DY, Chen ZC, Zheng H. Hepatocyte transformation and tumor development induced by hepatitis C virus NS3 C-terminal deleted protein. World J Gastroenterol 2003; 9(3): 474-478
- URL: https://www.wjgnet.com/1007-9327/full/v9/i3/474.htm
- DOI: https://dx.doi.org/10.3748/wjg.v9.i3.474


