Copyright
©The Author(s) 2003.
World J Gastroenterol. Mar 15, 2003; 9(3): 423-426
Published online Mar 15, 2003. doi: 10.3748/wjg.v9.i3.423
Published online Mar 15, 2003. doi: 10.3748/wjg.v9.i3.423
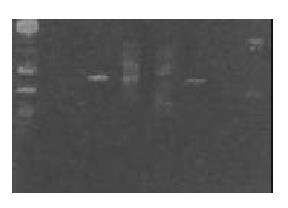
Figure 1 Methylation analysis of p16 gene exon 1 (abnormality).
1: DNA marker; 2: negative control; 3-5 carcinoma tissue; (3: without enzyme treatment, 4: Hpa II treatment, 5: Msp I treatment); 6-8 normal tissue (6: without enzyme treatment, 7: Hpa II treatment, 8: MspI treatment).
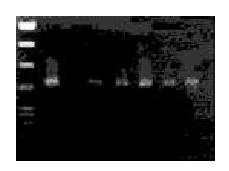
Figure 2 Methylation analysis of p16 gene exon 1 (no abnormality).
1: DNA marker; 2: negative control; 3-5 carci-noma tissue (3: without enzyme treatment, 4: Hpa II treatment, 5: MspI treatment); 6-8 normal tissue (6: without enzyme treatment, 7: Hpa II treatment, 8: MspI treatment).
Figure 3 PCR of p16 gene exon 1 of gastric carcinoma tissue.
1: Marker; 3: negative control; 2-8: 336bp of E1 PCR.
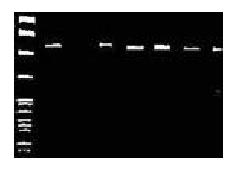
Figure 4 PCR of p16 gene exon 2 of gastric carcinoma tissue.
1: Marker; 2-8: 424bp of E2 PCR; 3: deletion.
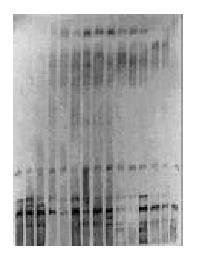
Figure 5 PCR-SSCP of p16 gene exon 1 (no abnormality).
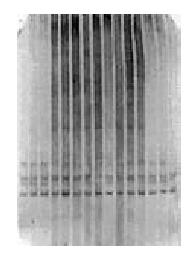
Figure 6 PCR-SSCP of p16 gene exon 1.
Abnormal single strand occurred in 2, 3 lane (adjacent carcinoma and carcinoma tissue) and 9 lane (carcinoma tissue).
-
Citation: Ding Y, Le XP, Zhang QX, Du P. Methylation and mutation analysis of
p16 gene in gastric cancer. World J Gastroenterol 2003; 9(3): 423-426 - URL: https://www.wjgnet.com/1007-9327/full/v9/i3/423.htm
- DOI: https://dx.doi.org/10.3748/wjg.v9.i3.423


