Copyright
©The Author(s) 2003.
World J Gastroenterol. Feb 15, 2003; 9(2): 242-245
Published online Feb 15, 2003. doi: 10.3748/wjg.v9.i2.242
Published online Feb 15, 2003. doi: 10.3748/wjg.v9.i2.242
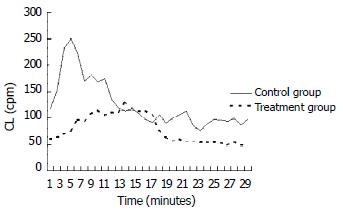
Figure 1 Time-course of CL change in control and treatment groups of BGC823.
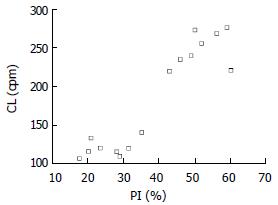
Figure 2 Correlations between CL and PI in BGC823.
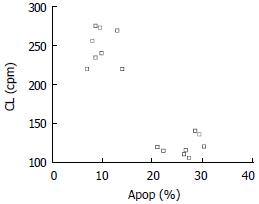
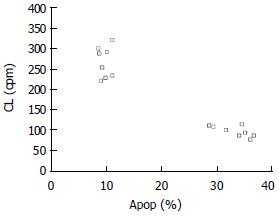
Figure 3 Correlations between CL and apoptotic fraction in BGC823.
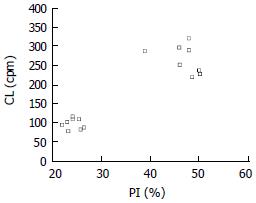
Figure 4 Correlations between CL and PI in LoVo.
Figure 5 Correlations between CL and apoptotic fraction in LoVo.
- Citation: Chen C, Liu FK, Qi XP, Li JS. The study of chemiluminescence in gastric and colonic carcinoma cell lines treated by anti-tumor drugs. World J Gastroenterol 2003; 9(2): 242-245
- URL: https://www.wjgnet.com/1007-9327/full/v9/i2/242.htm
- DOI: https://dx.doi.org/10.3748/wjg.v9.i2.242


