Copyright
©The Author(s) 2003.
World J Gastroenterol. Oct 15, 2003; 9(10): 2325-2327
Published online Oct 15, 2003. doi: 10.3748/wjg.v9.i10.2325
Published online Oct 15, 2003. doi: 10.3748/wjg.v9.i10.2325
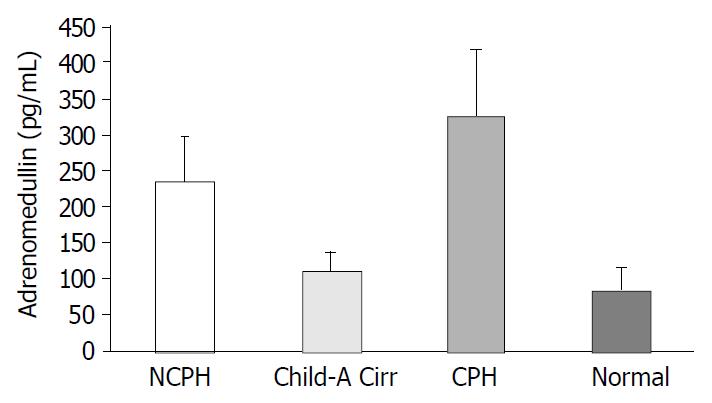
Figure 1 Adrenomedullin levels in various groups.
NCPH: Non-cirrhotic portal hypertension, Cirr: Cirrhosis, CPH: Cir-rhotic portal hypertension, Normal: Healthy subjects. NCPH vs Child-Pugh A Cirr: P < 0.0001, NCPH vs Healthy Subjets: P < 0.0001, NCPH vs Child-Pugh C CPH: P = 0.002.
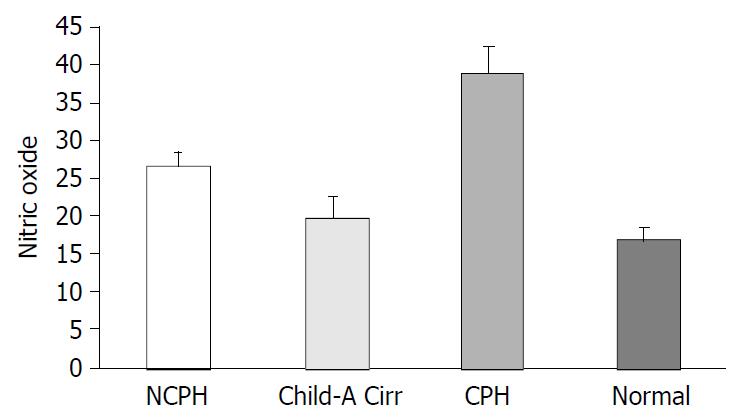
Figure 2 Nitric oxide levels in various groups.
NCPH: Non-cirrhotic portal hypertension, Cirr: Cirrhosis, CPH: Cirrhotic portal hypertension, Normal: Healthy subjects. NCPH vs Child-Pugh A Cirr: P < 0.0001, NCPH vs Healthy Subjets: P < 0.0001, NCPH vs Child-Pugh CCPH: P < 0.0001.
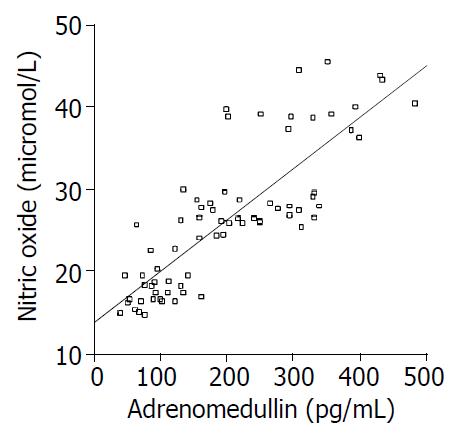
Figure 3 Correlation between nitric oxide and adrenomedullin A significant correlation was observed between two vasoac-tive agents (r = 0.
827, P < 0.0001).
- Citation: Tahan V, Avsar E, Karaca C, Uslu E, Eren F, Aydin S, Uzun H, Hamzaoglu H, Besisik F, Kalayci C, Okten A, Tozun N. Adrenomedullin in cirrhotic and non-cirrhotic portal hypertension. World J Gastroenterol 2003; 9(10): 2325-2327
- URL: https://www.wjgnet.com/1007-9327/full/v9/i10/2325.htm
- DOI: https://dx.doi.org/10.3748/wjg.v9.i10.2325


