Copyright
©The Author(s) 2003.
World J Gastroenterol. Oct 15, 2003; 9(10): 2160-2163
Published online Oct 15, 2003. doi: 10.3748/wjg.v9.i10.2160
Published online Oct 15, 2003. doi: 10.3748/wjg.v9.i10.2160
Figure 1 RT-PCR products were electrophoresed on 1% aga-rose gel containing ethidium bromide.
The level of β-actin was used as internal control. M: DL2000 DNA marker; C: gastric cancer tissue; N: adjacent normal gastric tissue.
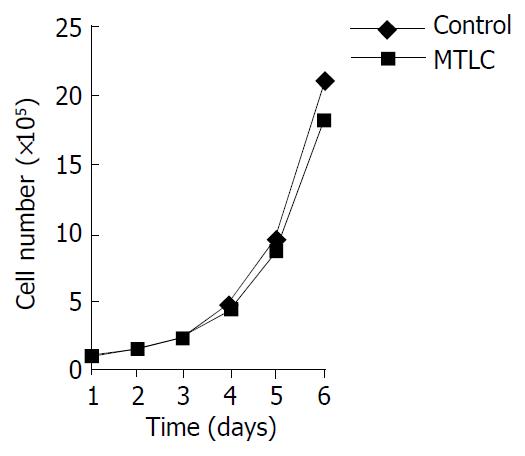
Figure 2 Cells were determined by manual counting daily.
The data was analyzed by Microsoft Excel.
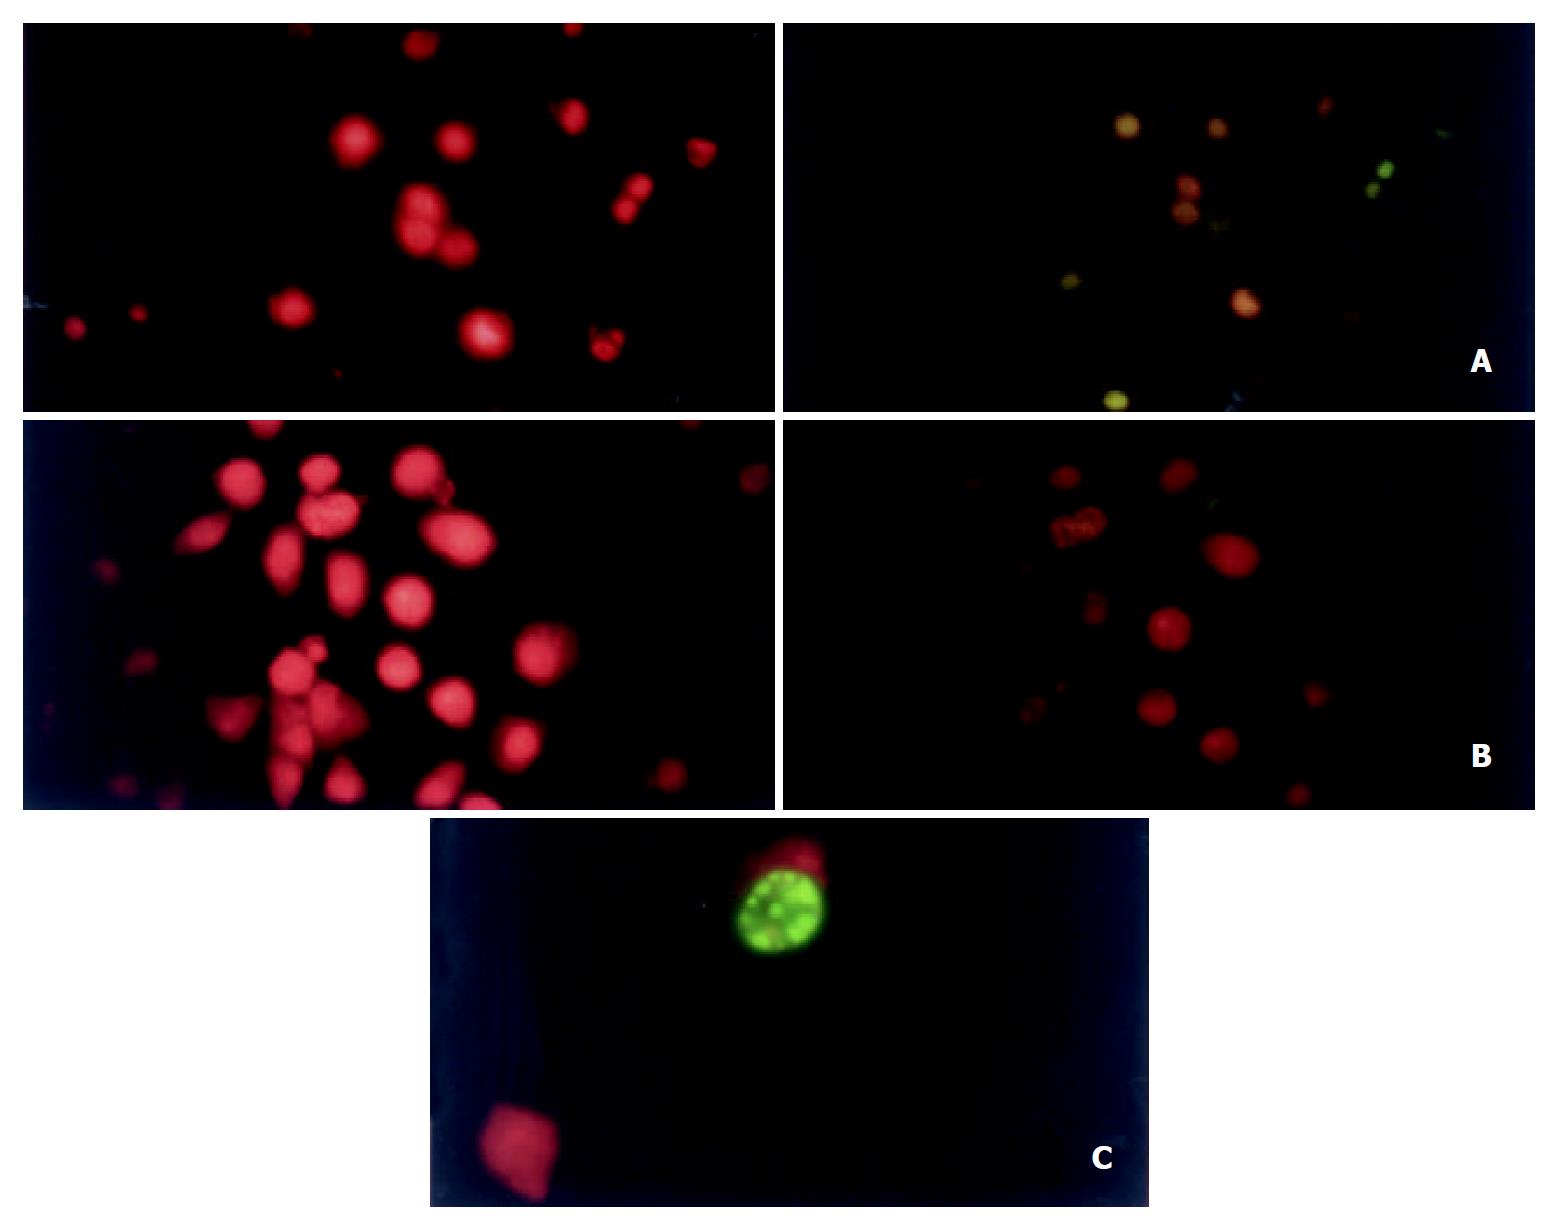
Figure 3 Apoptosis of cells were detected by TUNEL (TdT-mediated dUTP Nick-End Labeling) assay.
Green fluorescence of fluores-cein-12-dUTP was detected in apoptotic cells, whereas red fluorescence of PI was observed in all cells. Both signals in a same field were photographed respectively. A: MTLC-expressing cells (× 400); B: control cells (× 400). C: a single apoptotic cell (× 1000).
- Citation: Qiu GB, Gong LG, Hao DM, Zhen ZH, Sun KL. Expression of MTLC gene in gastric carcinoma. World J Gastroenterol 2003; 9(10): 2160-2163
- URL: https://www.wjgnet.com/1007-9327/full/v9/i10/2160.htm
- DOI: https://dx.doi.org/10.3748/wjg.v9.i10.2160


