Copyright
©The Author(s) 200.
World J Gastroenterol. Jun 15, 2002; 8(3): 413-417
Published online Jun 15, 2002. doi: 10.3748/wjg.v8.i3.413
Published online Jun 15, 2002. doi: 10.3748/wjg.v8.i3.413
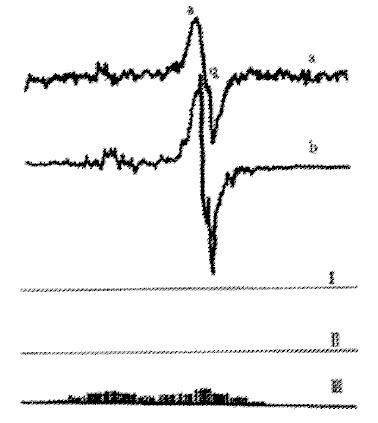
Figure 1 Simulation of ESR spectrum of bilirubin.
(a) The experimental spectrum; (b): Simulating spectrum. (I) Superoxide radical; (II) Semiquinone radical; (III) Free electron of superoxideradical delocalized to tetrapyrrole (heterotropism is ignored).
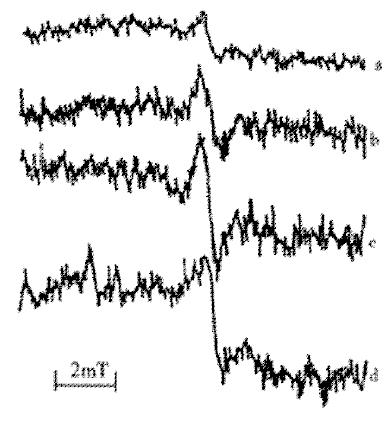
Figure 2 ESR spectra of bilirubin treated with: (a) Bilirubin (from Sigma) as control; (b) 60Co (100Gy); (c) ·OH (Fe (II) + EDTA); (d) O2·- (XO/XOD).
The relative intensity of ESR peak is: a:b:c:d = 1:2.1:2.8:3.9
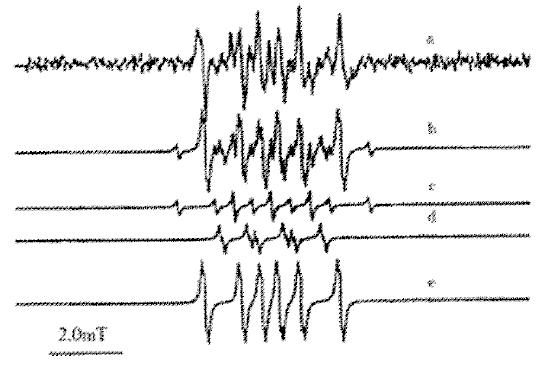
Figure 3 ESR spectra of spin-trapping of bilirubin free radical in solution.
(a) DMPO-traping spectrum of bilirubin; (b) computer simulating spectrum; (c) Simulating spectru of DMPO-H; (d) Simulating spectrum of DMPO-OOH; (e) simulating spectrum of DMPO-CH2R.
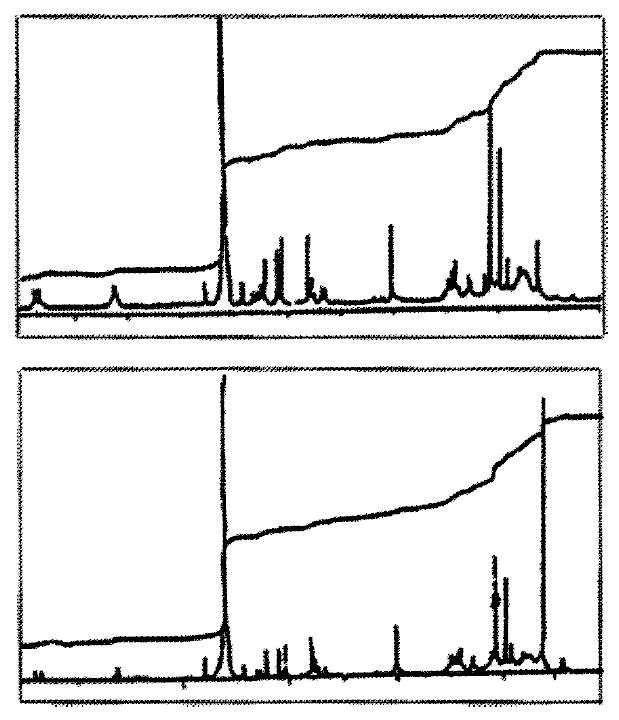
Figure 4 IH-NMR spectra of bilirubin.
(A) commercial bilirubin (from Sigma); (B) bilirubin treated with 60Co.
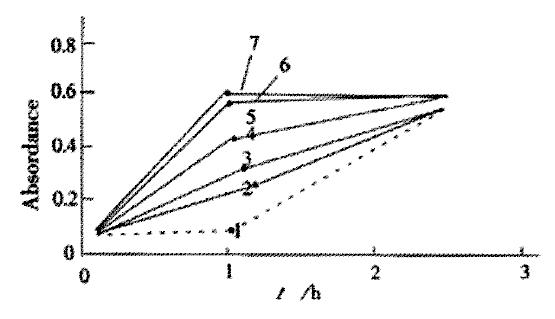
Figure 5 Leakage of lactate dehydrogenase (LDH) of hepa tocyte.
1. Control; 2-7. Treated with BRVC, BRcomm + BSA, BRcomm, BRCo, BRFe, BRXO/XOD
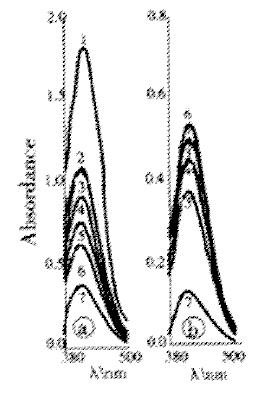
Figure 6 Absorption curve of total and oxidezed glutathione level of hepatocyte.
(A) Total glutathione; (B) Oxidized glutathione 1. Control; 2-7. Treated with BRVC, BRcomm + BSA, BRcomm, BRCo, BRFe, BRXO/XOD
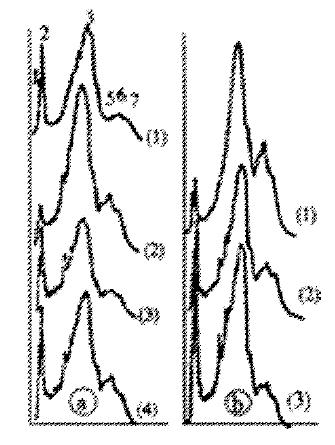
Figure 7 Scans of SDS-PAGE stained with Coomassie blue R-250.
(A) 1. control, 2-4 human erythrocyte membrane treated with BRCo, the irradation doses are 100, 50, 5 (Gy) respectively; (B) human erythrocyte membrane treated with BRFe, the concentrations of 1-3 are 16.67, 13.3, 6.7 (mmol/L) respectively
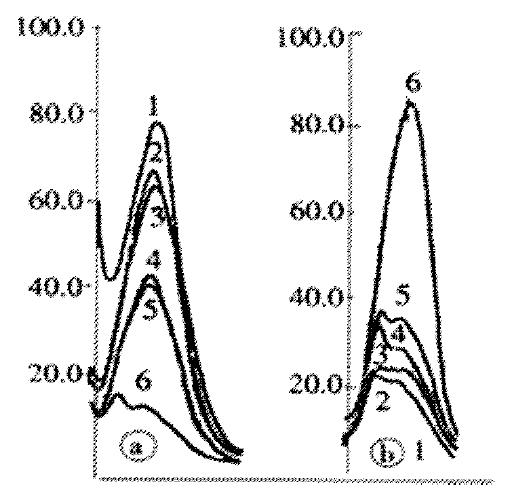
Figure 8 Fluorescence spectrum of erythocyte proteins labeled with fluorescamine.
(A) In the precipitated proteins; (B) In the supernatants. 1. control, 2.BRVC, 3.BRcomm, 4-5. BRFeªª (10 and 20 mmol/L) 6. BRCo (100 Gy)
Math 1 Math(A1).
- Citation: Liu XT, Hu J. Relationship between bilirubin free radical and formation of pigment gallstone. World J Gastroenterol 2002; 8(3): 413-417
- URL: https://www.wjgnet.com/1007-9327/full/v8/i3/413.htm
- DOI: https://dx.doi.org/10.3748/wjg.v8.i3.413


