Copyright
©The Author(s) 2002.
World J Gastroenterol. Feb 15, 2002; 8(1): 40-43
Published online Feb 15, 2002. doi: 10.3748/wjg.v8.i1.40
Published online Feb 15, 2002. doi: 10.3748/wjg.v8.i1.40
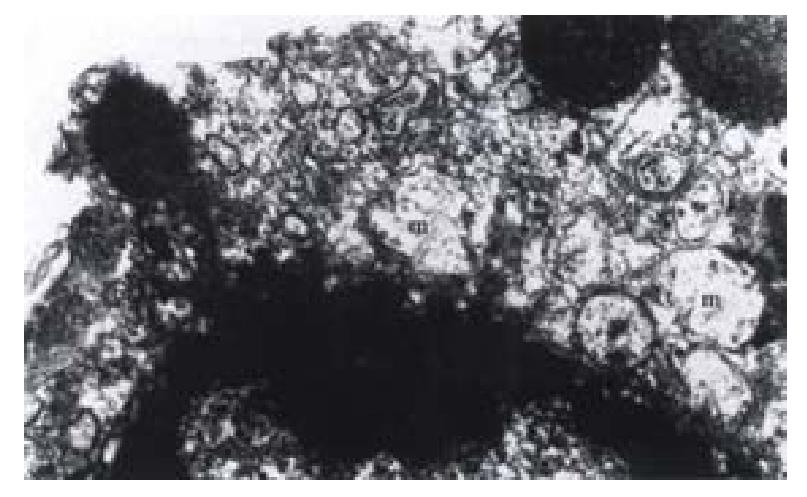
Figure 1 Ultrastructure of SHEEC1 cell treated with 3 μmol·L-1 As2O3.
Apoptotic appearance displayed with swelling of mitochondria and nuclear chroma-tin coagulating and merginating. m, mitochondria. n, nucleus. EM, × 7000
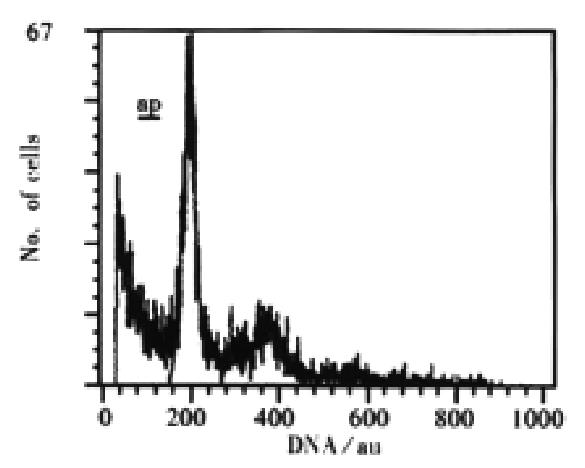
Figure 2 DNA histogram of SHEEC1 cell in 24 h after 3 μmol·L-1 of As2O3 adding.
ap, apoptotic peak.
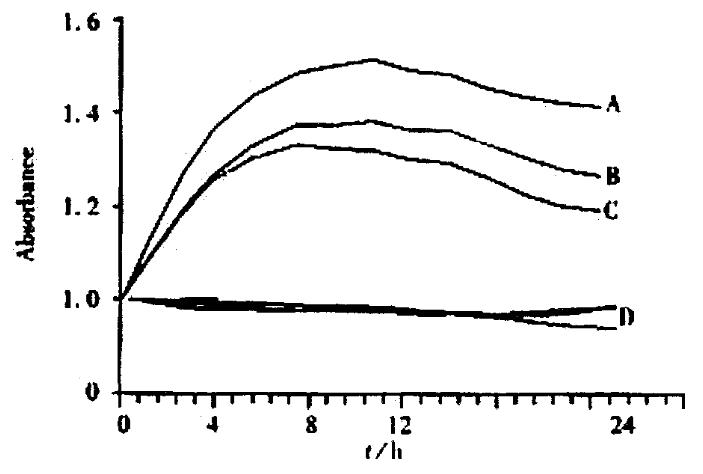
Figure 3 NO determination of SHEEC1 treated with different concentra-tion of As2O3.
NO increased markedly in 5 μmol·L-1 of As2O3 group (A), intermediately in 3 μmol·L-1 of As2O3 group (B) and lowly in 1 μmol·L-1 of As2O3 group (C). The control group, 0 μmol·L-1 of As2O3, were remained on the basal lines (D).
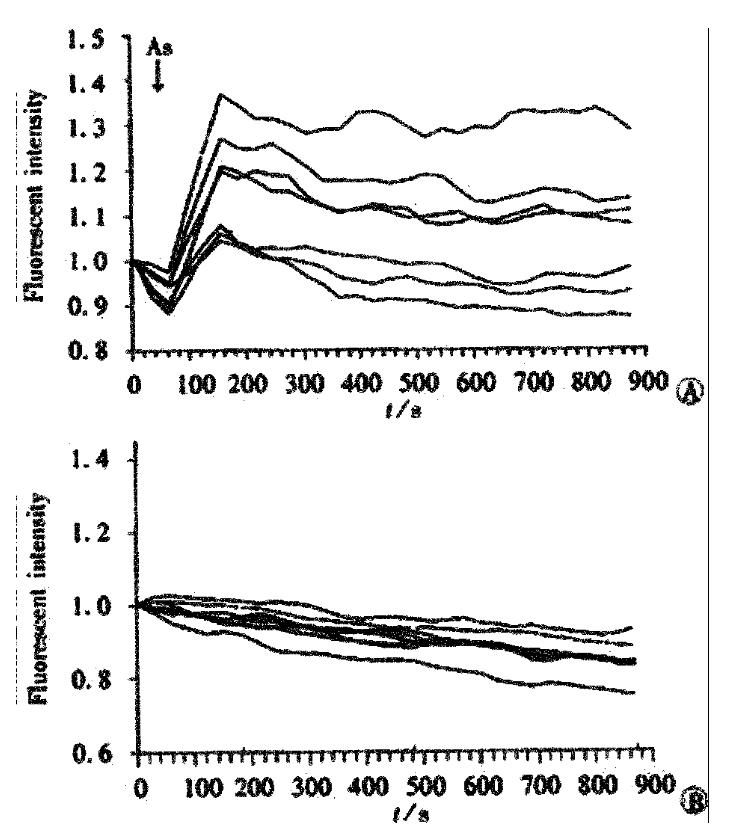
Figure 4 Dynamic changes of intracellular calcium in 7 cells of SHEEC1 treated with As2O3.
A, SHEEC1 cells treated with As2O3 in 3 μmol·L-1. B, Control group without adding As2O3.
- Citation: Shen ZY, Shen WY, Chen MH, Shen J, Cai WJ, Yi Z. Nitric oxide and calcium ions in apoptotic esophageal carcinoma cells induced by arsenite. World J Gastroenterol 2002; 8(1): 40-43
- URL: https://www.wjgnet.com/1007-9327/full/v8/i1/40.htm
- DOI: https://dx.doi.org/10.3748/wjg.v8.i1.40


