Copyright
©The Author(s) 2001.
World J Gastroenterol. Dec 15, 2001; 7(6): 872-875
Published online Dec 15, 2001. doi: 10.3748/wjg.v7.i6.872
Published online Dec 15, 2001. doi: 10.3748/wjg.v7.i6.872
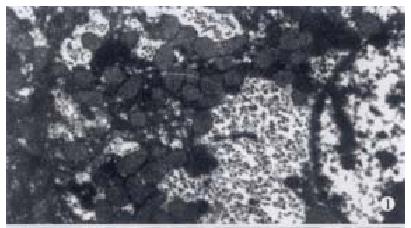
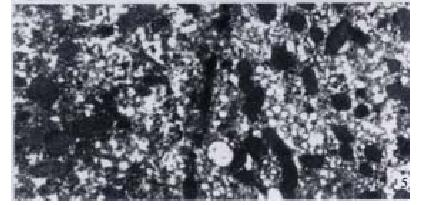
Figure 1 Normal group Showing clear liver cell structure with plenty of mitochondria and clear ridges, no fat droplets in cytoplasm.
EM × 6000
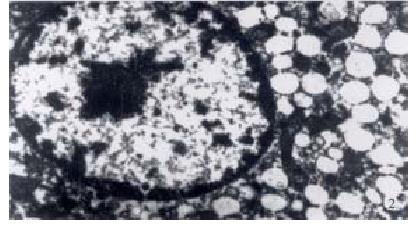
Figure 2 Model group Showing few mitochondria without nucleolus, cell structure is not clear, a lot of fat droplets in cytoplasm.
EM × 4000
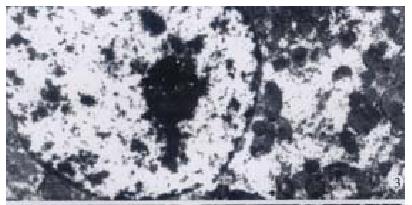
Figure 3 High dosed BOL group Showing clear nucleus structure, lightly tumid mitochondria and few fat droplets in cytoplasm.
EM × 4000
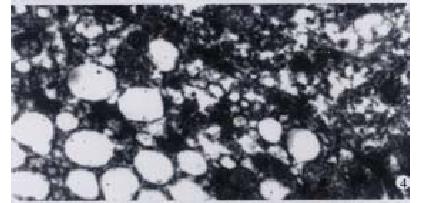
Figure 4 Model group Showing many deposited fibers.
EM × 8000
Figure 5 High dosed BOL group Showing few deposited fibers.
EM × 5000
- Citation: Yao L, Yao ZM, Yu T. Influence of BOL on hyaluronic acid, laminin and hyperplasia in hepatofibrotic rats. World J Gastroenterol 2001; 7(6): 872-875
- URL: https://www.wjgnet.com/1007-9327/full/v7/i6/872.htm
- DOI: https://dx.doi.org/10.3748/wjg.v7.i6.872


